Shareholder Report
|
12 Months Ended |
|
Jan. 31, 2026
USD ($)
Holding
|
|---|
| Shareholder Report [Line Items] |
|
| Document Type |
N-CSR
|
| Amendment Flag |
false
|
| Registrant Name |
VALUED ADVISERS TRUST
|
| Entity Central Index Key |
0001437249
|
| Entity Investment Company Type |
N-1A
|
| Document Period End Date |
Jan. 31, 2026
|
| Shareholder Report Annual or Semi-Annual |
Annual Shareholder Report
|
| C000227329 |
|
| Shareholder Report [Line Items] |
|
| Fund Name |
Channing Intrinsic Value Small-Cap Fund
|
| Class Name |
Institutional Class
|
| Trading Symbol |
OWLLX
|
| Annual or Semi-Annual Statement [Text Block] |
This annual shareholder report contains important information about Channing Intrinsic Value Small-Cap Fund for the period of February 1, 2025 to January 31, 2026.
|
| Additional Information [Text Block] |
You can find additional information about the Fund at https://funddocs.filepoint.com/channing/. You can also request this information by contacting us at (833)
565-1919.
|
| Additional Information Phone Number |
(833)
565-1919
|
| Additional Information Website |
https://funddocs.filepoint.com/channing/
|
| Expenses [Text Block] |
What were the Fund’s costs for the last year?(based on a hypothetical $10,000 investment) Table SummaryClass Name | Costs of a $10,000 investment | Costs paid as a percentage of a $10,000 investment |
|---|
Institutional | $102 | 0.95% |
|---|
|
| Expenses Paid, Amount |
$ 102
|
| Expense Ratio, Percent |
0.95%
|
| Line Graph [Table Text Block] |
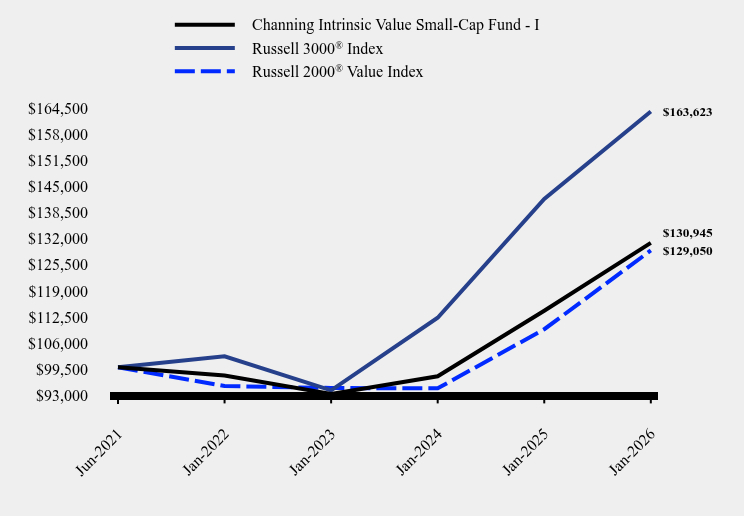
Table Summary | Channing Intrinsic Value Small-Cap Fund - I | Russell 3000® Index | Russell 2000® Value Index |
|---|
Jun-2021 | $100,000 | $100,000 | $100,000 |
|---|
Jan-2022 | $97,972 | $102,743 | $95,342 |
|---|
Jan-2023 | $93,345 | $94,273 | $94,843 |
|---|
Jan-2024 | $97,755 | $112,324 | $94,753 |
|---|
Jan-2025 | $114,055 | $141,883 | $109,461 |
|---|
Jan-2026 | $130,945 | $163,623 | $129,050 |
|---|
|
| Average Annual Return [Table Text Block] |
Average Annual Total Returns Table Summary | 1 Year | Since Inception (June 30, 2021) |
|---|
Channing Intrinsic Value Small-Cap Fund - I | 14.81% | 6.05% |
|---|
Russell 3000® Index | 15.32% | 11.33% |
|---|
Russell 2000® Value Index | 17.90% | 5.71% |
|---|
The Fund's past performance is not a good predictor of how the Fund will perform in the future. The graph and table do not reflect the deduction of taxes that a shareholder would pay on Fund distributions or sale of shares. |
| Performance Inception Date |
Jun. 30, 2021
|
| AssetsNet |
$ 10,666,187
|
| Holdings Count | Holding |
46
|
| Advisory Fees Paid, Amount |
$ 0
|
| InvestmentCompanyPortfolioTurnover |
76.00%
|
| Additional Fund Statistics [Text Block] |
Table SummaryNet Assets | $10,666,187 |
|---|
Number of Portfolio Holdings | 46 |
|---|
Advisory Fee (net of waivers) | $0 |
|---|
Portfolio Turnover | 76% |
|---|
|
| Holdings [Text Block] |
Top 10 Holdings (% of net assets)Table SummaryHolding Name | % of Net Assets |
|---|
MSA Safety, Inc. | 2.8% |
|---|
Valvoline, Inc. | 2.8% |
|---|
Timken Co. (The) | 2.8% |
|---|
Littelfuse, Inc. | 2.8% |
|---|
Gates Industrial Corp. PLC | 2.7% |
|---|
Atmus Filtration Technologies, Inc. | 2.7% |
|---|
Parsons Corp. | 2.7% |
|---|
McGrath RentCorp | 2.7% |
|---|
Brink's Co. (The) | 2.6% |
|---|
Affiliated Managers Group, Inc. | 2.6% |
|---|
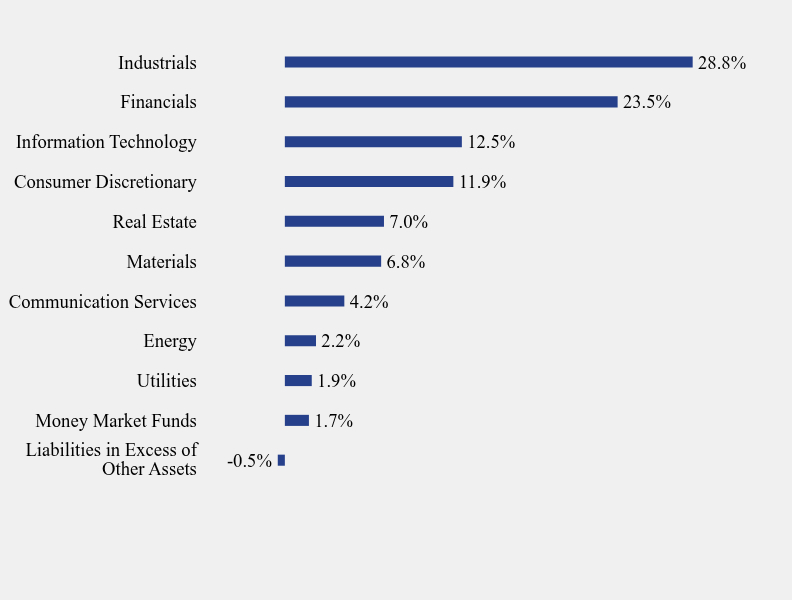
Sector Weighting (% of net assets)Table SummaryValue | Value |
|---|
Liabilities in Excess of Other Assets | -0.5% | Money Market Funds | 1.7% | Utilities | 1.9% | Energy | 2.2% | Communication Services | 4.2% | Materials | 6.8% | Real Estate | 7.0% | Consumer Discretionary | 11.9% | Information Technology | 12.5% | Financials | 23.5% | Industrials | 28.8% | |
| Material Fund Change [Text Block] |
No material changes occurred during the year ended January 31, 2026. |
| C000248358 |
|
| Shareholder Report [Line Items] |
|
| Fund Name |
Regan Floating Rate MBS ETF
|
| Trading Symbol |
MBSF
|
| Additional Information Phone Number |
(844) 988-6273
|
| Additional Information Website |
https://www.regancapital.com/etf-mbsf/
|
| Expenses Paid, Amount |
$ 50
|
| Expense Ratio, Percent |
0.49%
|
| Performance Past Does Not Indicate Future [Text] |
The Fund's past performance is not a good predictor of how the Fund will perform in the future.
|
| Performance Inception Date |
Feb. 27, 2024
|
| No Deduction of Taxes [Text Block] |
The graph and table do not reflect the deduction of taxes that a shareholder would pay on fund distributions or redemption of fund shares.
|
| AssetsNet |
$ 175,525,648
|
| Holdings Count | Holding |
300
|
| Advisory Fees Paid, Amount |
$ 771,236
|
| InvestmentCompanyPortfolioTurnover |
37.00%
|
| C000074420 |
|
| Shareholder Report [Line Items] |
|
| Fund Name |
Summitry Equity Fund
|
| Trading Symbol |
GGEFX
|
| Additional Information Phone Number |
(866) 954-6682
|
| Additional Information Website |
https://summitryfunds.com/reports/
|
| Expenses [Text Block] |
What were the Fund’s costs for the last year?(based on a hypothetical $10,000 investment) Fund Name | Costs of a $10,000 investment | Costs paid as a percentage of a $10,000 investment |
|---|
Summitry Equity Fund | $129 | 1.25% |
|---|
|
| Expenses Paid, Amount |
$ 129
|
| Expense Ratio, Percent |
1.25%
|
| Performance Past Does Not Indicate Future [Text] |
The Fund's past performance is not a good predictor of how the Fund will perform in the future.
|
| No Deduction of Taxes [Text Block] |
The graph and table do not reflect the deduction of taxes that a shareholder would pay on fund distributions or redemption of fund shares.
|
| AssetsNet |
$ 80,591,277
|
| Holdings Count | Holding |
28
|
| Advisory Fees Paid, Amount |
$ 686,012
|
| InvestmentCompanyPortfolioTurnover |
16.00%
|
| Additional Fund Statistics [Text Block] |
Net Assets | $80,591,277 |
|---|
Number of Portfolio Holdings | 28 |
|---|
Advisory Fee (net of waivers) | $686,012 |
|---|
Portfolio Turnover | 16% |
|---|
|
| Holdings [Text Block] |
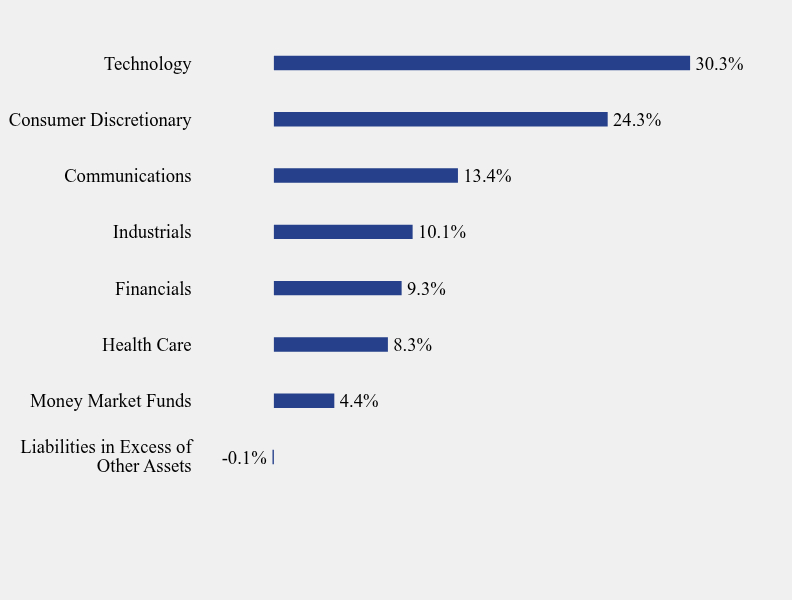
Sector Weighting (% of net assets)Value | Value |
|---|
Liabilities in Excess of Other Assets | -0.1% | Money Market Funds | 4.4% | Health Care | 8.3% | Financials | 9.3% | Industrials | 10.1% | Communications | 13.4% | Consumer Discretionary | 24.3% | Technology | 30.3% |
|