Value of Initial Fixed | ||||||||||||||||
Investment Based on: | ||||||||||||||||
Summary | Average Summary | Average | Peer Group | |||||||||||||
Compensation | Compensation | Compensation on | Compensation | Total | Total | |||||||||||
on Table Total | Actually | Table Total for | Actually Paid to | Shareholder | Shareholder | Adjusted | ||||||||||
for PEO (1) | Paid to PEO (2) | Non-PEO NEOs (3) | Non-PEO NEOs (4) | Return (5) | Return (5) | Net Income | Net Income (6) | |||||||||
Year | ($) | ($) | ($) | ($) | (%) | (%) | ($) | ($) | ||||||||
2025 | 3,108,135 | 3,491,029 | 1,751,036 | 2,042,647 | 106.78 | 96.01 | 80,310,000 | 102,570,000 | ||||||||
2024 | 2,693,418 | 3,117,679 | 884,506 | 1,158,337 | 85.86 | 47.85 | 85,264,000 | 86,408,000 | ||||||||
2023 | 2,294,391 | 2,184,116 | 794,666 | 720,869 | 19.90 | (3.35) | 91,729,000 | 96,997,000 | ||||||||
2022 | 1,702,083 | 2,006,937 | 693,748 | 802,770 | 22.84 | (2.48) | 67,405,000 | 71,814,000 | ||||||||
2021 | 1,717,080 | 2,057,620 | 701,022 | 861,926 | (4.93) | 24.06 | 20,044,000 | 39,800,000 | ||||||||
| (1) | PEO for 2021, 2022, 2023, 2024, and 2025 was James Eccher. |
| (2) | This column represents the “compensation actually paid” to our PEO for each year, determined by starting with the amount set forth in the Summary Compensation Table (“SCT”) in the column entitled “Total Compensation” for the applicable year and adjusting that amount as follows: |
PEO | ||||||||||
2025 | 2024 | 2023 | 2022 | 2021 | ||||||
($) | ($) | ($) | ($) | ($) | ||||||
Summary Compensation Table Total Compensation | 3,108,135 | 2,693,418 | 2,294,391 | 1,702,083 | 1,717,080 | |||||
Less Grant Date Fair Value of RSU Awards in Covered Fiscal Year | (1,075,067) | (1,043,772) | (862,809) | (501,517) | (463,986) | |||||
Add Change in Fair Value of Outstanding and Unvested RSU Awards Granted in Prior Years and Covered Fiscal Year | 1,457,961 | 1,468,033 | 752,535 | 806,371 | 804,526 | |||||
Compensation Actually Paid | 3,491,029 | 3,117,679 | 2,184,116 | 2,006,937 | 2,057,620 | |||||
| (3) | The non-PEO named executive officers included for purposes of calculating the average compensation amounts reported in this table were, for 2025, Bradley Adams, Gary Collins, Darin Campbell and Donald Pilmer, and for 2024, 2023, 2022 and 2021, Bradley Adams, Gary Collins, Donald Pilmer and Richard Gartelmann. |
| (4) | This column represents the average “compensation actually paid” to our non-PEO NEOs for each year, determined by starting with the amount set forth in the SCT in the column entitled “Total Compensation” for the applicable year (and taking the average of those amounts for the non-PEO NEOs) and adjusting that amount as follows: |
Non-PEO NEOs | ||||||||||
2025 | 2024 | 2023 | 2022 | 2021 | ||||||
($) | ($) | ($) | ($) | ($) | ||||||
Summary Compensation Table Total Compensation | 1,751,036 | 884,506 | 794,666 | 693,748 | 701,022 | |||||
Less Grant Date Fair Value of RSU Awards in Covered Fiscal Year | (177,825) | (248,231) | (215,659) | (171,857) | (163,566) | |||||
Add Change in Fair Value of Outstanding and Unvested RSU Awards Granted in Prior Years and Covered Fiscal Year | 469,436 | 522,061 | 141,863 | 280,879 | 324,470 | |||||
Compensation Actually Paid | 2,042,647 | 1,158,337 | 720,869 | 802,770 | 861,926 | |||||
| (5) | The Peer Group TSR disclosed in this table utilizes the KBW NASDAQ Bank Index (“KBW Bank Index”), which we also use in the stock performance chart required by Item 201(e) of Regulation S-K included in our Annual Report Form 10-K for the year ended December 31, 2025. The two columns assume $100 was invested for the period starting December 31, 2021 and through the end of the listed year in each of the Company and in the KBW Bank Index, respectively. All dollar values assume reinvestment of pre-tax dividends paid by companies, where applicable, included in the KBW Bank Index. Historical stock performance is not necessarily indicative of future stock performance. |
| (6) | Adjusted Net Income is a non-GAAP measure we use to compare periods by excluding material transactions that are not considered core to our business or may not reflect the effects of operations. We determined Adjusted Net Income to be the most important financial performance measure used to link Company performance to Compensation Actually Paid to our PEO and Non-PEO NEOs in 2025. The Adjusted Net Income used for compensation differs from that disclosed in the Form 10-K. See our reconciliation to GAAP Net Income on page 49. |
| (1) | PEO for 2021, 2022, 2023, 2024, and 2025 was James Eccher. |
| (3) | The non-PEO named executive officers included for purposes of calculating the average compensation amounts reported in this table were, for 2025, Bradley Adams, Gary Collins, Darin Campbell and Donald Pilmer, and for 2024, 2023, 2022 and 2021, Bradley Adams, Gary Collins, Donald Pilmer and Richard Gartelmann. |
| (5) | The Peer Group TSR disclosed in this table utilizes the KBW NASDAQ Bank Index (“KBW Bank Index”), which we also use in the stock performance chart required by Item 201(e) of Regulation S-K included in our Annual Report Form 10-K for the year ended December 31, 2025. The two columns assume $100 was invested for the period starting December 31, 2021 and through the end of the listed year in each of the Company and in the KBW Bank Index, respectively. All dollar values assume reinvestment of pre-tax dividends paid by companies, where applicable, included in the KBW Bank Index. Historical stock performance is not necessarily indicative of future stock performance. |
| (2) | This column represents the “compensation actually paid” to our PEO for each year, determined by starting with the amount set forth in the Summary Compensation Table (“SCT”) in the column entitled “Total Compensation” for the applicable year and adjusting that amount as follows: |
PEO | ||||||||||
2025 | 2024 | 2023 | 2022 | 2021 | ||||||
($) | ($) | ($) | ($) | ($) | ||||||
Summary Compensation Table Total Compensation | 3,108,135 | 2,693,418 | 2,294,391 | 1,702,083 | 1,717,080 | |||||
Less Grant Date Fair Value of RSU Awards in Covered Fiscal Year | (1,075,067) | (1,043,772) | (862,809) | (501,517) | (463,986) | |||||
Add Change in Fair Value of Outstanding and Unvested RSU Awards Granted in Prior Years and Covered Fiscal Year | 1,457,961 | 1,468,033 | 752,535 | 806,371 | 804,526 | |||||
Compensation Actually Paid | 3,491,029 | 3,117,679 | 2,184,116 | 2,006,937 | 2,057,620 | |||||
| (4) | This column represents the average “compensation actually paid” to our non-PEO NEOs for each year, determined by starting with the amount set forth in the SCT in the column entitled “Total Compensation” for the applicable year (and taking the average of those amounts for the non-PEO NEOs) and adjusting that amount as follows: |
Non-PEO NEOs | ||||||||||
2025 | 2024 | 2023 | 2022 | 2021 | ||||||
($) | ($) | ($) | ($) | ($) | ||||||
Summary Compensation Table Total Compensation | 1,751,036 | 884,506 | 794,666 | 693,748 | 701,022 | |||||
Less Grant Date Fair Value of RSU Awards in Covered Fiscal Year | (177,825) | (248,231) | (215,659) | (171,857) | (163,566) | |||||
Add Change in Fair Value of Outstanding and Unvested RSU Awards Granted in Prior Years and Covered Fiscal Year | 469,436 | 522,061 | 141,863 | 280,879 | 324,470 | |||||
Compensation Actually Paid | 2,042,647 | 1,158,337 | 720,869 | 802,770 | 861,926 | |||||
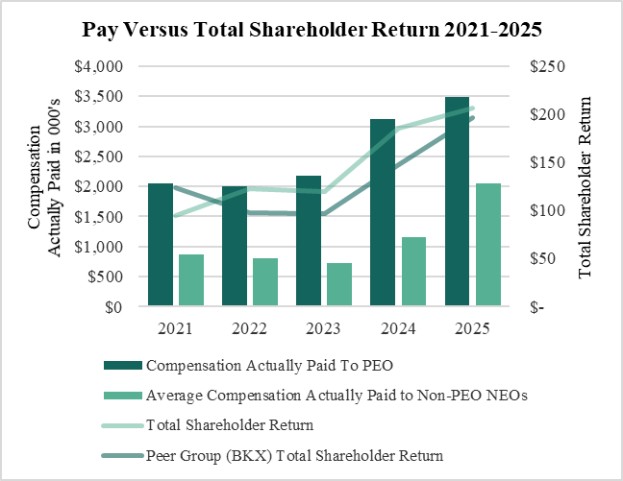
Relationship Between Compensation Actually Paid and Our TSR and Peer Group TSR
The graph below shows the relationship between the compensation actually paid to our PEO and the average compensation actually paid to our non-PEO NEOs and our TSR and the Peer Group TSR.
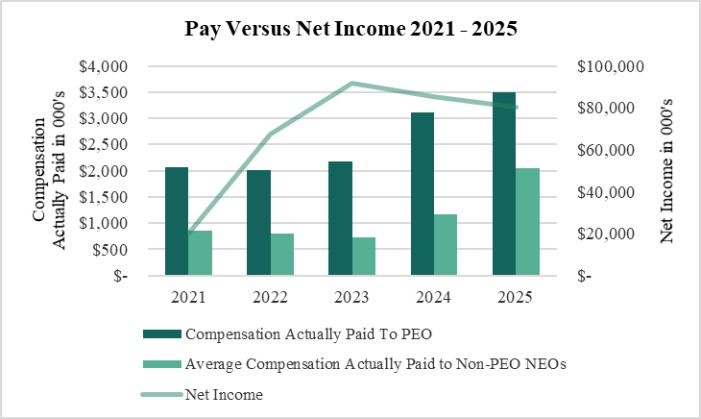
Relationship Between Compensation Actually Paid and Our Net Income
The graph below shows the relationship between the compensation actually paid to our PEO and the average compensation actually paid to our non-PEO NEOs and our net income.
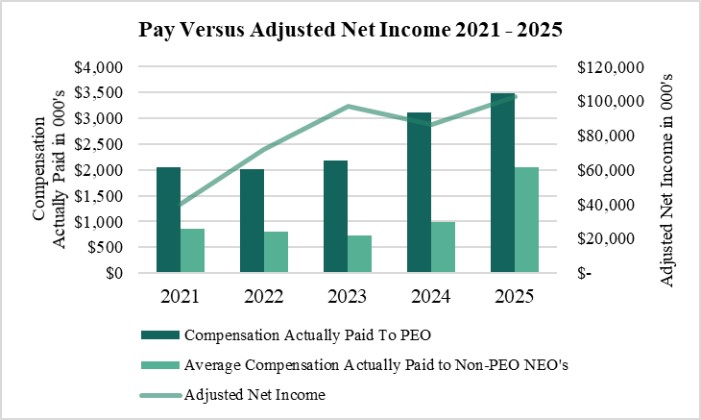
Relationship Between Compensation Actually Paid and Our Adjusted Net Income
The graph below shows the relationship between the compensation actually paid to our PEO and the average compensation actually paid to our non-PEO NEOs and our Adjusted Net Income.
Relationship Between Compensation Actually Paid and Our TSR and Peer Group TSR
The graph below shows the relationship between the compensation actually paid to our PEO and the average compensation actually paid to our non-PEO NEOs and our TSR and the Peer Group TSR.
We consider the following to be the most important financial performance measures used to link compensation actually paid to our NEOs, for 2025, to Company performance. The role of each of these performance measures on our NEOs’ compensation is discussed in the Compensation Discussion and Analysis above. The measures in this table are not ranked.
Performance Measures |
Adjusted Net Income/Peer ROAA |
Asset/Credit Quality |
Adjusted Efficiency Ratio |
| (6) | Adjusted Net Income is a non-GAAP measure we use to compare periods by excluding material transactions that are not considered core to our business or may not reflect the effects of operations. We determined Adjusted Net Income to be the most important financial performance measure used to link Company performance to Compensation Actually Paid to our PEO and Non-PEO NEOs in 2025. The Adjusted Net Income used for compensation differs from that disclosed in the Form 10-K. See our reconciliation to GAAP Net Income on page 49. |