Pay vs Performance Disclosure - USD ($)
Dec. 31, 2025
Dec. 31, 2024
Dec. 31, 2023
Dec. 31, 2022
Dec. 31, 2021
Pay Versus Performance Table
| Value of Initial Fixed $100 Investment Based On: | ||||||||||||||||||||||||||
| Year | Summary Compensation Table Total for PEO(1) | Compensation Actually Paid to PEO | Average Summary Compensation Table Total for Non-PEO NEOs(2) | Average Compensation Actually Paid to Non-POE NEOs | Total Shareholder Return | Peer Group Total Shareholder Return(3) | Net Income ($000s) | Company Selected Metric – Adjusted Company FFO ($000s)(4) | ||||||||||||||||||
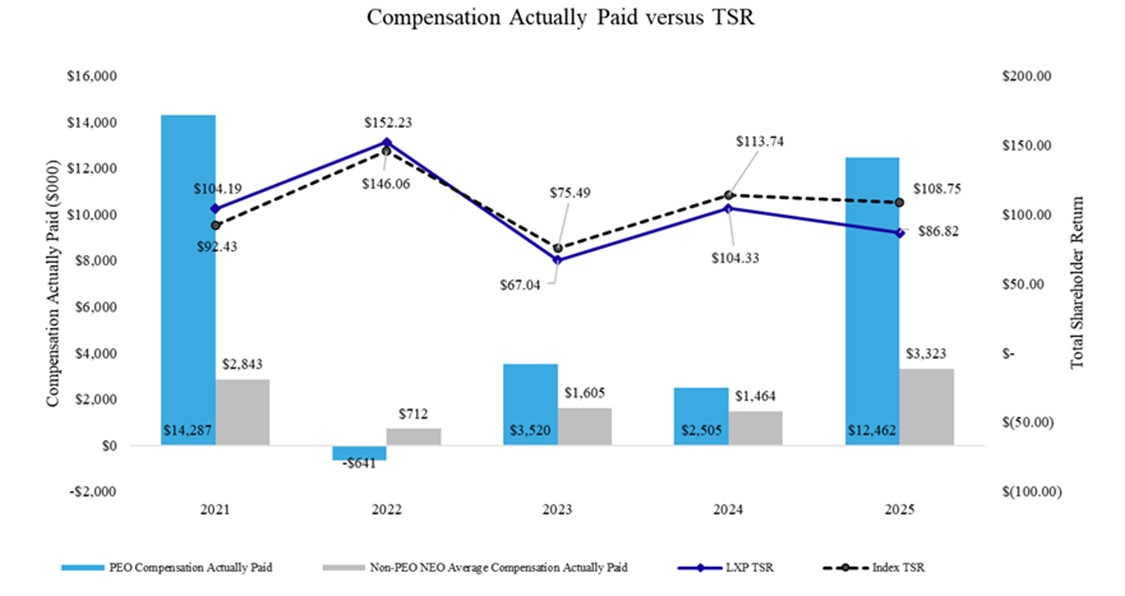
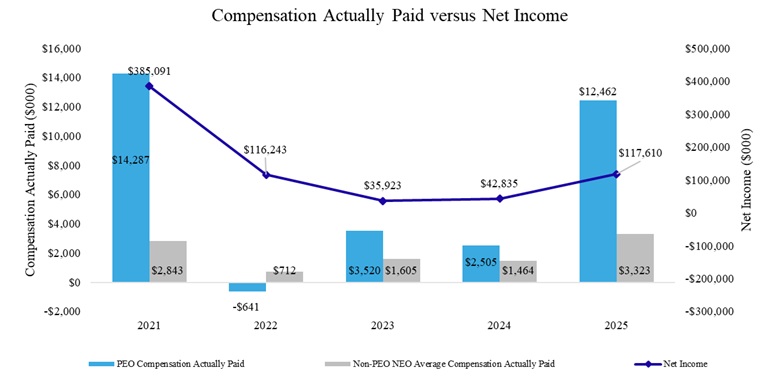
| 2025 | $ | 6,645,384 | $ | 12,461,894 | $ | 1,910,338 | $ | 3,323,325 | $ | 129.76 | $ | 102.95 | $117,610 | $187,324 | ||||||||||||
2024 | $ | 5,681,325 | $ | 2,505,110 | $ | 2,310,009 | $ | 1,464,203 | $ | 86.82 | $ | 108.75 | $42,835 | $189,360 | ||||||||||||
2023 | $ | 5,380,014 | $ | 3,519,916 | $ | 2,073,324 | $ | 1,605,010 | $ | 104.33 | $ | 113.74 | $35,923 | $206,191 | ||||||||||||
2022 | $ | 5,231,778 | $ | (641,147) | $ | 1,852,425 | $ | 711,912 | $ | 67.04 | $ | 75.49 | $116,243 | $193,061 | ||||||||||||
2021 | $ | 6,196,943 | $ | 14,286,704 | $ | 1,660,901 | $ | 2,843,214 | $ | 152.23 | $ | 143.06 | $385,091 | $223,196 | ||||||||||||
| Adjustments to PEO Total Compensation | 2025 | 2024 | 2023 | 2022 | 2021 | ||||||||||||
Amounts reported under “Stock Awards” in Summary Compensation Table | $(4,044,982) | $(3,840,487) | $(3,474,977) | $(3,444,528) | $(3,216,612) | ||||||||||||
Change in Fair Value of Awards Granted in Year and Unvested as of Year-End | $6,012,422 | $2,225,516 | $2,348,293 | $1,627,607 | $4,938,791 | ||||||||||||
Change in Fair Value from Prior Year-End to Current Year-End of Awards Granted Prior to Year that were Outstanding and Unvested as of Year-End | $2,056,143 | $(1,314,936) | $(446,572) | $(2,384,351) | $1,797,122 | ||||||||||||
Fair Value of Awards Granted and Vested in During Year at Vesting Date | $594,216 | $383,045 | $372,595 | $274,919 | $555,135 | ||||||||||||
Change in Fair Value from Prior Year-End to Vesting Date of Awards Granted Prior to Year that Vested During Year | $1,262,015 | $(116,993) | $185,638 | $(1,278,917) | $2,218,082 | ||||||||||||
Fair Value at Year End of Awards Granted Prior to Year that Failed to Meet the Applicable Vesting Conditions During Year | $(441,711) | $(633,952) | $(1,164,718) | $(1,498,393) | $— | ||||||||||||
Dividends or Other Earnings Paid During Year prior to Vesting Date of Award Not Otherwise Included in Total Compensation for the Year | $378,407 | $121,592 | $319,632 | $830,738 | $1,797,242 | ||||||||||||
| Adjustments to Non-PEO NEOs Total Compensation | 2025 | 2024 | 2023 | 2022 | 2021 | ||||||||||||
Amounts reported under “Stock Awards” in Summary Compensation Table | $(921,375) | $(1,289,931) | $(1,071,475) | $(898,500) | $(580,851) | ||||||||||||
Change in Fair Value of Awards Granted in Year and Unvested as of Year-End | $1,369,502 | $828,171 | $724,074 | $424,599 | $891,805 | ||||||||||||
Change in Fair Value from Prior Year-End to Current Year-End of Awards Granted Prior to Year that were Outstanding and Unvested as of Year-End | $489,658 | $(339,694) | $(116,481) | $(430,524) | $261,156 | ||||||||||||
Fair Value of Awards Granted and Vested in During Year at Vesting Date | $135,353 | $90,138 | $114,888 | $71,718 | $100,269 | ||||||||||||
Change in Fair Value from Prior Year-End to Vesting Date of Awards Granted Prior to Year that Vested During Year | $343,045 | $(28,374) | $33,296 | $(184,578) | $331,771 | ||||||||||||
Fair Value at Year End of Awards Granted Prior to Year that Failed to Meet the Applicable Vesting Conditions During Year | $(108,958) | $(139,999) | $(210,303) | $(217,740) | $— | ||||||||||||
Dividends or Other Earnings Paid During Year prior to Vesting Date of Award Not Otherwise Included in Total Compensation for the Year | $105,761 | $33,882 | $57,687 | $94,551 | $178,163 | ||||||||||||
The relationship between compensation actually paid and company performance for the three years presented above aligns with our TSR due to the high percentage of total compensation that consists of equity awards.
Net income is not used in our executive compensation program due to fluctuations in net income experienced by real estate companies due to the impact of items such as depreciation and amortization and gains/losses on sales of properties, which was heavily impacted by the disposition volume in recent years as part of our portfolio transition from diversified to industrial. Although, net income is used to determine certain non-GAAP financial measures used in our executive compensation plan.
Adjusted Company FFO was not used in our executive compensation program for the years presented above due to the impact of our portfolio transition and first-generation vacancy. The portfolio transition entailed selling higher yielding, but riskier office and other assets and recycling the proceeds into lower yielding, but less risky warehouse and distribution assets that have greater rent growth and releasing potential, which impacted Adjusted Company FFO growth in the years presented above. First-generation vacancy impacted year-over-year Adjusted Company FFO growth in 2024. As a result of such impacts, Adjusted Company FFO may not have been aligned with compensation actually paid.

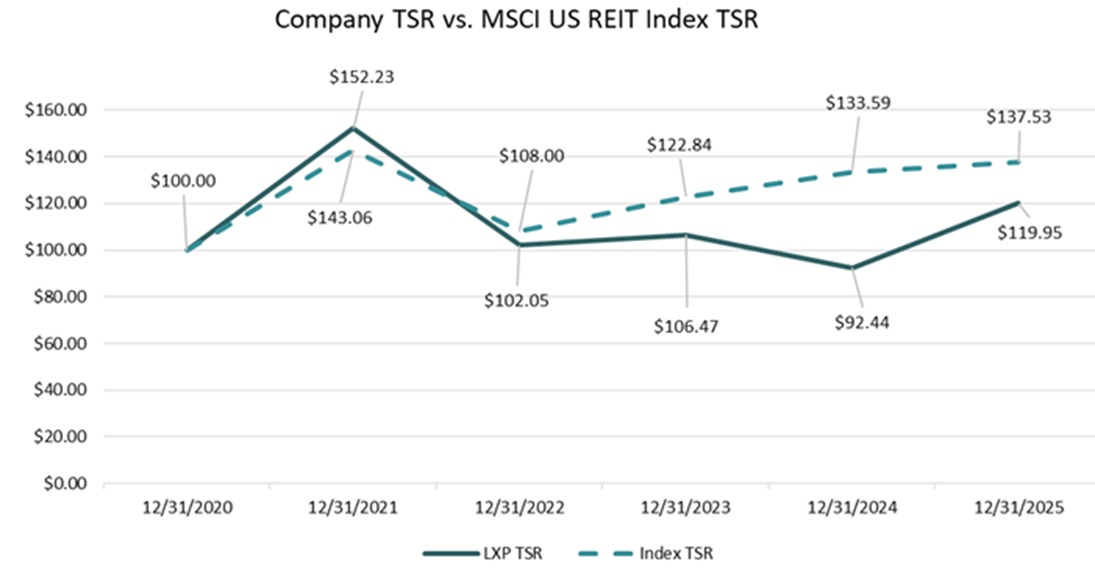
The following illustrates our cumulative TSR for the five-year period beginning December 31, 2020 versus the MSCI US REIT Index.
Our executive compensation programs have significant pay for performance components. The metrics used for our annual cash incentive opportunities are selected based on our then annual business plan and tended to focus on operational matters. The financial measure used for our annual long-term incentive opportunity is solely based on our TSR.
Adjusted Company FFO and TSR are the two most frequently discussed financial measures used with our investors and analysts. Due to the transition of our portfolio from diversified to industrial and the resulting revenue dilution, our Compensation Committee has not included Adjusted Company FFO in the annual cash incentive opportunity as a metric. The long-term incentive opportunity portion of our executive compensation plan consists of a long-term incentive award 60% of which is performance-based non-vested shares and 40% time-based non-vested shares. The performance-based non-vested shares are split into two tranches: (1) 50% is based on our relative TSR compared to the MSCI US REIT Index after a three-year performance period, and (2) 50% is based on our relative TSR compared to a competitor peer group after a three-year performance period. Performance levels are: (1) threshold requires achieving at least 33rd percentile, (2) target requires achieving at least 50th percentile and (3) maximum requires achieving at least 75th percentile. Straight-line interpolation is used to determine awards for results between performance levels. Dividends on the performance-based non-vested shares accrue and are only payable if and to the extent the shares vest.