Pay vs Performance Disclosure - USD ($)
|
12 Months Ended |
Dec. 31, 2025 |
Dec. 31, 2024 |
Dec. 31, 2023 |
Dec. 31, 2022 |
Dec. 31, 2021 |
| Pay vs Performance Disclosure |
|
|
|
|
|
| Pay vs Performance Disclosure, Table |
Below is the tabular disclosure for the Company’s Chief Executive Officer, our Principal Executive Officer (“PEO”), and the average of our NEOs other than the PEO for 2025, 2024, 2023, 2022, and 2021. | | | | | | | | | | | | | | | | | | | | | | | | | | | | (a) | (b) | (c) | (d) | (e) | (f) | (g) | (h) | (i) | | Year | SCT Total Compensation for PEO ($) | Compensation Actually Paid to PEO ($) | Average SCT Total Compensation for Non-PEO NEOs ($) | Average Compensation Actually Paid to Non-PEO NEOs ($) | Value of Initial Fixed $100 Investment Based On: | GAAP Net Income (in Millions) | CSM: Revenue
(in Millions) | | Total Shareholder Return | Peer Group TSR | | 2025 | 6,851,997 | (1,402,441) | | 1,867,067 | 404,894 | | 40 | | 105 | | (170) | | 3,042 | | | 2024 | 6,751,797 | 7,577,477 | 1,818,991 | 1,937,592 | 84 | | 101 | | 426 | | 3,356 | | | 2023 | 6,473,771 | 5,550,137 | 1,486,085 | 1,345,749 | 76 | | 95 | | (296) | | 3,722 | | | 2022 | 5,865,878 | 2,009,495 | 1,560,266 | 871,985 | 84 | | 80 | | (182) | | 3,858 | | | 2021 | 6,078,061 | 6,206,311 | 1,379,302 | 795,496 | 111 | | 96 | | (28) | | 4,140 | |
|
|
|
|
|
| Company Selected Measure Name |
Revenue
|
|
|
|
|
| Named Executive Officers, Footnote |
Reflects the compensation amounts reported in the Summary Compensation Table for our CEO, Mr. Skelton, for each of the respective years shown.
|
|
|
|
|
| Peer Group Issuers, Footnote |
Represents the cumulative TSR of the S&P 1500 Data Processing & Outsourced Services Index, which is an industry line peer group reported in the performance graph included in the Company’s 2025 Annual Report on Form 10-K, for an initial investment of $100 on December 31, 2020 through and including the end of the fiscal year for each row in the table.
|
|
|
|
|
| PEO Total Compensation Amount |
$ 6,851,997
|
$ 6,751,797
|
$ 6,473,771
|
$ 5,865,878
|
$ 6,078,061
|
| PEO Actually Paid Compensation Amount |
$ (1,402,441)
|
7,577,477
|
5,550,137
|
2,009,495
|
6,206,311
|
| Adjustment To PEO Compensation, Footnote |
Reconciliation from SCT Total Compensation to CAP | | | | | | | | | | | | | | | | | | | | | | | | | | | | Year | SCT Total Compensation | Less SCT Equity | Plus (minus) Year End Fair Value of Equity Awards Granted During Fiscal Year that are Outstanding and Unvested at End of the Year | Plus (minus) Year over Year Change in Fair Value of Outstanding Unvested Equity Awards Granted in Prior Years | Plus (minus) Fair Value as of Vesting Date of Equity Awards Granted and Vested in the Year | Plus (minus) Change in Fair Value as of the Vesting Date of Equity Awards Granted in Prior Fiscal Years that Vested in the Fiscal Year | Plus (minus) Fair Value at the End of the Prior Year of Equity Awards that were Forfeited in the Year | Compensation Actually Paid (CAP) | | PEO | | 2025 | 6,851,997 | | (6,001,997) | | 3,084,901 | | (3,160,544) | | 414,814 | | (2,591,612) | | — | | (1,402,441) | | | 2024 | 6,751,797 | | (4,999,997) | | 5,287,215 | | 69,222 | | 720,692 | | 147,980 | | (399,432) | | 7,577,477 | | | 2023 | 6,473,771 | | (4,999,996) | | 3,956,560 | | (446,558) | | 886,782 | | (93,128) | | (227,294) | | 5,550,137 | | | 2022 | 5,865,878 | | (4,249,995) | | 1,896,875 | | (750,008) | | 552,744 | | (1,305,999) | | — | | 2,009,495 | | | 2021 | 6,078,061 | | (3,999,993) | | 2,139,147 | | 512,747 | | 838,551 | | 637,798 | | — | | 6,206,311 | | | Average for non-PEO NEOs | | 2025 | 1,867,067 | | (1,167,804) | | 495,511 | | (449,556) | | 94,419 | | (327,856) | | (106,888) | | 404,894 | | | 2024 | 1,818,991 | | (1,062,496) | | 1,099,927 | | 10,037 | | 117,112 | | 22,223 | | (68,202) | | 1,937,592 | | | 2023 | 1,486,085 | | (859,995) | | 698,403 | | (84,548) | | 152,525 | | (21,859) | | (24,863) | | 1,345,749 | | | 2022 | 1,560,266 | | (849,995) | | 379,375 | | (135,079) | | 110,547 | | (193,129) | | — | | 871,985 | | | 2021 | 1,379,302 | | (631,987) | | 242,190 | | 63,611 | | 80,082 | | 58,662 | | (396,364) | | 795,496 | |
The unvested equity values in the above table are computed in accordance with the methodology used for financial reporting purposes. The fair value of time-based restricted stock units and PRSU—Revenue Hurdle awards used to calculate CAP was based on Conduent’s closing stock price on each valuation date and, for PRSU—Revenue Hurdle awards, assumes estimated performance results as of the end of each reporting year. The fair value of PRSU—Share Hurdle awards used to calculate CAP was based on Conduent’s fair value per share on each valuation date and assumes estimated performance results as of the end of each reporting year. Columns for dividends and pensions are excluded from the above, as they are not provided by Conduent.
|
|
|
|
|
| Non-PEO NEO Average Total Compensation Amount |
$ 1,867,067
|
1,818,991
|
1,486,085
|
1,560,266
|
1,379,302
|
| Non-PEO NEO Average Compensation Actually Paid Amount |
$ 404,894
|
1,937,592
|
1,345,749
|
871,985
|
795,496
|
| Adjustment to Non-PEO NEO Compensation Footnote |
Average CAP to our other NEOs is computed in accordance with SEC rules. The dollar amounts do not reflect the actual amount of compensation earned by or paid during the applicable year. In accordance with SEC rules, a reconciliation from SCT total compensation to CAP for the average of the other NEOs is set forth following the footnotes to this table.
|
|
|
|
|
| Compensation Actually Paid vs. Total Shareholder Return |
Relationship between Company TSR and Peer Group TSR and CAP and Company TSR The graph below illustrates the relationship between our TSR and the current Peer Group TSR, as well as the relationship between CAP and our TSR for our PEO and other NEOs.
|
|
|
|
|
| Compensation Actually Paid vs. Net Income |
Relationship between CAP and GAAP Net Income GAAP Net Income (loss) is not a main factor in determining the CAP for our PEO and average other NEOs, as GAAP Net Income is not a metric used in our annual or long-term incentive plans, and thus there is not a strong relationship between CAP and Net Income.
|
|
|
|
|
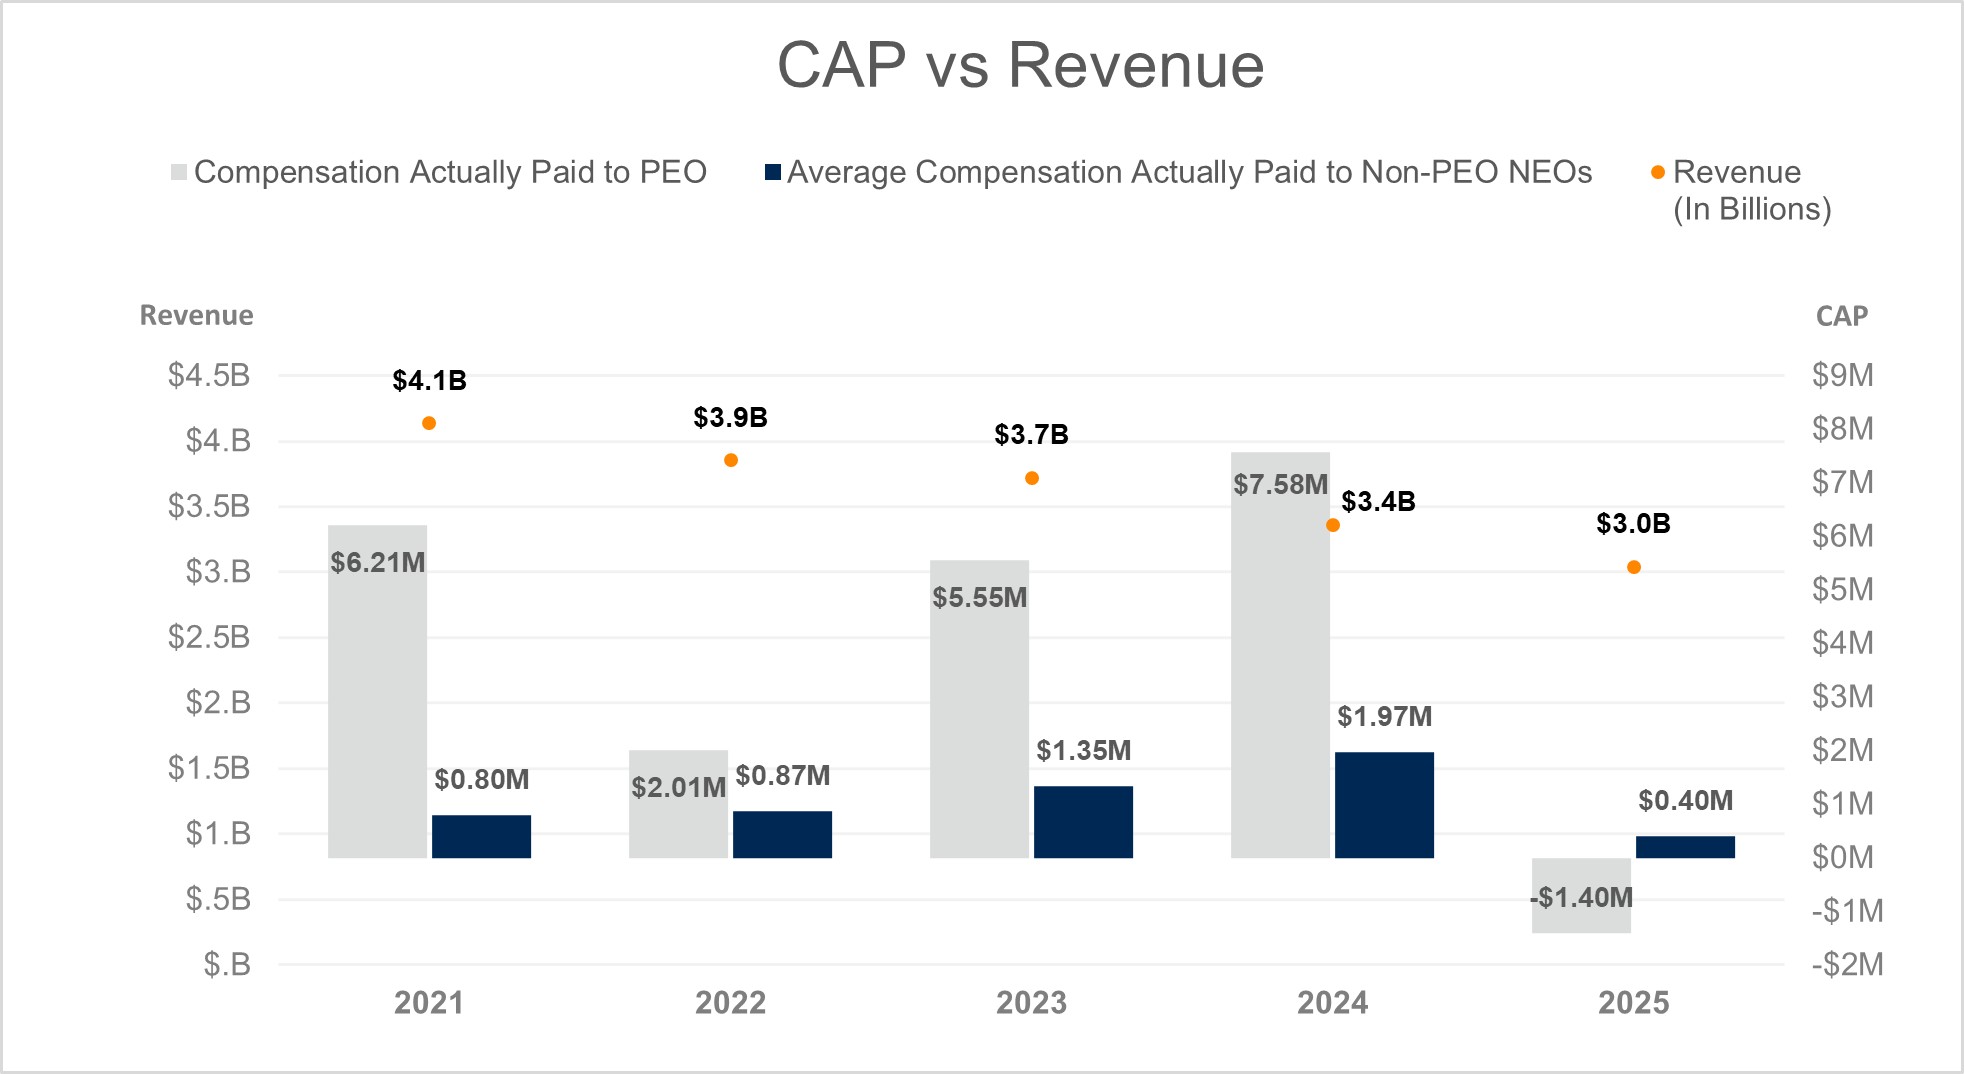
| Compensation Actually Paid vs. Company Selected Measure |
Relationship between Revenue (our Company-Selected Measure) and CAP The graph below reflects the relationship between our PEO and Average Other NEO CAP versus revenue for each fiscal year.
|
|
|
|
|
| Total Shareholder Return Vs Peer Group |
Relationship between Company TSR and Peer Group TSR and CAP and Company TSR The graph below illustrates the relationship between our TSR and the current Peer Group TSR, as well as the relationship between CAP and our TSR for our PEO and other NEOs.
|
|
|
|
|
| Tabular List, Table |
| | | | | | | Performance Measures Linking Pay versus Performance | | Adjusted EBITDA Margin | Relative TSR | | Net ARR Activity | Revenue | | |
|
|
|
|
|
| Total Shareholder Return Amount |
$ 40
|
84
|
76
|
84
|
111
|
| Peer Group Total Shareholder Return Amount |
105
|
101
|
95
|
80
|
96
|
| Net Income (Loss) |
$ (170,000,000)
|
$ 426,000,000
|
$ (296,000,000)
|
$ (182,000,000)
|
$ (28,000,000)
|
| Company Selected Measure Amount |
3,042,000,000
|
3,356,000,000
|
3,722,000,000
|
3,858,000,000
|
4,140,000,000
|
| PEO Name |
Mr. Skelton
|
|
|
|
|
| Additional 402(v) Disclosure |
Performance yearCAP to our CEO is computed in accordance with SEC rules. The dollar amounts do not reflect the actual amount of compensation earned by or paid during the applicable year. In accordance with SEC rules, a reconciliation from SCT total compensation to CAP for Mr. Skelton is set forth following the footnotes to this table.Our other NEOs for 2025, 2024, 2023, 2022, and 2021 are identified as follows: | | | | | | | | | | | | | | | | | | Other NEOs / Year | 2025 | 2024 | 2023 | 2022 | 2021 | Giles Goodburn | x | | | | | | Michael Krawitz | x | x | x | x | x | Adam Appleby | x | | | | | | Mark Prout | x | x | x | x | x | | Stephen Wood | x | x | x | x | x | | Michael McDaniel | x | x | | | | | Randall King | | | x | | | | Mark King | | | x | | | | Louis Keyes | | | | x | x | | Brian Webb-Walsh | | | | | x |
|
|
|
|
|
| Measure:: 1 |
|
|
|
|
|
| Pay vs Performance Disclosure |
|
|
|
|
|
| Name |
Adjusted EBITDA Margin
|
|
|
|
|
| Measure:: 2 |
|
|
|
|
|
| Pay vs Performance Disclosure |
|
|
|
|
|
| Name |
Net ARR Activity
|
|
|
|
|
| Measure:: 4 |
|
|
|
|
|
| Pay vs Performance Disclosure |
|
|
|
|
|
| Name |
Relative TSR
|
|
|
|
|
| Measure:: 5 |
|
|
|
|
|
| Pay vs Performance Disclosure |
|
|
|
|
|
| Name |
Revenue
|
|
|
|
|
| PEO | Equity Awards Reported Value [Member] |
|
|
|
|
|
| Pay vs Performance Disclosure |
|
|
|
|
|
| Adjustment to Compensation, Amount |
$ (6,001,997)
|
$ (4,999,997)
|
$ (4,999,996)
|
$ (4,249,995)
|
$ (3,999,993)
|
| PEO | Equity Awards Granted During the Year, Unvested [Member] |
|
|
|
|
|
| Pay vs Performance Disclosure |
|
|
|
|
|
| Adjustment to Compensation, Amount |
3,084,901
|
5,287,215
|
3,956,560
|
1,896,875
|
2,139,147
|
| PEO | Equity Awards Granted in Prior Years, Unvested [Member] |
|
|
|
|
|
| Pay vs Performance Disclosure |
|
|
|
|
|
| Adjustment to Compensation, Amount |
(3,160,544)
|
69,222
|
(446,558)
|
(750,008)
|
512,747
|
| PEO | Equity Awards Granted During the Year, Vested [Member] |
|
|
|
|
|
| Pay vs Performance Disclosure |
|
|
|
|
|
| Adjustment to Compensation, Amount |
414,814
|
720,692
|
886,782
|
552,744
|
838,551
|
| PEO | Equity Awards Granted in Prior Years, Vested [Member] |
|
|
|
|
|
| Pay vs Performance Disclosure |
|
|
|
|
|
| Adjustment to Compensation, Amount |
(2,591,612)
|
147,980
|
(93,128)
|
(1,305,999)
|
637,798
|
| PEO | Equity Awards that Failed to Meet Vesting Conditions [Member] |
|
|
|
|
|
| Pay vs Performance Disclosure |
|
|
|
|
|
| Adjustment to Compensation, Amount |
0
|
(399,432)
|
(227,294)
|
0
|
0
|
| Non-PEO NEO | Equity Awards Reported Value [Member] |
|
|
|
|
|
| Pay vs Performance Disclosure |
|
|
|
|
|
| Adjustment to Compensation, Amount |
(1,167,804)
|
(1,062,496)
|
(859,995)
|
(849,995)
|
(631,987)
|
| Non-PEO NEO | Equity Awards Granted During the Year, Unvested [Member] |
|
|
|
|
|
| Pay vs Performance Disclosure |
|
|
|
|
|
| Adjustment to Compensation, Amount |
495,511
|
1,099,927
|
698,403
|
379,375
|
242,190
|
| Non-PEO NEO | Equity Awards Granted in Prior Years, Unvested [Member] |
|
|
|
|
|
| Pay vs Performance Disclosure |
|
|
|
|
|
| Adjustment to Compensation, Amount |
(449,556)
|
10,037
|
(84,548)
|
(135,079)
|
63,611
|
| Non-PEO NEO | Equity Awards Granted During the Year, Vested [Member] |
|
|
|
|
|
| Pay vs Performance Disclosure |
|
|
|
|
|
| Adjustment to Compensation, Amount |
94,419
|
117,112
|
152,525
|
110,547
|
80,082
|
| Non-PEO NEO | Equity Awards Granted in Prior Years, Vested [Member] |
|
|
|
|
|
| Pay vs Performance Disclosure |
|
|
|
|
|
| Adjustment to Compensation, Amount |
(327,856)
|
22,223
|
(21,859)
|
(193,129)
|
58,662
|
| Non-PEO NEO | Equity Awards that Failed to Meet Vesting Conditions [Member] |
|
|
|
|
|
| Pay vs Performance Disclosure |
|
|
|
|
|
| Adjustment to Compensation, Amount |
$ (106,888)
|
$ (68,202)
|
$ (24,863)
|
$ 0
|
$ (396,364)
|