Pay vs Performance Disclosure
Dec. 31, 2025
USD ($)
Dec. 31, 2024
USD ($)
Year (a) | Summary Compensation Table Total for PEO(1) (b) | Compensation Actually Paid to PEO(2) (c) | Average Summary Compensation Table Total for Non-PEO Named Executive Officers(1) (d) | Average Compensation Actually Paid to Non-PEO Named Executive Officers(2) (e) | Value of Initial Fixed $100 Investment Based on: | Net Income (h) | Adjusted EBITDA*(4) (i) | |||||||||||||||||||||||||||||||||||||
Total Shareholder Return (f) | Peer Group Total Shareholder Return(3) (g) | |||||||||||||||||||||||||||||||||||||||||||
2025 | $ | 18,020,345 | $ | 119,347,311 | $ | 7,476,480 | $ | 27,840,444 | $ | 468 | $ | 128 | $ | 4,879,123,748 | $ | 3,196,405,462 | ||||||||||||||||||||||||||||
| 2024 | $ | 24,326,338 | $ | 93,739,301 | $ | 8,374,408 | $ | 26,111,218 | $ | 235 | $ | 107 | $1,558,985,542 | $2,035,409,899 | ||||||||||||||||||||||||||||||
2025 | ||||||||
PEO | Average of Non-PEO NEOs* | |||||||
Total Reported in Summary Compensation Table (SCT) | 18,020,345 | 7,476,480 | ||||||
Less, value of stock awards and option awards reported in SCT | (10,706,486) | (4,582,297) | ||||||
Add, year-end fair value of awards granted in the year that were unvested and outstanding at year end | 24,743,818 | 5,174,290 | ||||||
| Add, year-over-year change in fair value of prior year awards that were outstanding and unvested at year end | 87,699,904 | 20,976,290 | ||||||
Add, vesting date fair value of awards granted and vested during the year | ||||||||
Add, change in fair value as of vesting date (from prior year-end) of prior year awards that vested during the year | 511,582 | 1,593,381 | ||||||
Less, fair value at prior year-end of prior year awards that failed to vest during the year - - | — | (2,797,700) | ||||||
Less: aggregate change in actuarial present value included in SCT amounts for the covered fiscal year | (1,054,852) | — | ||||||
Add: service cost for the covered fiscal year | 133,000 | — | ||||||
Add: prior service cost for the covered fiscal year | — | — | ||||||
Total Adjustments | 101,326,966 | 20,363,964 | ||||||
CAP Amounts (as calculated) | 119,347,311 | 27,840,444 | ||||||
* Amounts presented are averages for the entire group of Other NEOs.
Valuation assumptions and methodology used to calculate fair values did not materially differ from those used to calculate fair values at the time of grant as reflected in the SCT Amounts. The Black-Scholes values as of the applicable year-end or vest dates used (a) the closing price as of the revaluation date as the current market price and (b) an adjusted expected life, given applicable time lapsed since grant date.
The following charts show graphically the relationships over the two years of the CAP Amounts for our PEO and Other NEOs as compared to our cumulative total shareholder return (TSR), net income and Adjusted EBITDA*, as well as the relationship between TSR and Peer Group TSR.
We consider our compensation to be generally aligned with both TSR and the performance of Net Income and Adjusted EBITDA*. Secondly, our TSR outperformed the peer groups in 2025, as illustrated in the chart below. As discussed in the CD&A, the majority of each NEO’s compensation is in the form of equity, creating alignment between compensation outcomes and stock price performance. Our focus on equity compensation provides NEOs the opportunity to participate in stock price gains (or losses), which creates shareholder alignment, promotes retention, and encourages long-term stewardship of the Company. In terms of alignment with financial performance, Adjusted EBITDA* appears as a metric in both our AIP and LTI plan, meaning its result has a direct impact on both short- and long-term compensation outcomes. Net Income is similarly impactful, being a key measure of profitability. As illustrated in the charts below, both metrics increased over 2025.
* Non-GAAP financial measure. See Appendix for additional information.
Compensation Actually Paid v. TSR
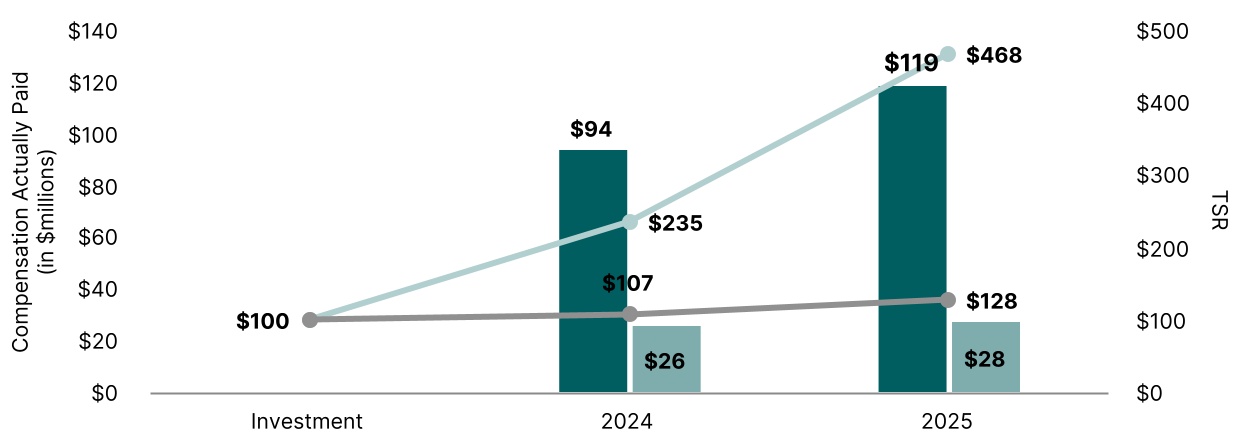
 | Compensation Actually Paid to PEO |  | Compensation Actually Paid to non-PEO NEOs | ||||||||
 | Company TSR |  | Peer Group TSR | ||||||||
Compensation Actually Paid v. Net Income
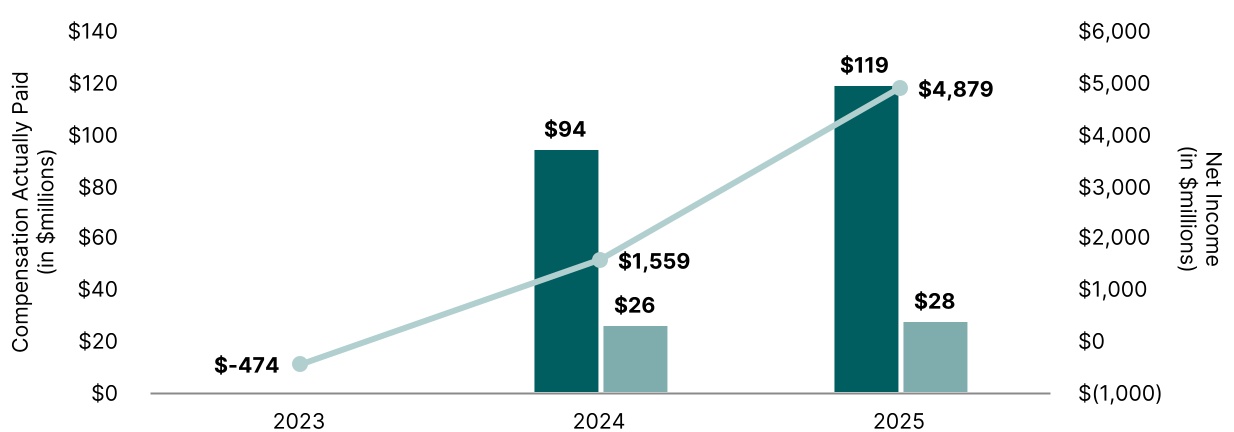
| | Compensation Actually Paid to PEO | | Compensation Actually Paid to non-PEO NEOs | ||||||||
| | Net Income | ||||||||||
Compensation Actually Paid v. Adjusted EBITDA*
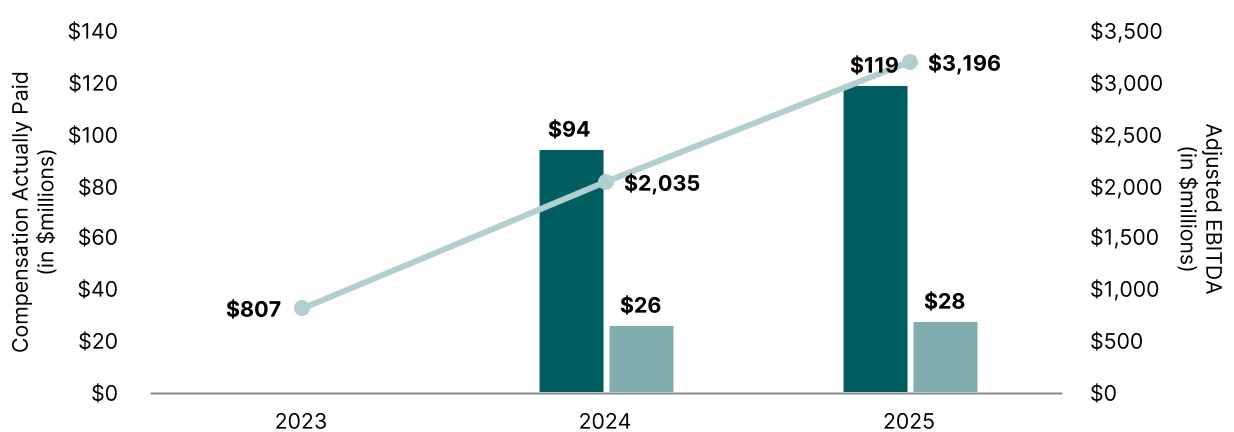
| | Compensation Actually Paid to PEO | | Compensation Actually Paid to non-PEO NEOs | ||||||||
| | Adjusted EBITDA* | ||||||||||
* Non-GAAP financial measure. See Appendix for additional information.
The following table lists the three financial performance measures that, in our assessment, represent the most important performance measures we use to link the CAP Amounts for our named executive officers for 2025 (our most recently completed fiscal year), to Company performance. Of these measures, we have identified Adjusted EBITDA* as the most important of our financial performance measures (that is not already required to be disclosed in the pay versus performance table above) used to link CAP Amounts for our executives for 2025 to Company performance.
Adjusted EBITDA** | ||
Free Cash Flow** | ||
Organic Revenue** Growth | ||
** Non-GAAP financial measure. See Appendix for additional information.