Pay Versus Performance
As required by Section 953(a) of the Dodd-Frank Wall Street Reform and Consumer Protection Act of 2010, and Item 402(v) of Regulation S-K, we are providing the following information regarding the relationship between compensation actually paid (“CAP”) to our principal executive officer (“PEO”) and Non-PEO NEOs and certain financial performance measures of the Company for the fiscal years listed below. The data included in the CAP columns does not reflect the actual amount of compensation earned or paid to our NEOs during the applicable fiscal year and it is reported solely pursuant to SEC rules. The CAP amount also does not represent amounts that have actually been earned or realized, including in respect of PSUs, RSUs and stock options. Performance conditions for many of these equity awards have either not yet been satisfied or applicable performance information is not yet available. To this end, information in the table may not reflect whether compensation actually realized is aligned with performance. The MP&D Committee did not consider the pay versus performance disclosure below in making its pay decisions for any of the years shown.
For additional information about our performance-based pay philosophy and how we align executive compensation with CVS Health’s performance, refer to the CD&A beginning on page 44.
| SCT Total | SCT Total | SCT Total | Compensation Actually |
Compensation Actually |
Compensation Actually |
Average Summary Compensation Table Total |
Average Compensation Actually Paid |
Value of Initial Fixed $100 Investment based on:(5) |
||||||||||||||||
| Year | for
First PEO(1),(2) ($) |
for Second PEO(1),(2) ($) |
for Third PEO(1),(2) ($) |
Paid to First PEO(1),(2),(3),(4) ($) |
Paid to Second PEO(1),(2),(3) ($) |
Paid to Third PEO(1),(2),(3) ($) |
for Non-PEO NEOs(1),(2) ($) |
to Non-PEO NEOs(1),(2),(3),(4) ($) |
TSR ($) |
Peer Group TSR ($) |
Net Income ($ Millions) |
Adj. EPS ($)(6) | ||||||||||||
| (a) | (b) | (b) | (b) | (c) | (c) | (c) | (d) | (e) | (f) | (g) | (h) | (i) | ||||||||||||
| 2025 | 21,214,084 | — | — | 50,482,415 | — | — | 10,415,936 | 17,306,803 | 136.61 | 148.36 | 1,728 | 6.75 | ||||||||||||
| 2024 | 17,808,792 | 23,431,466 | — | 4,812,998 | (15,063,925) | — | 9,780,578 | 491,313 | 74.14 | 129.46 | 4,586 | 5.42 | ||||||||||||
| 2023 | — | 21,615,034 | — | — | 7,497,241 | — | 9,284,957 | 7,685,990 | 125.14 | 126.21 | 8,368 | 8.74 | ||||||||||||
| 2022 | — | 21,317,055 | — | — | 23,768,152 | — | 12,155,385 | 11,816,298 | 143.08 | 123.67 | 4,327 | 9.03 | ||||||||||||
| 2021 | — | 20,388,412 | 3,784,072 | — | 66,324,077 | 52,818,429 | 11,876,865 | 38,197,569 | 154.87 | 126.13 | 7,989 | 8.34 | ||||||||||||
| (1) | First PEO refers to J. David Joyner, our current PEO, who became our PEO on October 17, 2024. Second PEO refers to Karen S. Lynch who was our PEO during the period from February 1, 2021 to October 17, 2024. Third PEO refers to Larry J. Merlo who was our PEO during the relevant period from January 1, 2021 to January 31, 2021. The individuals comprising the Non-PEO NEOs for each year presented are listed below. |
| 2025 | 2024 | 2023 | 2022 | 2021 | |
| Thomas F. Cowhey | Thomas F. Cowhey | Thomas F. Cowhey | Shawn M. Guertin | Shawn M. Guertin | |
| Tilak Mandadi | Heidi B. Capozzi | Samrat S. Khichi | Alan M. Lotvin | Troyen A. Brennan | |
| Steven Nelson | Tilak Mandadi | Tilak Mandadi | Tilak Mandadi | Alan M. Lotvin | |
| Brian Newman | Prem S. Shah | Prem S. Shah | Prem S. Shah | Jonathan C. Roberts | |
| Prem S. Shah | Shawn M. Guertin | Eva C. Boratto |
| (2) | The amounts reported in each of the columns (b) are the amounts of total compensation reported for the PEOs for each corresponding year in the “Total” column of the SCT. The amounts reported in column (d) represent the average of the amounts of total compensation reported for our non-PEO NEOs, as a group, for each corresponding year in the “Total” column of the SCT. |
| (3) | The amounts shown for Compensation Actually Paid have been calculated in accordance with Item 402(v) of Regulation S-K and do not reflect compensation actually earned, realized, or received by the Company’s NEOs. These amounts reflect the “Total” column of the SCT for the applicable year with certain adjustments per Item 402(v) of Regulation S-K, which are set forth below. |
| (4) | CAP reflects the exclusions and inclusions of certain amounts for the PEOs and the Non-PEO NEOs as set forth below. Equity values are calculated in accordance with FASB ASC Topic 718. Amounts in the “Exclusion of Stock Awards and Option Awards” column are the totals from the “Stock Awards” and “Option Awards” columns set forth in the SCT. Amounts in the “Exclusion of Change in Pension Value” column reflect the amounts attributable to the change in pension value reported in the SCT. Because the Aetna Pension Plan is frozen, there is no adjustment for the service cost for services rendered during the listed year. |
| Year | Summary Compensation Table Total for First PEO ($) |
Exclusion of Change in Pension Value for First PEO ($) |
Exclusion of Stock Awards and Option Awards for First PEO ($) |
Inclusion of Pension Service Cost for First PEO ($) |
Inclusion of Equity Values for First PEO ($) |
Compensation Actually Paid to First PEO ($) | |||||||
| 2025 | 21,214,084 | (64,644) | (14,499,931) | — | 43,832,906 | 50,482,415 |
| Year | Average Summary Compensation Table Total for Non-PEO NEOs ($) |
Average Exclusion of Change in Pension Value for Non-PEO NEOs ($) |
Average Exclusion of Stock Awards and Option Awards for Non-PEO NEOs ($) |
Average Inclusion of Pension Service Cost for Non-PEO NEOs ($) |
Average Inclusion of Equity Values for Non-PEO NEOs ($) |
Average Compensation Actually Paid to Non-PEO NEOs ($) | |||||||
| 2025 | 10,415,936 | (619) | (7,149,939) | — | 14,041,425 | 17,306,803 |
The amounts in the Inclusion of Equity Values columns in the tables above are derived from the amounts set forth in the following tables:
| Year | Year-End Fair Value of Equity Awards Granted During Year That Remained Unvested as of Last Day of Year for First PEO ($) |
Change in Fair Value from Last Day of Prior Year to Last Day of Year of Unvested Equity Awards for First PEO ($) |
Vesting-Date Fair Value of Equity Awards Granted During Year that Vested During Year for First PEO ($) |
Change in Fair Value from Last Day of Prior Year to Vesting Date of Unvested Equity Awards that Vested During Year for First PEO ($) |
Fair Value at Last Day of Prior Year of Equity Awards Forfeited During Year for First PEO ($) |
Value of Dividends or Other Earnings Paid on Equity Awards Not Otherwise Included for First PEO ($) |
Total - Inclusion of Equity Values for First PEO ($) | ||||||||
| 2025 | 17,220,917 | 18,396,189 | — | 8,215,800 | — | — | 43,832,906 |
| Year | Average Year-End Fair Value of Equity Awards Granted During Year That Remained Unvested as of Last Day of Year for Non-PEO NEOs ($) |
Average Change in Fair Value from Last Day of Prior Year to Last Day of Year of Unvested Equity Awards for Non-PEO NEOs ($) |
Average Vesting- Date Fair Value of Equity Awards Granted During Year that Vested During Year for Non-PEO NEOs ($) |
Average Change in Fair Value from Last Day of Prior Year to Vesting Date of Unvested Equity Awards that Vested During Year for Non-PEO NEOs ($) |
Average Fair Value at Last Day of Prior Year of Equity Awards Forfeited During Year for Non-PEO NEOs ($) |
Average Value of Dividends or Other Earnings Paid on Equity Awards Not Otherwise Included for Non- PEO NEOs ($) |
Total - Average Inclusion of Equity Values for Non-PEO NEOs ($) | ||||||||
| 2025 | 7,802,005 | 4,416,372 | — | 1,823,048 | — | — | 14,041,425 |
| (5) | The Peer Group TSR set forth in this table utilizes the S&P 500 Health Care Sector Index, which we also utilize in the stock performance graph required by Item 201(e) of Regulation S-K included in our Annual Report for the year ended December 31, 2025. The comparison assumes $100 was invested for the period starting December 31, 2020, through the end of the listed year in the Company and in the S&P 500 Health Care Sector Index, respectively. Historical stock performance is not necessarily indicative of future stock performance. |
| (6) | The Company has determined that Adjusted EPS is the financial performance measure that, in the Company’s assessment, represents the most important performance measure (that is not otherwise required to be disclosed in the table) used by the Company to link CAP to the Company’s NEOs, for the most recently completed fiscal year, to Company performance. Adjusted EPS is a non-GAAP financial measure. See Annex A to this proxy statement for an explanation and a reconciliation to the most comparable GAAP financial measure. |
| (1) | First PEO refers to J. David Joyner, our current PEO, who became our PEO on October 17, 2024. Second PEO refers to Karen S. Lynch who was our PEO during the period from February 1, 2021 to October 17, 2024. Third PEO refers to Larry J. Merlo who was our PEO during the relevant period from January 1, 2021 to January 31, 2021. The individuals comprising the Non-PEO NEOs for each year presented are listed below. |
| 2025 | 2024 | 2023 | 2022 | 2021 | |
| Thomas F. Cowhey | Thomas F. Cowhey | Thomas F. Cowhey | Shawn M. Guertin | Shawn M. Guertin | |
| Tilak Mandadi | Heidi B. Capozzi | Samrat S. Khichi | Alan M. Lotvin | Troyen A. Brennan | |
| Steven Nelson | Tilak Mandadi | Tilak Mandadi | Tilak Mandadi | Alan M. Lotvin | |
| Brian Newman | Prem S. Shah | Prem S. Shah | Prem S. Shah | Jonathan C. Roberts | |
| Prem S. Shah | Shawn M. Guertin | Eva C. Boratto |
| Year | Summary Compensation Table Total for First PEO ($) |
Exclusion of Change in Pension Value for First PEO ($) |
Exclusion of Stock Awards and Option Awards for First PEO ($) |
Inclusion of Pension Service Cost for First PEO ($) |
Inclusion of Equity Values for First PEO ($) |
Compensation Actually Paid to First PEO ($) | |||||||
| 2025 | 21,214,084 | (64,644) | (14,499,931) | — | 43,832,906 | 50,482,415 |
| Year | Year-End Fair Value of Equity Awards Granted During Year That Remained Unvested as of Last Day of Year for First PEO ($) |
Change in Fair Value from Last Day of Prior Year to Last Day of Year of Unvested Equity Awards for First PEO ($) |
Vesting-Date Fair Value of Equity Awards Granted During Year that Vested During Year for First PEO ($) |
Change in Fair Value from Last Day of Prior Year to Vesting Date of Unvested Equity Awards that Vested During Year for First PEO ($) |
Fair Value at Last Day of Prior Year of Equity Awards Forfeited During Year for First PEO ($) |
Value of Dividends or Other Earnings Paid on Equity Awards Not Otherwise Included for First PEO ($) |
Total - Inclusion of Equity Values for First PEO ($) | ||||||||
| 2025 | 17,220,917 | 18,396,189 | — | 8,215,800 | — | — | 43,832,906 |
| Year | Average Summary Compensation Table Total for Non-PEO NEOs ($) |
Average Exclusion of Change in Pension Value for Non-PEO NEOs ($) |
Average Exclusion of Stock Awards and Option Awards for Non-PEO NEOs ($) |
Average Inclusion of Pension Service Cost for Non-PEO NEOs ($) |
Average Inclusion of Equity Values for Non-PEO NEOs ($) |
Average Compensation Actually Paid to Non-PEO NEOs ($) | |||||||
| 2025 | 10,415,936 | (619) | (7,149,939) | — | 14,041,425 | 17,306,803 |
| Year | Average Year-End Fair Value of Equity Awards Granted During Year That Remained Unvested as of Last Day of Year for Non-PEO NEOs ($) |
Average Change in Fair Value from Last Day of Prior Year to Last Day of Year of Unvested Equity Awards for Non-PEO NEOs ($) |
Average Vesting- Date Fair Value of Equity Awards Granted During Year that Vested During Year for Non-PEO NEOs ($) |
Average Change in Fair Value from Last Day of Prior Year to Vesting Date of Unvested Equity Awards that Vested During Year for Non-PEO NEOs ($) |
Average Fair Value at Last Day of Prior Year of Equity Awards Forfeited During Year for Non-PEO NEOs ($) |
Average Value of Dividends or Other Earnings Paid on Equity Awards Not Otherwise Included for Non- PEO NEOs ($) |
Total - Average Inclusion of Equity Values for Non-PEO NEOs ($) | ||||||||
| 2025 | 7,802,005 | 4,416,372 | — | 1,823,048 | — | — | 14,041,425 |
| 1. | CAP versus Company TSR and Peer Group TSR |
The graph below reflects the relationship between the CAP to the PEOs and Non-PEO NEOs, Company TSR and Peer Group TSR for the applicable reporting year.
PEOs and Average Non-PEO NEO CAP
Versus CVS Health Corporation TSR and Peer Group TSR
![]()
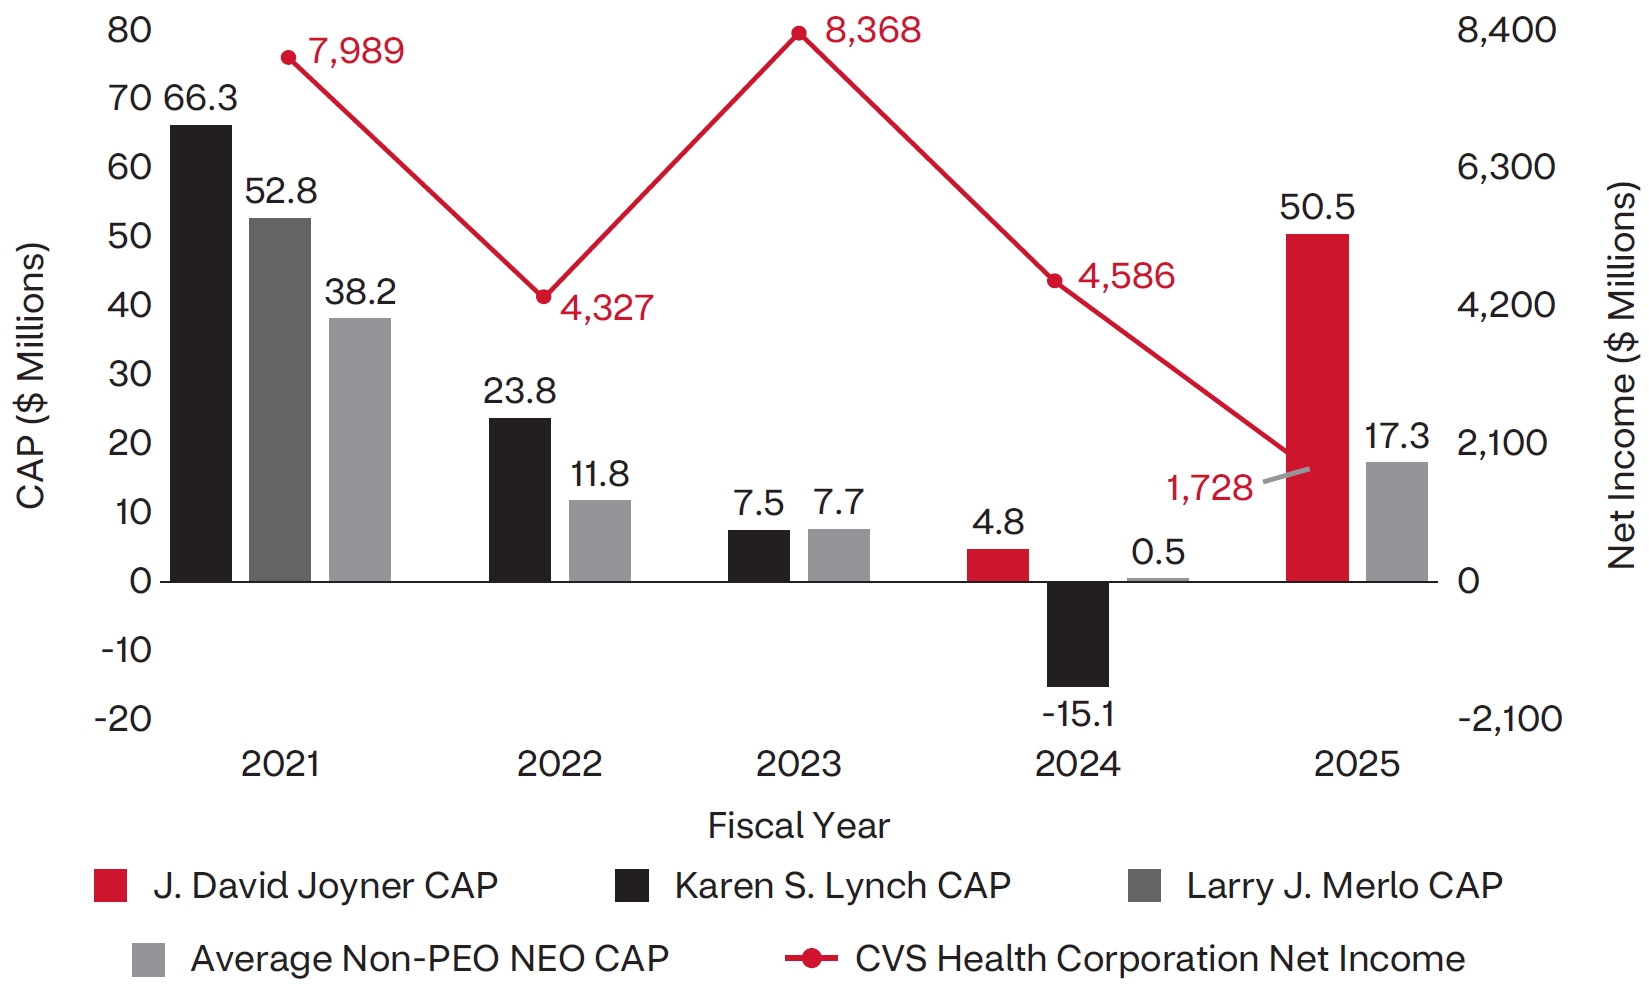
| 2. | CAP versus Net Income |
The graph below reflects the relationship between the CAP to the PEOs and Non-PEO NEOs and the Company’s GAAP Net Income for the applicable reporting year.
PEOs and Average Non-PEO NEO CAP
Versus Net Income
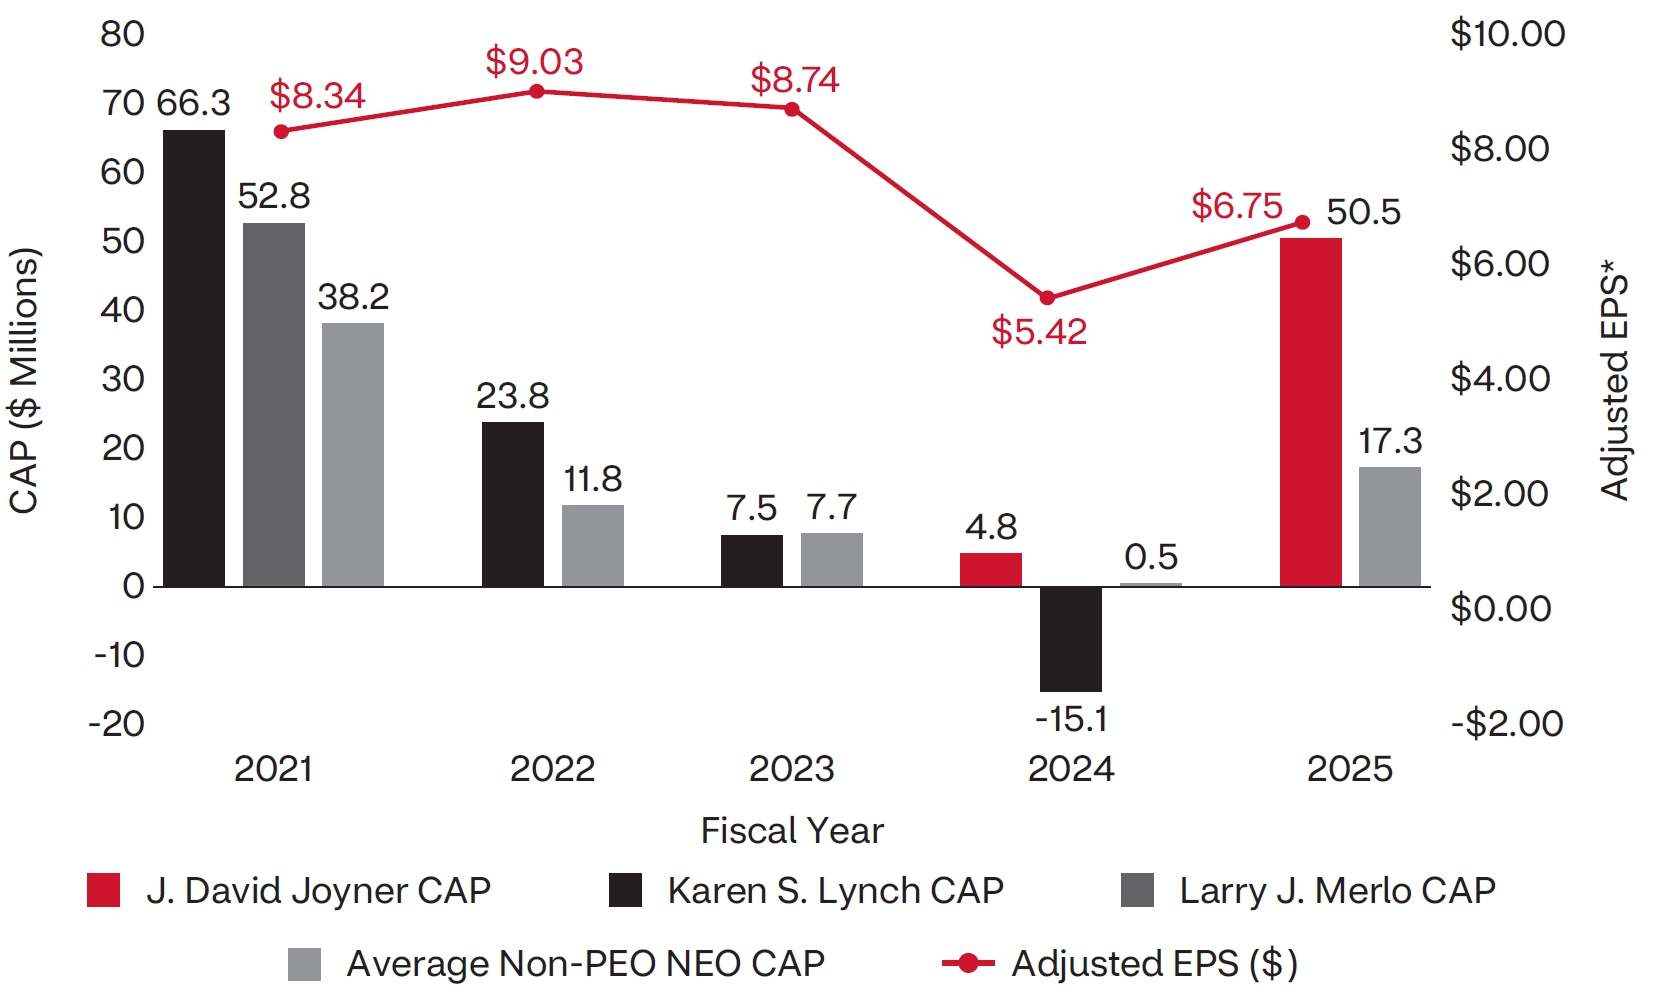
| 3. | CAP versus Adjusted EPS* |
The graph below reflects the relationship between the CAP to the PEOs and Non-PEO NEOs and Adjusted EPS* for the applicable reporting year.
PEOs and Average Non-PEO NEO CAP
Versus Adjusted EPS*
| 1. | CAP versus Company TSR and Peer Group TSR |
The graph below reflects the relationship between the CAP to the PEOs and Non-PEO NEOs, Company TSR and Peer Group TSR for the applicable reporting year.
PEOs and Average Non-PEO NEO CAP
Versus CVS Health Corporation TSR and Peer Group TSR
![]()
Most Important Measures to Determine FY2025 CAP
The Company’s executive compensation program supports our long-term strategy by tying the vast majority of pay for executives to performance-based compensation.
The three items listed below represent an unranked list of the most important performance metrics used by the Company for linking executive compensation actually paid to the NEOs for 2025 and Company performance, as further described in our CD&A within the sections titled “Elements of Our Executive Compensation Program,” “Long-Term Incentive Compensation” and “2025 Business and Performance Results.”
|
Adjusted Earnings Per Share*
Adjusted Operating Income*
TSR |
| * | Adjusted EPS and Adjusted Operating Income are non-GAAP financial measures. See Annex A to this proxy statement for an explanation and a reconciliation to the most comparable GAAP financial measures. |
| [1] | First PEO refers to J. David Joyner, our current PEO, who became our PEO on October 17, 2024. Second PEO refers to Karen S. Lynch who was our PEO during the period from February 1, 2021 to October 17, 2024. Third PEO refers to Larry J. Merlo who was our PEO during the relevant period from January 1, 2021 to January 31, 2021. The individuals comprising the Non-PEO NEOs for each year presented are listed below. |
| [2] | The amounts reported in each of the columns (b) are the amounts of total compensation reported for the PEOs for each corresponding year in the “Total” column of the SCT. The amounts reported in column (d) represent the average of the amounts of total compensation reported for our non-PEO NEOs, as a group, for each corresponding year in the “Total” column of the SCT. |
| [3] | CAP reflects the exclusions and inclusions of certain amounts for the PEOs and the Non-PEO NEOs as set forth below. Equity values are calculated in accordance with FASB ASC Topic 718. Amounts in the “Exclusion of Stock Awards and Option Awards” column are the totals from the “Stock Awards” and “Option Awards” columns set forth in the SCT. Amounts in the “Exclusion of Change in Pension Value” column reflect the amounts attributable to the change in pension value reported in the SCT. Because the Aetna Pension Plan is frozen, there is no adjustment for the service cost for services rendered during the listed year. |
| [4] | The amounts shown for Compensation Actually Paid have been calculated in accordance with Item 402(v) of Regulation S-K and do not reflect compensation actually earned, realized, or received by the Company’s NEOs. These amounts reflect the “Total” column of the SCT for the applicable year with certain adjustments per Item 402(v) of Regulation S-K, which are set forth below. |
| [5] | The Peer Group TSR set forth in this table utilizes the S&P 500 Health Care Sector Index, which we also utilize in the stock performance graph required by Item 201(e) of Regulation S-K included in our Annual Report for the year ended December 31, 2025. The comparison assumes $100 was invested for the period starting December 31, 2020, through the end of the listed year in the Company and in the S&P 500 Health Care Sector Index, respectively. Historical stock performance is not necessarily indicative of future stock performance. |
| [6] | The Company has determined that Adjusted EPS is the financial performance measure that, in the Company’s assessment, represents the most important performance measure (that is not otherwise required to be disclosed in the table) used by the Company to link CAP to the Company’s NEOs, for the most recently completed fiscal year, to Company performance. Adjusted EPS is a non-GAAP financial measure. See Annex A to this proxy statement for an explanation and a reconciliation to the most comparable GAAP financial measure. |
| [7] | Adjusted EPS and Adjusted Operating Income are non-GAAP financial measures. See Annex A to this proxy statement for an explanation and a reconciliation to the most comparable GAAP financial measures. |