Pay Versus Performance
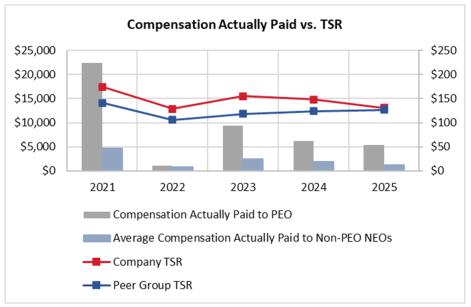
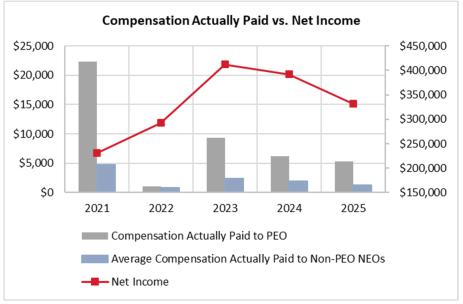
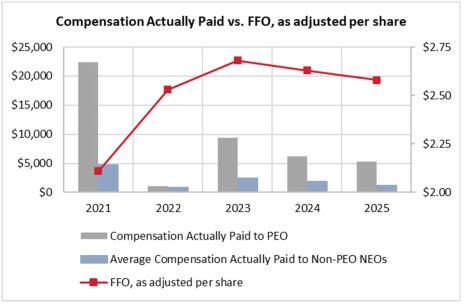
Our Chief Executive Officer is our principal executive officer ("PEO"). The following table details, for our PEO and our other NEOs (“Non-PEO NEOs”) (on an average basis), total compensation as set forth in the Summary Compensation Table, "compensation actually paid" as determined under SEC rules, cumulative Total Shareholder Return ("TSR"), the cumulative TSR of our peer group, net income, and funds from operations ("FFO") per share, as adjusted, which we view as the most important financial performance measure that we use to link compensation to performance.
| Summary | Average Summary Compensation | Average Compensation | Value of Initial Fixed $100 Investment Based on: | |||||
| Year | Compensation Table Total for PEO (1) | Compensation Actually Paid to PEO (1) (2) | Table Total for Non-PEO NEOs (3) | Actually Paid to Non-PEO NEOs (2) (3) | Company TSR (4) | Peer Group TSR (4) | Net Income (in thousands) | FFO per share, as adjusted (5) |
| 2025 | $ 9,177,452 | $ 5,297,246 | $ 2,157,572 | $ 1,232,559 | $ 130.85 | $ 126.71 | $ 331,317 | $ 2.58 |
| 2024 | $ 8,001,409 | $ 6,216,181 | $ 2,284,674 | $ 1,925,248 | $ 148.00 | $ 123.90 | $ 391,885 | $ 2.63 |
| 2023 | $ 6,719,684 | $ 9,345,910 | $ 1,923,505 | $ 2,397,883 | $ 155.02 | $ 118.09 | $ 412,435 | $ 2.68 |
| 2022 | $ 7,288,676 | $ 1,052,755 | $ 2,117,791 | $ 978,870 | $ 128.65 | $ 106.05 | $ 292,472 | $ 2.53 |
| 2021 | $ 7,317,658 | $ 22,342,427 | $ 1,996,166 | $ 4,704,567 | $ 174.59 | $ 141.30 | $ 230,813 | $ 2.11 |
| (1) | Mr. Marr was our PEO for each of 2021, 2022, 2023, 2024 and 2025. |
| (2) | Amounts represent "compensation actually paid" for the relevant fiscal year, as determined under SEC rules and calculated per the adjustments detailed below. Our NEOs do not participate in a defined benefit plan. Dividends on unvested awards are included within "All Other Compensation" in the Summary Compensation Table. Therefore, no adjustments for pension benefits or dividends paid are included in the table below. The following table details the adjustments made to calculate "compensation actually paid": |
| Year | NEO Type | Summary
Compensation
Table Total | Subtract Equity
Awards |
Add Year-End
Fair Value of
Current Year Equity
Awards (a) | Change in Value
of Prior
Equity Awards (a) | Change in Value of
Equity Awards that
Vested in Current
Year (a) | Prior Equity
Awards Forfeited
(a) | Total
Compensation
Actually Paid |
| 2025 | PEO | $ 9,177,452 | ($ 5,519,962) | $ 3,836,410 | ($ 2,196,654) | $ 5,297,246 | ||
| Non-PEO | $ 2,157,572 | ($ 831,252) | $ 577,727 | ($ 330,186) | ($ 341,302) | $ 1,232,559 |
| (a) | For equity awards issued during the relevant year, represents the fair value of such awards as of the end of the year. For equity awards issued in prior years, represents the change in fair value of such awards as of the vesting date or the end of the year, as appropriate, compared to the fair value of such awards at the end of the prior year. For prior equity awards forfeited during the year, the amount represents the fair value of the forfeited award at the end of the prior fiscal year. The fair value of the restricted share awards was determined by the closing price of our common shares as of the end of each year. The fair values of option and performance unit awards were calculated using Black-Scholes and Monte Carlo values, respectively, as of the relevant dates, except in the case of the final results of the performance units, which were valued as the closing price of our common shares as of the end of the performance period multiplied by the final multiplier derived from the relative TSR results. |
| (3) | Messrs. Martin, Keaton and Foster were Non-PEO NEOs for each of 2021, 2022, 2023, 2024 and 2025. Additionally, Ms. Schulte was a Non-PEO NEO in 2023, 2024 and 2025. |
| (4) | TSR is determined based on an initial fixed investment of $100 on December 31, 2020, assuming dividend reinvestment. The TSR peer group consists of the FTSE NAREIT All Equity REIT Index, which is the peer group used for purposes of Item 201(e) of Regulation S-K under the Exchange Act in our Annual Report on Form 10-K for the year ended December 31, 2025. |
| (5) | FFO as adjusted, per share is a non-GAAP financial measure. See Appendix A to this proxy statement for a reconciliation of FFO, as adjusted, to net income attributable to common shareholders. |
| (1) | Mr. Marr was our PEO for each of 2021, 2022, 2023, 2024 and 2025. |
| (3) | Messrs. Martin, Keaton and Foster were Non-PEO NEOs for each of 2021, 2022, 2023, 2024 and 2025. Additionally, Ms. Schulte was a Non-PEO NEO in 2023, 2024 and 2025. |
| (4) | TSR is determined based on an initial fixed investment of $100 on December 31, 2020, assuming dividend reinvestment. The TSR peer group consists of the FTSE NAREIT All Equity REIT Index, which is the peer group used for purposes of Item 201(e) of Regulation S-K under the Exchange Act in our Annual Report on Form 10-K for the year ended December 31, 2025. |
| (2) | Amounts represent "compensation actually paid" for the relevant fiscal year, as determined under SEC rules and calculated per the adjustments detailed below. Our NEOs do not participate in a defined benefit plan. Dividends on unvested awards are included within "All Other Compensation" in the Summary Compensation Table. Therefore, no adjustments for pension benefits or dividends paid are included in the table below. The following table details the adjustments made to calculate "compensation actually paid": |
| Year | NEO Type | Summary
Compensation
Table Total | Subtract Equity
Awards |
Add Year-End
Fair Value of
Current Year Equity
Awards (a) | Change in Value
of Prior
Equity Awards (a) | Change in Value of
Equity Awards that
Vested in Current
Year (a) | Prior Equity
Awards Forfeited
(a) | Total
Compensation
Actually Paid |
| 2025 | PEO | $ 9,177,452 | ($ 5,519,962) | $ 3,836,410 | ($ 2,196,654) | $ 5,297,246 | ||
| Non-PEO | $ 2,157,572 | ($ 831,252) | $ 577,727 | ($ 330,186) | ($ 341,302) | $ 1,232,559 |
| (a) | For equity awards issued during the relevant year, represents the fair value of such awards as of the end of the year. For equity awards issued in prior years, represents the change in fair value of such awards as of the vesting date or the end of the year, as appropriate, compared to the fair value of such awards at the end of the prior year. For prior equity awards forfeited during the year, the amount represents the fair value of the forfeited award at the end of the prior fiscal year. The fair value of the restricted share awards was determined by the closing price of our common shares as of the end of each year. The fair values of option and performance unit awards were calculated using Black-Scholes and Monte Carlo values, respectively, as of the relevant dates, except in the case of the final results of the performance units, which were valued as the closing price of our common shares as of the end of the performance period multiplied by the final multiplier derived from the relative TSR results. |
Financial Performance Measures
The following are the most important financial performance measures that were used to link NEO “compensation actually paid” to company performance in 2025:
| Most Important Financial Performance Measures |
| FFO, as adjusted per share (1) |
| Same-store NOI growth (1) |
| TSR relative to TSR of our peer group |
| (1) | See Appendix A to this proxy statement for a discussion of non-GAAP financial measures and reconciliations to the most directly comparable GAAP financial measures. |
| (5) | FFO as adjusted, per share is a non-GAAP financial measure. See Appendix A to this proxy statement for a reconciliation of FFO, as adjusted, to net income attributable to common shareholders. |