Pay vs Performance Disclosure
Dec. 31, 2021
Aug. 31, 2021
Dec. 31, 2025
USD ($)
$ / shares
Dec. 31, 2024
USD ($)
$ / shares
Dec. 31, 2023
USD ($)
$ / shares
Dec. 31, 2022
USD ($)
$ / shares
Dec. 31, 2021
USD ($)
$ / shares
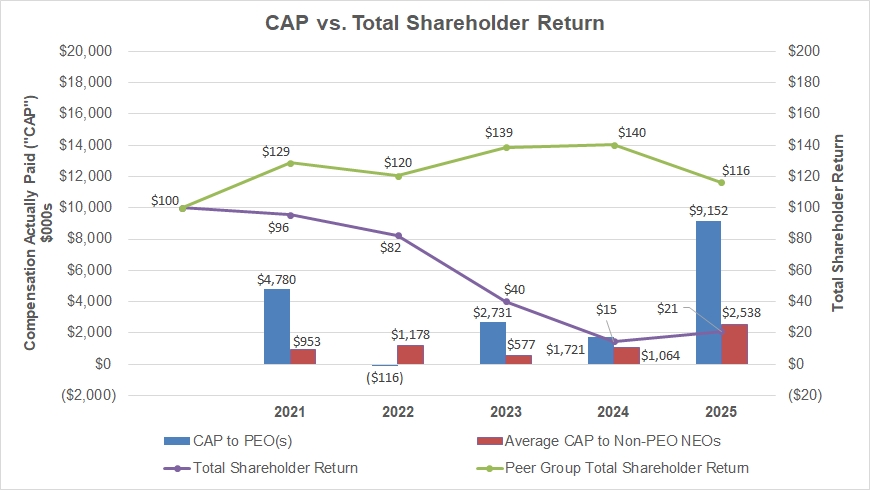
Pay Versus Performance
As required by the Dodd-Frank Wall Street Reform and Consumer Protection Act and Item 402(v) of Regulation S-K, we are providing information about
the compensation of our Principal Executive Officers (“PEOs”) and other NEOs, as disclosed in the Summary Compensation Table (“SCT”) and also their “compensation actually paid.” The dollar amounts reported as “compensation actually paid” were
computed in accordance with applicable SEC rules and do not necessarily reflect the actual amount of compensation earned by or paid to the NEOs during the applicable year.
|
Comp.
Actually
Paid to
Second
PEO ($)(2)
|
Average
SCT Total
for Non-
PEO
Named
Executive
Officers ($)
|
Average
Comp.
Actually
Paid to
Non-PEO
Named
Executive
Officers
($)(2)
|
Value of Initial Fixed
$100 Investment Based
On:
|
||||||||
|
Year (1)
|
SCT Total
for First
PEO ($)
|
Comp.
Actually
Paid to First PEO ($)(2)
|
SCT Total
for Second PEO ($)
|
Total
Shareholder
Return ($)(3)
|
Peer Group
Total
Shareholder
Return ($)(3)
|
Net Income
(Loss)
($000s)
|
Adjusted
EPS
($)(4)
|
||||
|
2025
|
N/A
|
N/A
|
5,965,206
|
9,151,861
|
1,754,606
|
2,538,087
|
20.95
|
116.43
|
160,204
|
1.27
|
|
|
2024
|
N/A
|
N/A
|
5,993,088
|
1,721,069
|
2,137,313
|
1,064,386
|
14.63
|
140.20
|
(146,594)
|
0.84
|
|
|
2023
|
N/A
|
N/A
|
5,838,579
|
2,731,348
|
1,750,510
|
577,117
|
40.27
|
138.51
|
8,595
|
2.06
|
|
|
2022
|
N/A
|
N/A
|
4,764,466
|
(116,058)
|
2,388,206
|
1,177,614
|
82.33
|
120.46
|
104,778
|
2.90
|
|
|
2021
|
2,657,102
|
1,103,513
|
4,731,970
|
3,676,080
|
1,501,890
|
953,242
|
95.67
|
128.79
|
147,266
|
4.14
|
|
| (1) |
NEOs included in the above table for each year are the following:
|
|
Year
|
First PEO
|
Second PEO
|
Non-PEOs
|
|
2025
|
N/A
|
Ryan S. Napierski
|
James D. Thomas, Chayce D. Clark, Steven K. Hatchett, Justin S. Keisel
|
|
2024
|
N/A
|
Ryan S. Napierski
|
James D. Thomas, Chayce D. Clark, Steven K. Hatchett, Justin S. Keisel
|
|
2023
|
N/A
|
Ryan S. Napierski
|
James D. Thomas, Chayce D. Clark, Steven K. Hatchett, Connie Tang, Mark H. Lawrence, Joseph Y. Chang
|
|
2022
|
N/A
|
Ryan S. Napierski
|
Mark H. Lawrence, Connie Tang, Joseph Y. Chang, Chayce D. Clark
|
|
2021
|
Ritch N. Wood
|
Ryan S. Napierski
|
Mark H. Lawrence, Connie Tang, Joseph Y. Chang, Chayce D. Clark, D. Matthew Dorny, Jeffrey C. Bettinger
|
| (2) |
Adjustments made to calculate 2025 “compensation actually paid” pursuant to SEC rules are as follows:
|
|
PEO ($)
|
Average of
Other NEOs ($)
|
||
|
Total Compensation in SCT
|
5,965,206
|
1,754,606
|
|
|
Less: Grant date value of stock awards and option awards reported in SCT
|
(4,616,823)
|
(1,118,146)
|
|
|
Plus: Year-end value of awards granted during the year that are outstanding and unvested as of year-end
|
7,109,675
|
1,721,893
|
|
|
Plus (less): Change in value, from prior year-end to year-end, of awards granted in a prior year that are outstanding and
unvested as of year-end
|
618,438
|
143,264
|
|
|
Plus (less): Change in value, from prior year-end to vesting date, of awards granted in a prior year that vested during the
year
|
75,365
|
36,470
|
|
|
Total Adjustments
|
3,186,655
|
783,481
|
|
|
Compensation Actually Paid
|
9,151,861
|
2,538,087
|
Fair value amounts were calculated in a manner consistent with the fair value methodology used to account for share-based
payments in our financial statements under U.S. GAAP. The fair value amounts were calculated using our stock price on the last day of each fiscal year or the date of vesting, as applicable, and assuming the probable level of achievement for
performance-based awards as of the end of the covered fiscal year. For information on the assumptions used in calculating these amounts, refer to Notes 2 and 10 to the financial statements in our Annual Report on Form 10-K filed for the
fiscal year ended December 31, 2025.
| (3) |
Calculated in the manner prescribed by SEC rules. Indicates the value, as of December 31 of each year, of an assumed $100 initial investment that is invested on
December 31, 2020 in our company’s common stock and the S&P SmallCap 600 Consumer Staples Index, the same index that was used in the Stock Performance Graph in our Annual Report on Form 10-K filed for the fiscal year ended
December 31, 2025.
|
| (4) |
We believe Adjusted EPS is the most important
financial performance measure that is used to link the “compensation actually paid” to our NEOs in 2025 to our performance. On average, equity awards constitute the largest component of our NEOs’ 2025 target compensation, and Adjusted
EPS is the metric used for our performance-based equity awards. Adjusted EPS is measured as diluted EPS excluding extraneous items such as the impact of accounting changes; losses or gains on settlements of litigation that began prior
to the beginning of the respective year; and other items that are non-recurring, unusual, infrequent or outside of management’s control. For further information about the calculation of Adjusted EPS, see “Executive Compensation:
Compensation Discussion and Analysis”—“Performance-Based Awards Granted in 2023–2025—Goals and Vesting.”
|
| (1) |
NEOs included in the above table for each year are the following:
|
|
Year
|
First PEO
|
Second PEO
|
Non-PEOs
|
|
2025
|
N/A
|
Ryan S. Napierski
|
James D. Thomas, Chayce D. Clark, Steven K. Hatchett, Justin S. Keisel
|
|
2024
|
N/A
|
Ryan S. Napierski
|
James D. Thomas, Chayce D. Clark, Steven K. Hatchett, Justin S. Keisel
|
|
2023
|
N/A
|
Ryan S. Napierski
|
James D. Thomas, Chayce D. Clark, Steven K. Hatchett, Connie Tang, Mark H. Lawrence, Joseph Y. Chang
|
|
2022
|
N/A
|
Ryan S. Napierski
|
Mark H. Lawrence, Connie Tang, Joseph Y. Chang, Chayce D. Clark
|
|
2021
|
Ritch N. Wood
|
Ryan S. Napierski
|
Mark H. Lawrence, Connie Tang, Joseph Y. Chang, Chayce D. Clark, D. Matthew Dorny, Jeffrey C. Bettinger
|
| (3) |
Calculated in the manner prescribed by SEC rules. Indicates the value, as of December 31 of each year, of an assumed $100 initial investment that is invested on
December 31, 2020 in our company’s common stock and the S&P SmallCap 600 Consumer Staples Index, the same index that was used in the Stock Performance Graph in our Annual Report on Form 10-K filed for the fiscal year ended
December 31, 2025.
|
| (2) |
Adjustments made to calculate 2025 “compensation actually paid” pursuant to SEC rules are as follows:
|
|
PEO ($)
|
Average of
Other NEOs ($)
|
||
|
Total Compensation in SCT
|
5,965,206
|
1,754,606
|
|
|
Less: Grant date value of stock awards and option awards reported in SCT
|
(4,616,823)
|
(1,118,146)
|
|
|
Plus: Year-end value of awards granted during the year that are outstanding and unvested as of year-end
|
7,109,675
|
1,721,893
|
|
|
Plus (less): Change in value, from prior year-end to year-end, of awards granted in a prior year that are outstanding and
unvested as of year-end
|
618,438
|
143,264
|
|
|
Plus (less): Change in value, from prior year-end to vesting date, of awards granted in a prior year that vested during the
year
|
75,365
|
36,470
|
|
|
Total Adjustments
|
3,186,655
|
783,481
|
|
|
Compensation Actually Paid
|
9,151,861
|
2,538,087
|
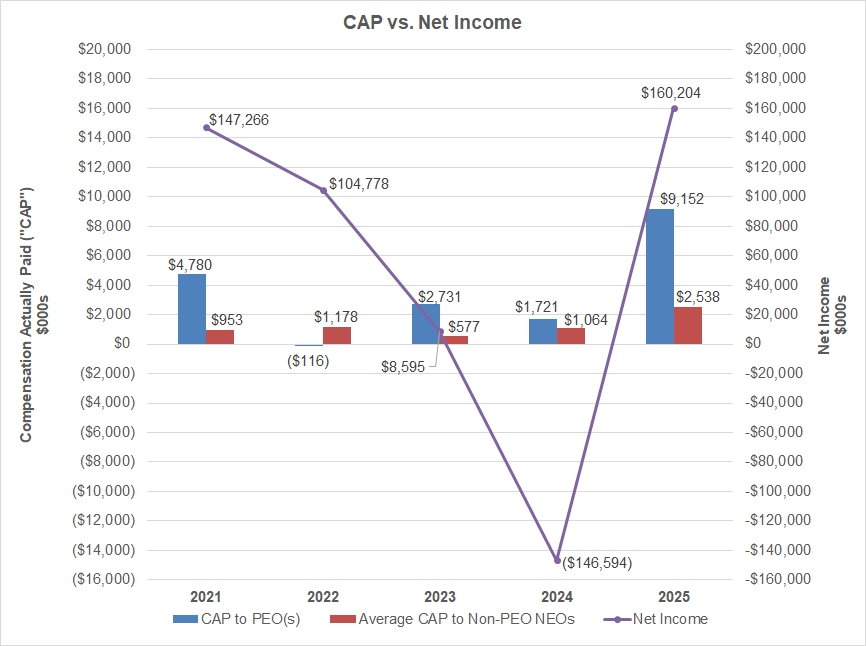
The following chart depicts the relationship between the “compensation actually paid” to our NEOs and our net income.
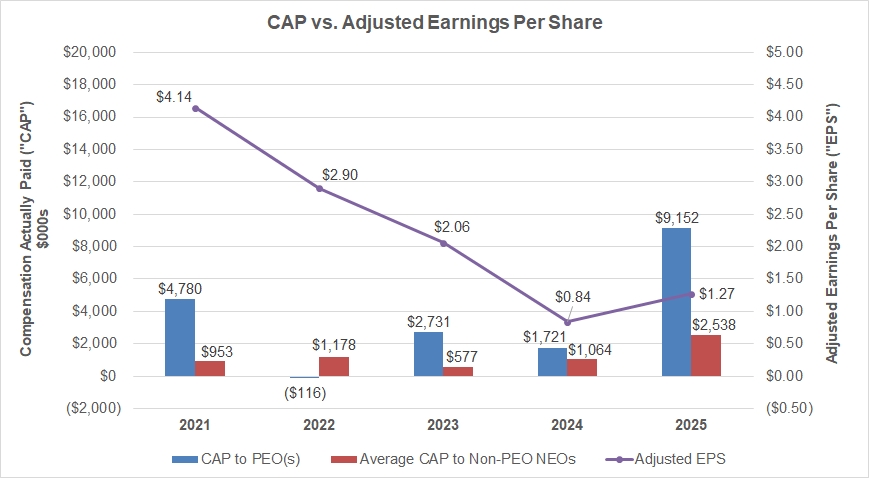
The following chart depicts the relationship between the “compensation actually paid” to our NEOs and our Adjusted EPS.
Most Important Financial Performance Measures. We believe the most important financial performance measures that are used to link the “compensation actually paid” to our NEOs to our 2025 performance are the
following, with Adjusted EPS being the most important of these measures:
|
Adjusted EPS
|
|
|
Adjusted revenue
|
|
|
Adjusted operating income
|
|
|
Adjusted Nu Skin gross margin
|
|
|
Adjusted Nu Skin selling expense percentage
|
|
|
Adjusted Rhyz revenue
|
| (4) |
We believe Adjusted EPS is the most important
financial performance measure that is used to link the “compensation actually paid” to our NEOs in 2025 to our performance. On average, equity awards constitute the largest component of our NEOs’ 2025 target compensation, and Adjusted
EPS is the metric used for our performance-based equity awards. Adjusted EPS is measured as diluted EPS excluding extraneous items such as the impact of accounting changes; losses or gains on settlements of litigation that began prior
to the beginning of the respective year; and other items that are non-recurring, unusual, infrequent or outside of management’s control. For further information about the calculation of Adjusted EPS, see “Executive Compensation:
Compensation Discussion and Analysis”—“Performance-Based Awards Granted in 2023–2025—Goals and Vesting.”
|