Pay vs Performance Disclosure - USD ($)
Dec. 31, 2025
Dec. 31, 2024
Dec. 31, 2023
PAY VERSUS PERFORMANCE
Year | Summary Compensation Table Total for PEO | Compensation Actually Paid to PEO(1) | Average Summary Compensation Table Total for Non-PEO Named Executive Officers | Average Compensation Actually Paid to Non-PEO Named Executive Officers(2) | Value of Initial Fixed $100 Based on Company Total Shareholder Return(3) | Net Income | ||||||||||||
2025 | $2,375,029 | $2,322,908 | $2,124,754 | $1,940,724 | $173.44 | $43,069,258 | ||||||||||||
2024 | $1,816,787 | $2,988,450 | $1,204,719 | $1,428,503 | $192.73 | $45,695,795 | ||||||||||||
2023 | $1,434,281 | $1,404,851 | $821,455 | $822,411 | $110.04 | $28,274,696 | ||||||||||||
(1) | Amounts shown represent compensation actually paid (CAP) and include the following adjustments for changes in the fair value of stock option awards and restricted stock unit awards: |
Thomas L. Travis - PEO
Year | Summary Compensation Table Total for PEO | Adjustments for the Fair Value of Equity Awards as of Year-End | Adjustments for the Change in the Fair Value of the Prior Years’ Awards, Unvested as of Year-End | Adjustment for the Change in the Fair Value of the Prior Years’ Awards that Vested during the Year | Compensation Actually Paid | ||||||||||
2025 | $2,375,029 | ($55,233) | ($24,685) | $27,797 | $2,322,908 | ||||||||||
2024 | $1,816,787 | $247,785 | $349,741 | $574,138 | $2,988,450 | ||||||||||
2023 | $1,434,281 | ($49,739) | $34,125 | ($13,815) | $1,404,851 | ||||||||||
(2) | Amounts shown represent compensation actually paid (CAP) and include the following adjustments for changes in the fair value of stock option awards and restricted stock unit awards: |
Average Other NEOs
Year | Summary Compensation Table Total | Adjustments for the Fair Value of Equity Awards as of Year-End | Adjustments for the Change in the Fair Value of the Prior Years’ Awards, Unvested as of Year-End | Adjustment for the Change in the Fair Value of the Prior Years’ Awards that Vested during the Year | Compensation Actually Paid | ||||||||||
2025 | $2,124,754 | ($186,949) | ($11,167) | $14,087 | $1,940,724 | ||||||||||
2024 | $1,204,719 | $57,467 | $82,963 | $83,354 | $1,428,503 | ||||||||||
2023 | $821,455 | ($10,790) | $9,056 | $2,690 | $822,411 | ||||||||||
(3) | Calculated on a cumulative basis based on $100 invested as of market close on December 31, 2022, including the reinvestment of dividends. |
(1) | Amounts shown represent compensation actually paid (CAP) and include the following adjustments for changes in the fair value of stock option awards and restricted stock unit awards: |
Thomas L. Travis - PEO
Year | Summary Compensation Table Total for PEO | Adjustments for the Fair Value of Equity Awards as of Year-End | Adjustments for the Change in the Fair Value of the Prior Years’ Awards, Unvested as of Year-End | Adjustment for the Change in the Fair Value of the Prior Years’ Awards that Vested during the Year | Compensation Actually Paid | ||||||||||
2025 | $2,375,029 | ($55,233) | ($24,685) | $27,797 | $2,322,908 | ||||||||||
2024 | $1,816,787 | $247,785 | $349,741 | $574,138 | $2,988,450 | ||||||||||
2023 | $1,434,281 | ($49,739) | $34,125 | ($13,815) | $1,404,851 | ||||||||||
(2) | Amounts shown represent compensation actually paid (CAP) and include the following adjustments for changes in the fair value of stock option awards and restricted stock unit awards: |
Average Other NEOs
Year | Summary Compensation Table Total | Adjustments for the Fair Value of Equity Awards as of Year-End | Adjustments for the Change in the Fair Value of the Prior Years’ Awards, Unvested as of Year-End | Adjustment for the Change in the Fair Value of the Prior Years’ Awards that Vested during the Year | Compensation Actually Paid | ||||||||||
2025 | $2,124,754 | ($186,949) | ($11,167) | $14,087 | $1,940,724 | ||||||||||
2024 | $1,204,719 | $57,467 | $82,963 | $83,354 | $1,428,503 | ||||||||||
2023 | $821,455 | ($10,790) | $9,056 | $2,690 | $822,411 | ||||||||||
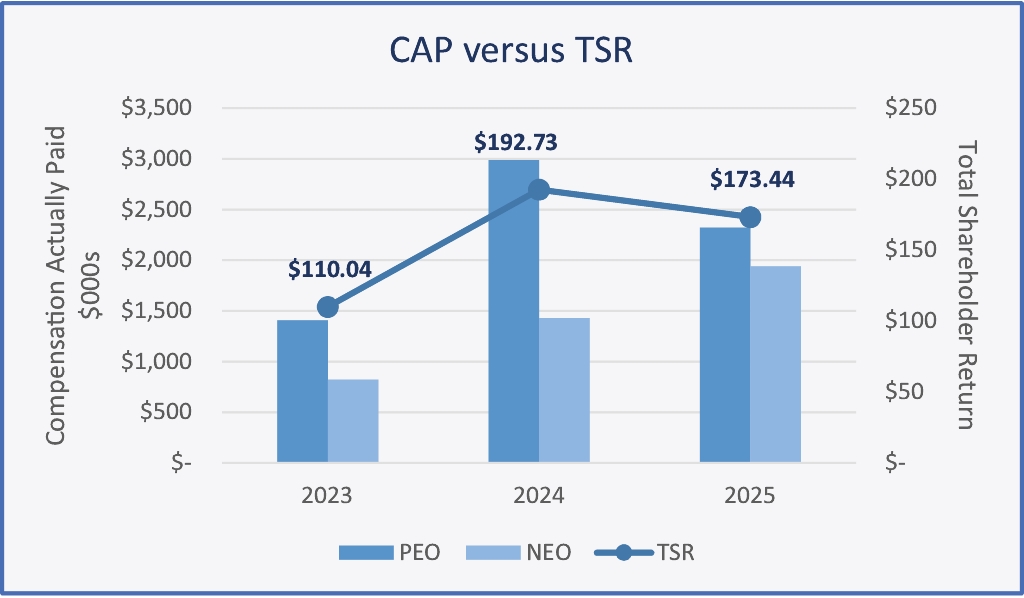
Compensation Actually Paid Compared to Total Shareholder Returns
The graph below shows our compensation actually paid compared to our cumulative TSR over the past three-year period. The amount of compensation actually paid to the Company’s PEO and NEOs as a group is generally aligned with the Company’s cumulative TSR over the three years presented in the table; however, the average compensation paid to the Company’s other NEOs as a group increased in 2025 despite a reduction in cumulative TSR as a result of a one-time retention stock unit award issued to Mr. Estes.
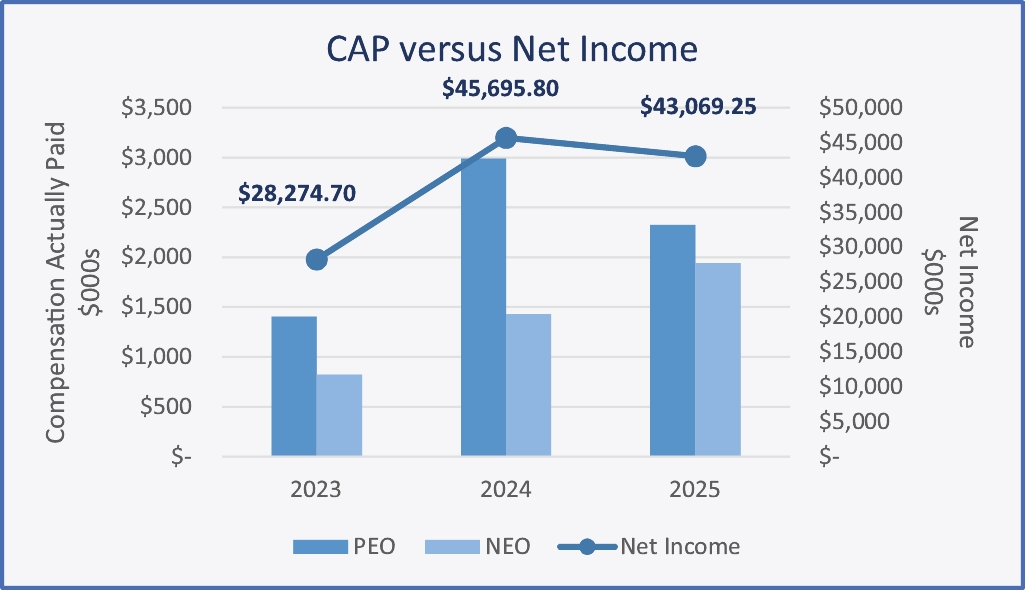
Compensation Actually Paid Compared to Net Income
The graph below shows our compensation actually paid compared to our net income over the past three-year period. The amount of compensation actually paid to the Company’s PEO and NEOs as a group is generally aligned with the Company’s net income over the three years presented in the table; however, the average compensation paid to the Company’s other NEOs as a group increased in 2025 despite a reduction in net income as a result of a one-time retention stock unit award issued to Mr. Estes.