Pay vs Performance Disclosure - USD ($)
|
12 Months Ended |
24 Months Ended |
Dec. 31, 2025 |
Dec. 31, 2024 |
Dec. 31, 2023 |
Dec. 31, 2022 |
Dec. 31, 2021 |
Dec. 31, 2024 |
Dec. 31, 2021 |
| Pay vs Performance Disclosure |
|
|
|
|
|
|
|
| Pay vs Performance Disclosure, Table |
| | | | | | | | | | | | | | | | | | | | | | | | | | | | | | | | | | | | | | | | | | | | | | | | | | | | | | | | | | | | | | |
| Summary Compensation Table Total for CEO (1) | Summary Compensation Table Total for CEO (2) | Compensation Actually Paid to CEO (3) | Compensation Actually Paid to CEO (4) | Average Summary Compensation Table Total for Non-CEO NEOs (5) | Average Compensation Actually Paid to Non-CEO NEOs (6) | Value
of Initial
Fixed $100
Investment
Return on: | |
| Year | CWK
TSR (7) | Peer Group TSR (7) | Net Income
(Loss) | Compensation EBITDA (8) | (a) | (b)(i) | (b)(ii) | (c)(i) | (c)(ii) | (d) | (e) | (f) | (g) | (h) | (i) | | 2025 | | $ | 9,469,699 | | | | | $ | 15,642,206 | | | | | $ | 3,476,416 | | | $ | 5,575,775 | | | $ | 109 | | | $ | 216 | | | $ | 88,200,000 | | | $ | 604,000,000 | | | 2024 | | $ | 9,682,351 | | | | | $ | 12,644,306 | | | | | $ | 4,936,365 | | | $ | 4,879,543 | | | $ | 88 | | | $ | 174 | | | $ | 131,300,000 | | | $ | 591,000,000 | | | 2023 | | $ | 4,668,810 | | | $ | 5,326,223 | | | $ | 3,809,627 | | | $ | 3,785,709 | | | $ | 3,686,033 | | | $ | 2,842,435 | | | $ | 73 | | | $ | 137 | | | $ | (35,400,000) | | | $ | 581,300,000 | | | 2022 | | $ | 8,587,627 | | | | | $ | 1,753,622 | | | | | $ | 5,909,537 | | | $ | 1,579,668 | | | $ | 84 | | | $ | 110 | | | $ | 196,400,000 | | | $ | 963,000,000 | | | 2021 | | $ | 19,990,492 | | | | | $ | 30,999,620 | | | | | $ | 4,632,973 | | | $ | 6,962,418 | | | $ | 150 | | | $ | 177 | | | $ | 250,000,000 | | | $ | 877,000,000 | | | | | | | | | | | | | | | | | | | | | | | (1)The dollar amounts reported in column (b)(i) are the amounts of total compensation reported in the Summary Compensation Table for Ms. MacKay in 2025, 2024 and 2023, John Forrester in 2022, and Mr. White in 2021, respectively. (2)We had two CEOs in fiscal year 2023. Mr. Forrester served as our CEO from January 1, 2023 to June 30, 2023, and Ms. MacKay served as our CEO from July 1, 2023 to December 31, 2023. The dollar amount reported in column (b)(ii) is the amount of total compensation reported in the Summary Compensation Table for Mr. Forrester in 2023. (3)The dollar amounts reported in column (c)(i) represent the amount of “compensation actually paid” to (a) Ms. MacKay in 2025, 2024 and 2023, (b) Mr. Forrester in 2022, and (c) Mr. White in 2021. All such amounts were computed in accordance with Item 402(v) of Regulation S-K. The dollar amounts do not reflect the actual amount of compensation earned by or paid to such individuals during the applicable year. The table below shows adjustments which were made to Ms. MacKay’s total compensation in 2025 to determine the “compensation actually paid.” For such adjustments, equity values were calculated in accordance with Topic 718. (4)We had two CEOs in fiscal year 2023. The dollar amount reported in column (c)(ii) represents the amount of “compensation actually paid” to Mr. Forrester in 2023. (5)The dollar amounts reported in column (d) represent the average of the amounts reported for the Company’s Named Executive Officers as a group (excluding our CEOs in each year) in the “Total” column of the Summary Compensation Table in each year. The names of each of the Named Executive Officers (excluding our CEOs in each year) included for purposes of calculating the average amounts in each year are as follows: (i) for 2025, Mr. Johnston, Mr. McDonald, Mr. Robinson and Ms. Perkins; (ii) for 2024, Mr. Johnston, Mr. McDonald, Mr. Robinson, Ms. Perkins and Mr. White; (iii) for 2023, Mr. Johnston, Mr. White, Mr. McDonald and Ms. Perkins; (iv) for 2022, Mr. Johnston, Mr. White, Ms. MacKay and Mr. McDonald; and (v) for 2021, Duncan Palmer, Mr. Johnston, Mr. Forrester, Ms. MacKay and Mr. Robinson. (6)The dollar amounts reported in column (e) represent the average amount of “compensation actually paid” to the Named Executive Officers as a group (excluding our CEOs in each year), as computed in accordance with Item 402(v) of Regulation S-K. The dollar amounts do not reflect the actual average amount of compensation earned by or paid to the Named Executive Officers as a group (excluding our CEOs in each year) during the applicable year. The table shows adjustments that were made to average total compensation for the Named Executive Officers as a group (excluding our CEO in each year) in 2025 to determine the “compensation actually paid.” For such adjustments, equity values were calculated in accordance with Topic 718. (7)TSR is determined based on the value of an initial fixed investment of $100 on December 31, 2020, including the reinvestment of dividends. The Peer Group TSR reported in column (g) is comprised of four global commercial real estate services companies publicly traded in the United States: Jones Lang LaSalle Incorporated (NYSE: JLL), CBRE Group, Inc. (NYSE: CBRE), Colliers International Group Inc. (Nasdaq: CIGI) and Newmark Group Inc. (Nasdaq: NMRK). This is the same peer group as reported in the 2025 Annual Report. (8)Adjusted EBITDA is defined as net income (loss) plus depreciation and amortization, interest expense, net of interest income, and provision for income taxes, and adjusted for unrealized (gain) loss on investments, net, impairment of investments, loss on dispositions, net, acquisition related costs, cost savings initiatives, system implementation costs, loss (gain) from insurance proceeds, net of legal fees, non-operating items related to Cushman Wakefield Greystone LLC and other non-recurring items. Compensation EBITDA reported in column (i) is defined as Adjusted EBITDA further adjusted for (a) foreign currency rate fluctuations and (b) certain other one-time items outside of our control. While the Company uses numerous financial and non-financial measures for the purpose of evaluating performance for the Company’s compensation programs, the Company has determined that Compensation EBITDA represents the most important measure used by the Company to link “compensation actually paid” to our Named Executive Officers to Company performance for the most recently completed year. In recent years, we have improved our quality of earnings by reducing the number of adjustments to these metrics. | | | | | | | | | | | | | | | | | | | | | |
| | | | | | | | | | | | | | 2025 | | | (MacKay) | | SCT Total Compensation | | $ | 9,469,699 | | | Less: Stock Award Values Reported in SCT for the Covered Year | | $ | (5,687,408) | | | Plus: Year End Fair Value of Stock Awards Granted in the Covered Year | | $ | 8,439,257 | | | Change in Fair Value of Outstanding Unvested Stock Awards from Prior Years | | $ | 4,055,405 | | | Fair Value of Stock Awards Granted and Vested in the Covered Year | | $ | — | | | Change in Fair Value of Stock Awards from Prior Years that Vested in the Covered Year | | $ | (161,173) | | | Less: Fair Value of Stock Awards Forfeited during the Covered Year | | $ | (473,574) | | | Compensation Actually Paid | | $ | 15,642,206 | | | | | |
| | | | | | | | | | | | | | Non-CEO NEO Average | | | 2025 | | SCT Total Compensation | | $ | 3,476,416 | | | Less: Stock Award Values Reported in SCT for the Covered Year | | $ | (1,728,502) | | | Plus: Year End Fair Value of Stock Awards Granted in the Covered Year | | $ | 2,660,618 | | | Change in Fair Value of Outstanding Unvested Stock Awards from Prior Years | | $ | 1,471,781 | | | Fair Value of Stock Awards Granted and Vested in the Covered Year | | $ | — | | | Change in Fair Value of Stock Awards from Prior Years that Vested in the Covered Year | | $ | (79,398) | | | Less: Fair Value of Stock Awards Forfeited during the Covered Year | | $ | (225,140) | | | Compensation Actually Paid | | $ | 5,575,775 | | | | | |
|
|
|
|
|
|
|
| Company Selected Measure Name |
Compensation EBITDA
|
|
|
|
|
|
|
| PEO Total Compensation Amount |
$ 9,469,699
|
|
|
|
|
|
|
| PEO Actually Paid Compensation Amount |
$ 15,642,206
|
|
|
|
|
|
|
| Adjustment To PEO Compensation, Footnote |
The dollar amounts reported in column (b)(i) are the amounts of total compensation reported in the Summary Compensation Table for Ms. MacKay in 2025, 2024 and 2023, John Forrester in 2022, and Mr. White in 2021, respectively. We had two CEOs in fiscal year 2023. Mr. Forrester served as our CEO from January 1, 2023 to June 30, 2023, and Ms. MacKay served as our CEO from July 1, 2023 to December 31, 2023. The dollar amount reported in column (b)(ii) is the amount of total compensation reported in the Summary Compensation Table for Mr. Forrester in 2023.The dollar amounts reported in column (c)(i) represent the amount of “compensation actually paid” to (a) Ms. MacKay in 2025, 2024 and 2023, (b) Mr. Forrester in 2022, and (c) Mr. White in 2021. All such amounts were computed in accordance with Item 402(v) of Regulation S-K. The dollar amounts do not reflect the actual amount of compensation earned by or paid to such individuals during the applicable year. The table below shows adjustments which were made to Ms. MacKay’s total compensation in 2025 to determine the “compensation actually paid.” For such adjustments, equity values were calculated in accordance with Topic 718.We had two CEOs in fiscal year 2023. The dollar amount reported in column (c)(ii) represents the amount of “compensation actually paid” to Mr. Forrester in 2023.
|
|
|
|
|
|
|
| Non-PEO NEO Average Total Compensation Amount |
$ 3,476,416
|
$ 4,936,365
|
$ 3,686,033
|
$ 5,909,537
|
$ 4,632,973
|
|
|
| Non-PEO NEO Average Compensation Actually Paid Amount |
$ 5,575,775
|
4,879,543
|
2,842,435
|
1,579,668
|
6,962,418
|
|
|
| Adjustment to Non-PEO NEO Compensation Footnote |
The dollar amounts reported in column (d) represent the average of the amounts reported for the Company’s Named Executive Officers as a group (excluding our CEOs in each year) in the “Total” column of the Summary Compensation Table in each year. The names of each of the Named Executive Officers (excluding our CEOs in each year) included for purposes of calculating the average amounts in each year are as follows: (i) for 2025, Mr. Johnston, Mr. McDonald, Mr. Robinson and Ms. Perkins; (ii) for 2024, Mr. Johnston, Mr. McDonald, Mr. Robinson, Ms. Perkins and Mr. White; (iii) for 2023, Mr. Johnston, Mr. White, Mr. McDonald and Ms. Perkins; (iv) for 2022, Mr. Johnston, Mr. White, Ms. MacKay and Mr. McDonald; and (v) for 2021, Duncan Palmer, Mr. Johnston, Mr. Forrester, Ms. MacKay and Mr. Robinson.The dollar amounts reported in column (e) represent the average amount of “compensation actually paid” to the Named Executive Officers as a group (excluding our CEOs in each year), as computed in accordance with Item 402(v) of Regulation S-K. The dollar amounts do not reflect the actual average amount of compensation earned by or paid to the Named Executive Officers as a group (excluding our CEOs in each year) during the applicable year. The table shows adjustments that were made to average total compensation for the Named Executive Officers as a group (excluding our CEO in each year) in 2025 to determine the “compensation actually paid.” For such adjustments, equity values were calculated in accordance with Topic 718.
|
|
|
|
|
|
|
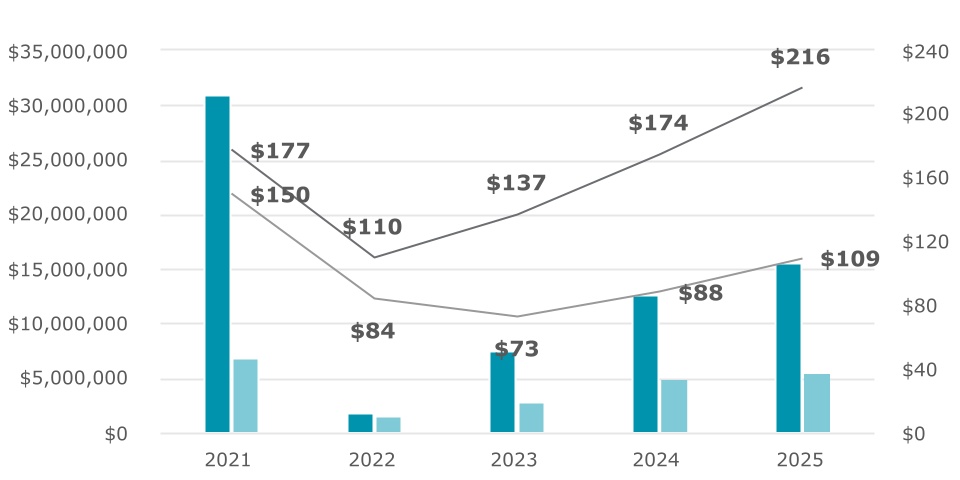
| Compensation Actually Paid vs. Total Shareholder Return |
COMPENSATION ACTUALLY PAID AND TSRs | | | | | | | | | | | | | | | | | | | | | | | | | CEO | | Average for Non-CEO NEOs | | Company TSR | | Peer Group TSR |
|
|
|
|
|
|
|
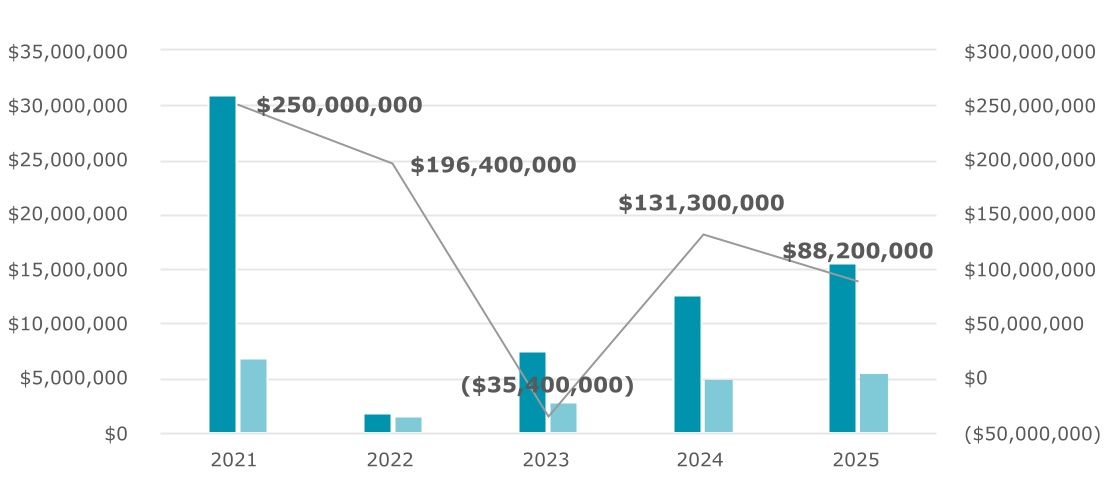
| Compensation Actually Paid vs. Net Income |
COMPENSATION ACTUALLY PAID AND NET INCOME (LOSS) | | | | | | | | | | | | | | | | | | | CEO | | Average for Non-CEO NEOs | | Net Income (Loss) |
|
|
|
|
|
|
|
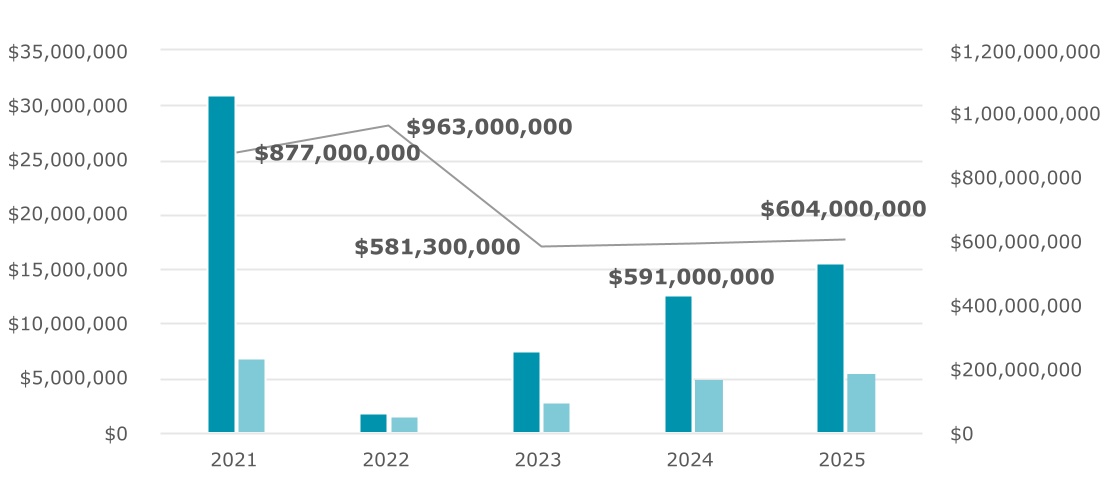
| Compensation Actually Paid vs. Company Selected Measure |
COMPENSATION ACTUALLY PAID AND COMPENSATION EBITDA | | | | | | | | | | | | | | | | | | | CEO | | Average for Non-CEO NEOs | | Compensation EBITDA |
|
|
|
|
|
|
|
| Total Shareholder Return Vs Peer Group |
COMPENSATION ACTUALLY PAID AND TSRs | | | | | | | | | | | | | | | | | | | | | | | | | CEO | | Average for Non-CEO NEOs | | Company TSR | | Peer Group TSR |
|
|
|
|
|
|
|
| Tabular List, Table |
| | | | Most Important Performance Measures | | Compensation EBITDA | | Adjusted EPS | | Strategic Cash Generation | | Strategic Cost Efficiency | | Adjusted Free Cash Flow |
|
|
|
|
|
|
|
| Total Shareholder Return Amount |
$ 109
|
88
|
73
|
84
|
150
|
|
|
| Peer Group Total Shareholder Return Amount |
216
|
174
|
137
|
110
|
177
|
|
|
| Net Income (Loss) |
$ 88,200,000
|
$ 131,300,000
|
$ (35,400,000)
|
$ 196,400,000
|
$ 250,000,000
|
|
|
| Company Selected Measure Amount |
604,000,000
|
591,000,000
|
581,300,000
|
963,000,000
|
877,000,000
|
|
|
| PEO Name |
|
|
John Forrester
|
|
|
Ms.MacKay
|
Mr. White
|
| Additional 402(v) Disclosure |
TSR is determined based on the value of an initial fixed investment of $100 on December 31, 2020, including the reinvestment of dividends. The Peer Group TSR reported in column (g) is comprised of four global commercial real estate services companies publicly traded in the United States: Jones Lang LaSalle Incorporated (NYSE: JLL), CBRE Group, Inc. (NYSE: CBRE), Colliers International Group Inc. (Nasdaq: CIGI) and Newmark Group Inc. (Nasdaq: NMRK). This is the same peer group as reported in the 2025 Annual Report.
|
|
|
|
|
|
|
| Measure:: 1 |
|
|
|
|
|
|
|
| Pay vs Performance Disclosure |
|
|
|
|
|
|
|
| Name |
Compensation EBITDA
|
|
|
|
|
|
|
| Non-GAAP Measure Description |
Adjusted EBITDA is defined as net income (loss) plus depreciation and amortization, interest expense, net of interest income, and provision for income taxes, and adjusted for unrealized (gain) loss on investments, net, impairment of investments, loss on dispositions, net, acquisition related costs, cost savings initiatives, system implementation costs, loss (gain) from insurance proceeds, net of legal fees, non-operating items related to Cushman Wakefield Greystone LLC and other non-recurring items. Compensation EBITDA reported in column (i) is defined as Adjusted EBITDA further adjusted for (a) foreign currency rate fluctuations and (b) certain other one-time items outside of our control. While the Company uses numerous financial and non-financial measures for the purpose of evaluating performance for the Company’s compensation programs, the Company has determined that Compensation EBITDA represents the most important measure used by the Company to link “compensation actually paid” to our Named Executive Officers to Company performance for the most recently completed year. In recent years, we have improved our quality of earnings by reducing the number of adjustments to these metrics.
|
|
|
|
|
|
|
| Measure:: 2 |
|
|
|
|
|
|
|
| Pay vs Performance Disclosure |
|
|
|
|
|
|
|
| Name |
Adjusted EPS
|
|
|
|
|
|
|
| Measure:: 3 |
|
|
|
|
|
|
|
| Pay vs Performance Disclosure |
|
|
|
|
|
|
|
| Name |
Strategic Cash Generation
|
|
|
|
|
|
|
| Measure:: 4 |
|
|
|
|
|
|
|
| Pay vs Performance Disclosure |
|
|
|
|
|
|
|
| Name |
Strategic Cost Efficiency
|
|
|
|
|
|
|
| Measure:: 5 |
|
|
|
|
|
|
|
| Pay vs Performance Disclosure |
|
|
|
|
|
|
|
| Name |
Adjusted Free Cash Flow
|
|
|
|
|
|
|
| Ms. MacKay [Member] |
|
|
|
|
|
|
|
| Pay vs Performance Disclosure |
|
|
|
|
|
|
|
| PEO Total Compensation Amount |
$ 9,469,699
|
$ 9,682,351
|
$ 4,668,810
|
|
|
|
|
| PEO Actually Paid Compensation Amount |
15,642,206
|
$ 12,644,306
|
3,809,627
|
|
|
|
|
| Mr. Forrester [Member] |
|
|
|
|
|
|
|
| Pay vs Performance Disclosure |
|
|
|
|
|
|
|
| PEO Total Compensation Amount |
|
|
5,326,223
|
$ 8,587,627
|
|
|
|
| PEO Actually Paid Compensation Amount |
|
|
$ 3,785,709
|
$ 1,753,622
|
|
|
|
| Mr. White [Member] |
|
|
|
|
|
|
|
| Pay vs Performance Disclosure |
|
|
|
|
|
|
|
| PEO Total Compensation Amount |
|
|
|
|
$ 19,990,492
|
|
|
| PEO Actually Paid Compensation Amount |
|
|
|
|
$ 30,999,620
|
|
|
| PEO | Aggregate Change in Present Value of Accumulated Benefit for All Pension Plans Reported in Summary Compensation Table |
|
|
|
|
|
|
|
| Pay vs Performance Disclosure |
|
|
|
|
|
|
|
| Adjustment to Compensation, Amount |
(5,687,408)
|
|
|
|
|
|
|
| PEO | Year-end Fair Value of Equity Awards Granted in Covered Year that are Outstanding and Unvested |
|
|
|
|
|
|
|
| Pay vs Performance Disclosure |
|
|
|
|
|
|
|
| Adjustment to Compensation, Amount |
8,439,257
|
|
|
|
|
|
|
| PEO | Year-over-Year Change in Fair Value of Equity Awards Granted in Prior Years That are Outstanding and Unvested |
|
|
|
|
|
|
|
| Pay vs Performance Disclosure |
|
|
|
|
|
|
|
| Adjustment to Compensation, Amount |
4,055,405
|
|
|
|
|
|
|
| PEO | Vesting Date Fair Value of Equity Awards Granted and Vested in Covered Year |
|
|
|
|
|
|
|
| Pay vs Performance Disclosure |
|
|
|
|
|
|
|
| Adjustment to Compensation, Amount |
0
|
|
|
|
|
|
|
| PEO | Change in Fair Value as of Vesting Date of Prior Year Equity Awards Vested in Covered Year |
|
|
|
|
|
|
|
| Pay vs Performance Disclosure |
|
|
|
|
|
|
|
| Adjustment to Compensation, Amount |
(161,173)
|
|
|
|
|
|
|
| PEO | Prior Year End Fair Value of Equity Awards Granted in Any Prior Year that Fail to Meet Applicable Vesting Conditions During Covered Year |
|
|
|
|
|
|
|
| Pay vs Performance Disclosure |
|
|
|
|
|
|
|
| Adjustment to Compensation, Amount |
(473,574)
|
|
|
|
|
|
|
| Non-PEO NEO | Aggregate Change in Present Value of Accumulated Benefit for All Pension Plans Reported in Summary Compensation Table |
|
|
|
|
|
|
|
| Pay vs Performance Disclosure |
|
|
|
|
|
|
|
| Adjustment to Compensation, Amount |
(1,728,502)
|
|
|
|
|
|
|
| Non-PEO NEO | Year-end Fair Value of Equity Awards Granted in Covered Year that are Outstanding and Unvested |
|
|
|
|
|
|
|
| Pay vs Performance Disclosure |
|
|
|
|
|
|
|
| Adjustment to Compensation, Amount |
2,660,618
|
|
|
|
|
|
|
| Non-PEO NEO | Year-over-Year Change in Fair Value of Equity Awards Granted in Prior Years That are Outstanding and Unvested |
|
|
|
|
|
|
|
| Pay vs Performance Disclosure |
|
|
|
|
|
|
|
| Adjustment to Compensation, Amount |
1,471,781
|
|
|
|
|
|
|
| Non-PEO NEO | Vesting Date Fair Value of Equity Awards Granted and Vested in Covered Year |
|
|
|
|
|
|
|
| Pay vs Performance Disclosure |
|
|
|
|
|
|
|
| Adjustment to Compensation, Amount |
0
|
|
|
|
|
|
|
| Non-PEO NEO | Change in Fair Value as of Vesting Date of Prior Year Equity Awards Vested in Covered Year |
|
|
|
|
|
|
|
| Pay vs Performance Disclosure |
|
|
|
|
|
|
|
| Adjustment to Compensation, Amount |
(79,398)
|
|
|
|
|
|
|
| Non-PEO NEO | Prior Year End Fair Value of Equity Awards Granted in Any Prior Year that Fail to Meet Applicable Vesting Conditions During Covered Year |
|
|
|
|
|
|
|
| Pay vs Performance Disclosure |
|
|
|
|
|
|
|
| Adjustment to Compensation, Amount |
$ (225,140)
|
|
|
|
|
|
|