The information below is provided pursuant to the SEC pay versus performance disclosure requirements set forth in Item 402(v) of SEC Regulation S-K (the “Pay Versus Performance Rule”), which requires companies to disclose certain information about the relationship between “Compensation Actually Paid” (“CAP”) to our CEO and to our Other NEOs and certain financial performance of the Company. CAP, as determined under SEC requirements, does not reflect the actual amount of compensation earned by or paid to our Executive Officers during a covered year.
Pay Vs Performance
| Value of Initial Fixed | |||||||||||||||||||
$100 Investment Based | Other Performance | |||||||||||||||||||
CEO Pay (Burns) | CEO Pay (Gustafsson) | Other NEO Pay | On: | Measures | ||||||||||||||||
|
|
|
| Average |
|
|
|
|
| |||||||||||
Summary | Summary | Summary | ||||||||||||||||||
Compensation | Compensation | Compensation | Average | Cumulative | ||||||||||||||||
| Table Total | | Compensation | | Table Total | | Compensation | | Table Total | | Compensation | | Cumulative | | Peer Group | | Net Income | | Net Sales | |
Compensation | Actually Paid(5) | Compensation | Actually Paid(5) | Compensation | Actually Paid(5) | TSR(2) | TSR(3) | (in millions) | (in millions)(4) | |||||||||||
Year(1) | | ($) | ($) | ($) | ($) | ($) | ($) | ($) | ($) | ($) | ($) | |||||||||
2025 |
| 13,890,300 | 6,427,632 | n/a | n/a | 4,123,239 | 1,647,313 | 63.18 | 258.38 | 419 | 5,396 | |||||||||
2024 |
| 13,462,794 | 20,194,850 | n/a | n/a | 4,256,784 | 5,849,061 | 151 | 300 | 528 | 4,981 | |||||||||
2023 |
| 11,259,895 | 11,421,955 | 9,505,801 | 8,505,689 | 3,213,206 | 3,348,299 | 107.00 | 219.40 | 296 | 4,584 | |||||||||
2022 |
| n/a | n/a |
| 14,658,743 |
| (17,540,875) | 3,551,048 |
| (1,906,950) |
| 100.38 |
| 139.00 |
| 463 |
| 5,781 | ||
2021 |
| n/a | n/a |
| 13,589,616 |
| 37,632,608 | 3,261,693 |
| 6,936,499 |
| 233.01 |
| 193.58 |
| 837 |
| 5,627 | ||
| (1) | The following table indicates the individuals who served as Zebra’s principal executive Officer and other NEOs for each fiscal year: |
Fiscal Year | | Principal Executive Officer | | Other NEOs |
2025 |
| William Burns | Richard Hudson; Cristen Kogl; Jeffrey Schmitz; Joseph White; Nathan Winters | |
2024 |
| William Burns | Cristen Kogl; Jeffrey Schmitz; Joseph White; Nathan Winters | |
2023 |
| Anders Gustafsson (until March 1, 2023); | Joachim Heel; Cristen Kogl; Jeffrey Schmitz; Joseph White; Nathan Winters | |
2022 |
| Anders Gustafsson | William Burns; Joachim Heel; Cristen Kogl; Nathan Winters | |
2021 |
| Anders Gustafsson | William Burns; Joachim Heel; Cristen Kogl; Nathan Winters | |
| (2) | The Cumulative Total Stockholder Return (“TSR”) reflects the value of $100 invested in Zebra common stock on December 31, 2020, assuming the reinvestment of dividends. |
| (3) | The Cumulative Peer Group TSR is market-cap weighted and reflects the TSR for S&P Information Technology Index, which is the peer group that Zebra uses for its industry comparators/index in its Form 10-K. |
| (4) | Net Sales in Zebra’s 2023 and 2024 Proxy Statements were underreported due to an administrative error. |
| (5) | To calculate CAP, the following amounts were deducted from and added to Summary Compensation Table (“SCT”) total compensation: |
Summary Compensation Table Total to Compensation Actually Paid Reconciliation
| Bonus and | Additions to / | ||||||||||||||
Non-Equity | Deductions | (Subtractions | ||||||||||||||
Incentive | Equity | Other | from SCT | from) SCT | Compensation | |||||||||||
Salary | Compensation | Compensation | Compensation(1) | SCT Total | Total(2) | Total(3) | Actually Paid | |||||||||
Year | | ($) | | ($) | | ($) | | ($) | | ($) | | ($) | | ($) | | ($) |
CEO (Burns) |
| |||||||||||||||
2025 |
| 1,025,001 | 1,763,514 | 11,000,214 | 101,572 | 13,890,300 | (11,000,214) | 3,537,546 | 6,427,632 | |||||||
2024 | 1,000,002 | 2,366,554 | 10,000,240 | 95,998 | 13,462,794 | (10,000,240) | 16,732,296 | 20,194,850 | ||||||||
2023 |
| 946,205 | 224,372 | 10,000,537 | 88,782 | 11,259,895 | (10,000,537) | 10,162,596 | 11,421,955 | |||||||
CEO (Gustafsson) |
| |||||||||||||||
2023 |
| 361,537 | 47,397 | 9,000,294 | 96,574 | 9,505,801 | (9,000,294) | 8,000,181 | 8,505,689 | |||||||
2023 |
| 1,200,000 |
| 1,255,500 |
| 12,000,000 |
| 203,243 |
| 14,658,743 |
| (12,000,000) |
| (20,199,618) |
| (17,540,875) |
2022 |
| 1,200,000 |
| 2,912,760 |
| 9,250,404 |
| 226,452 |
| 13,589,616 |
| (9,250,404) |
| 33,293,396 |
| 37,632,608 |
2021 |
| 1,093,846 |
| 781,725 |
| 8,000,100 |
| 202,056 |
| 10,077,727 |
| (8,000,100) |
| 21,779,329 |
| 23,856,956 |
Other NEOs (avg.) |
| |||||||||||||||
2025 |
| 573,034 | 491,496 | 2,935,170 | 123,539 | 4,123,239 | (2,935,170) | 459,245 | 1,647,313 | |||||||
2024 |
| 576,249 | 911,119 | 2,719,099 | 50,316 | 4,256,784 | (2,719,099) | 4,311,376 | 5,849,061 | |||||||
2023 |
| 571,177 | 94,501 | 2,500,286 | 47,242 | 3,213,206 | (2,500,286) | 2,635,379 | 3,348,299 | |||||||
2022 |
| 601,296 |
| 445,129 |
| 2,437,500 |
| 67,123 |
| 3,551,048 |
| (2,437,500) |
| (3,020,498) |
| (1,906,950) |
2021 |
| 543,632 |
| 862,629 |
| 1,800,441 |
| 54,991 |
| 3,261,693 |
| (1,800,441) |
| 5,475,248 |
| 6,936,499 |
| (1) | Reflects “all other compensation” reported in the SCT for each year shown. |
| (2) | Represents the grant date fair value of equity-based awards granted each year. Zebra does not offer pension plans; therefore, a deduction from SCT total related to pension value is not needed. |
| (3) | Reflects the value of equity calculated in accordance with the SEC methodology for determining Compensation Actually Paid for each year shown. The equity component of Compensation Actually Paid for each fiscal year listed in the table is further detailed in the supplemental table below. |
Supplemental Calculations – Compensation Actually Paid
Equity Component of Compensation Actually Paid
| CEO(1) | Other NEOs(1) | ||||||||||||||||||||
| Fair | | | Change in | Fair Value | | | Fair | | | Change in | Fair Value | | |||||||||
Value | Change in | Value of | of Current | Value | Change in | Value of | of Current | |||||||||||||||
of | Value of | Prior | Year | of | Value of | Prior | Year | |||||||||||||||
Current | Prior | Years' | Awards | Current | Prior | Years' | Awards | |||||||||||||||
Year | Years' | Awards | That | Equity | Year | Years' | Awards | That | Equity | |||||||||||||
Equity | Awards | that | Failed | Value | Equity | Awards | that | Failed | Value | |||||||||||||
Awards | Unvested | Vested | to Meet | Included | Awards | Unvested | Vested | to Meet | Included | |||||||||||||
at | at | in | Vesting | in | at | at | in | Vesting | in | |||||||||||||
Equity | 12/31/2025 | 12/31/2025 | FY2025 | Conditions | CAP | 12/31/2025 | 12/31/2025 | FY2025 | Conditions | CAP | ||||||||||||
| Type | ($) | ($) | ($) | ($) | ($) | ($) | ($) | ($) | ($) | ($) | |||||||||||
FY 2025 | SAR | — | — | — | — | — | — | — | — | — | ||||||||||||
RSU | 3,482,039 | (1,715,064) | (903,039) | — | 863,935 | 731,277 | (424,607) | (341,719) | (95,860) | (130,910) | ||||||||||||
PSU | 8,257,655 | (5,451,506) | (132,539) | — | 2,673,610 | 1,734,146 | (811,069) | (61,564) | (271,358) | 590,155 | ||||||||||||
2025 Total | 11,739,694 | (7,166,570) | (1,035,578) | — | 3,537,546 | 2,465,423 | (1,235,676) | (403,283) | (367,218) | 459,245 | ||||||||||||
FY 2024 |
| SAR | — | — | 22,058 | — | 22,058 | — | — | 8,282 | — | 8,282 | ||||||||||
| RSU | 4,922,374 | 851,981 | 229,419 | — | 6,003,774 | 1,347,136 | 351,798 | 91,517 | — | 1,790,451 | |||||||||||
| PSU | 7,498,461 | 3,167,584 | 40,422 | — | 10,706,464 | 1,773,424 | 717,247 | 21,973 | — | 2,512,644 | |||||||||||
| 2024 Total | 12,420,835 | 4,019,562 | 291,899 | — | 16,732,296 | 3,120,559 | 1,069,045 | 121,772 | — | 4,311,376 | |||||||||||
FY 2023 |
| SAR | — | 3,367 | 1,327 | — | 4,694 | — | 1,556 | 1,129 | — | 2,685 | ||||||||||
(Burns |
| RSU | 2,731,113 | (4,302) | 9,289 | — | 2,736,100 | 1,029,087 | (2,549) | 9,784 | — | 1,036,323 | ||||||||||
CEO) |
| PSU | 7,402,050 | (16,242) | 35,994 | — | 7,421,802 | 1,586,243 | (6,499) | 16,627 | — | 1,596,371 | ||||||||||
| 2023 (Burns CEO) Total | 10,133,163 | (17,177) | 46,610 | — | 10,162,596 | 2,615,331 | (7,492) | 27,540 | — | 2,635,379 | |||||||||||
FY 2023 |
| SAR | — | 17,367 | 4,927 | — | 22,294 | |||||||||||||||
(Gustafsson |
| RSU | 7,861,517 | (16,793) | 12,513 | — | 7,857,237 | |||||||||||||||
CEO) |
| PSU | — | (65,152) | 185,802 | — | 120,650 | |||||||||||||||
| 2023 (Gustafsson CEO) Total | 7,861,517 | (64,578) | 203,242 | — | 8,000,181 | ||||||||||||||||
FY 2022 |
| SAR | — | (4,749,403) | (3,927,669) | — | (8,677,071) | — | (567,776) | (488,103) | — | (1,055,879) | ||||||||||
| RSU | 3,345,894 | (3,208,002) | (2,679,084) | — | (2,541,192) | 679,743 | (542,996) | (379,301) | — | (242,554) | |||||||||||
| PSU | 5,018,713 | (8,323,393) | (5,676,675) | — | (8,981,355) | 1,019,551 | (2,115,266) | (626,351) | — | (1,722,066) | |||||||||||
| 2022 Total | 8,364,607 | (16,280,798) | (12,283,428) | — | (20,199,618) | 1,699,294 | (3,226,037) | (1,493,755) | — | (3,020,498) | |||||||||||
FY 2021 |
| SAR | — | 6,424,221 | 2,385,222 | — | 8,809,443 | — | 780,885 | 310,428 | — | 1,091,314 | ||||||||||
| RSU | 4,565,184 | 2,864,669 | 1,487,720 | — | 8,917,573 | 890,568 | 368,707 | 212,330 | — | 1,471,604 | |||||||||||
| PSU | 6,847,776 | 5,838,780 | 2,879,824 | — | 15,566,380 | 1,332,653 | 1,174,409 | 405,268 | — | 2,912,330 | |||||||||||
| 2021 Total | 11,412,960 | 15,127,670 | 6,752,766 | — | 33,293,396 | 2,223,221 | 2,324,001 | 928,026 | — | 5,475,248 | |||||||||||
FY 2020 |
| SAR |
| 3,560,497 | 4,382,827 | (748,856) | — | 7,194,468 | 356,474 | 421,051 | (92,071) | — | 685,454 | |||||||||
| RSU |
| 5,020,503 | 1,946,239 | (620,904) | — | 6,345,838 | 557,816 | 184,700 | (85,710) | — | 656,806 | ||||||||||
| PSU |
| 5,020,503 | 3,953,314 | (734,794) | — | 8,239,023 | 502,704 | 637,309 | (102,566) | — | 1,037,447 | ||||||||||
| 2020 Total |
| 13,601,503 | 10,282,380 | (2,104,554) | — | 21,779,329 | 1,416,994 | 1,243,060 | (280,348) | — | 2,379,706 | ||||||||||
| (1) | The following table indicates the individuals who served as Zebra’s principal executive Officer and other NEOs for each fiscal year: |
Fiscal Year | | Principal Executive Officer | | Other NEOs |
2025 |
| William Burns | Richard Hudson; Cristen Kogl; Jeffrey Schmitz; Joseph White; Nathan Winters | |
2024 |
| William Burns | Cristen Kogl; Jeffrey Schmitz; Joseph White; Nathan Winters | |
2023 |
| Anders Gustafsson (until March 1, 2023); | Joachim Heel; Cristen Kogl; Jeffrey Schmitz; Joseph White; Nathan Winters | |
2022 |
| Anders Gustafsson | William Burns; Joachim Heel; Cristen Kogl; Nathan Winters | |
2021 |
| Anders Gustafsson | William Burns; Joachim Heel; Cristen Kogl; Nathan Winters | |
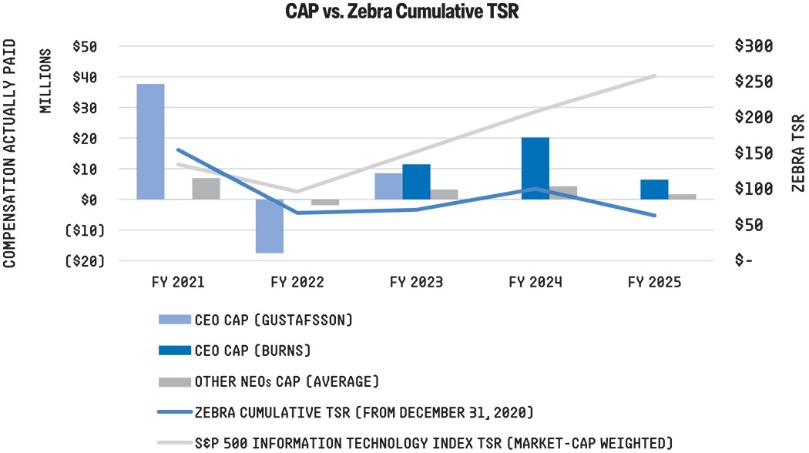
Compensation Actually Paid vs Zebra Cumulative TSR
CAP for the CEO and Other NEOs aligns with Zebra’s TSR over the 2021-2025 period. Zebra’s TSR directly impacts the value of CAP given the weight of equity incentive awards as a part of target compensation in our executive compensation program; during the 2021-2025 period, equity incentive awards comprised on average over 76% of the CEO’s target compensation per year and over 65% of the Other NEOs target compensation per year. This practice aligns the interests of Zebra’s Executive Officers with those of our stockholders. Declines in Zebra’s TSR in 2022 and 2025 led to lower CAP amounts to our CEO and other NEOs in that year; increase in TSR in 2024 led to higher CAP in those years; and the relatively flat TSR in 2023 resulted in modest CEO and Other NEO CAP growth in 2023.
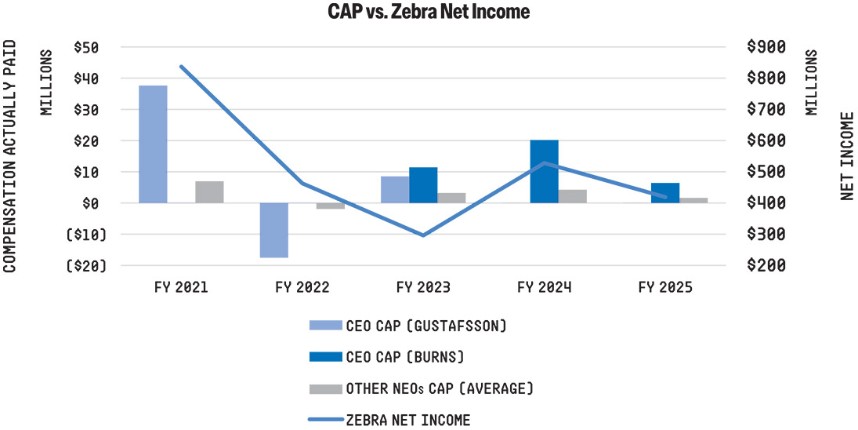
Compensation Actually Paid vs Zebra Net Income
Although Zebra’s executive compensation program does not use Net Income to determine an executive’s total compensation, or an executive officer’s payouts under ZIP or PVRSU grants, CAP for the CEO and Other NEOs generally aligns with Zebra’s Net Income over the 2021-2025 period. This alignment reflects changes to Zebra’s stock price due to changes in Net Income; CAP amounts are sensitive to changes in Zebra’s stock price given the weight of equity incentive awards as a part of target compensation in our executive compensation program.
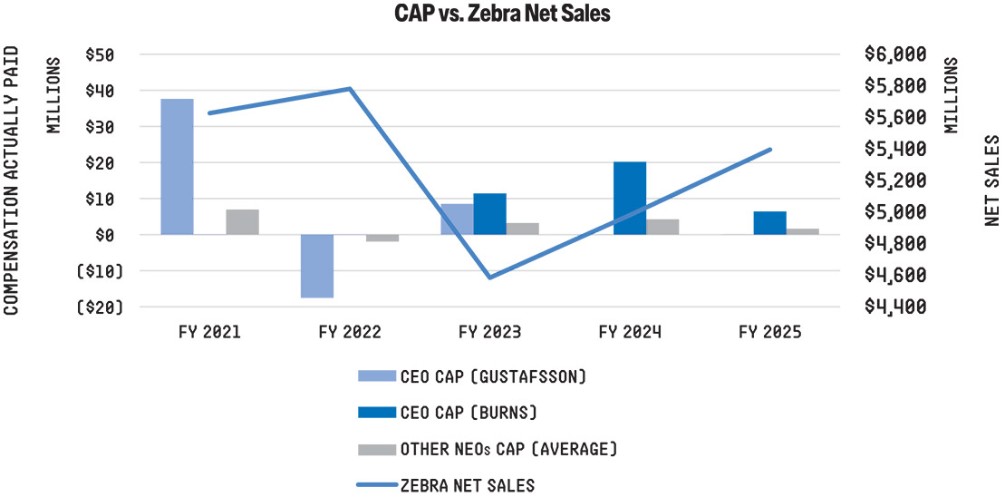
Compensation Actually Paid vs Zebra Net Sales (Company Selected Measure)
Zebra uses Net Sales as a metric under its ZIP and Net Sales CAGR as a metric for performance-vested restricted stock, and CAP for the CEO and other NEOs generally aligns with Zebra’s Net Sales over the 2021-2025 period. As indicated below, with a higher growth in Net Sales from 2023 through 2025, CAP for the CEO and Other NEOs in 2024 increased relative to each respective year’s prior year CAP. When Net Sales growth declined or slowed from 2022 through 2023, the CEO and Other NEO CAP amounts declined or increased at a more modest rate.
Cumulative TSR Comparison
As shown in the chart below, the Company’s five-year cumulative Total Shareholder Return (“TSR”) is less than the companies included in our industry index.
The following chart shows Cumulative TSR and reflects the values of $100 invested in Zebra common stock and Cumulative Peer Group TSR on December 31, 2020 as of December 31 of each subsequent year, assuming the reinvestment of dividends. The Cumulative Peer Group TSR is market-cap weighted and reflects the TSR for S&P Information Technology Index, which is the peer group that Zebra uses for its industry comparators/index in its Form 10- K.
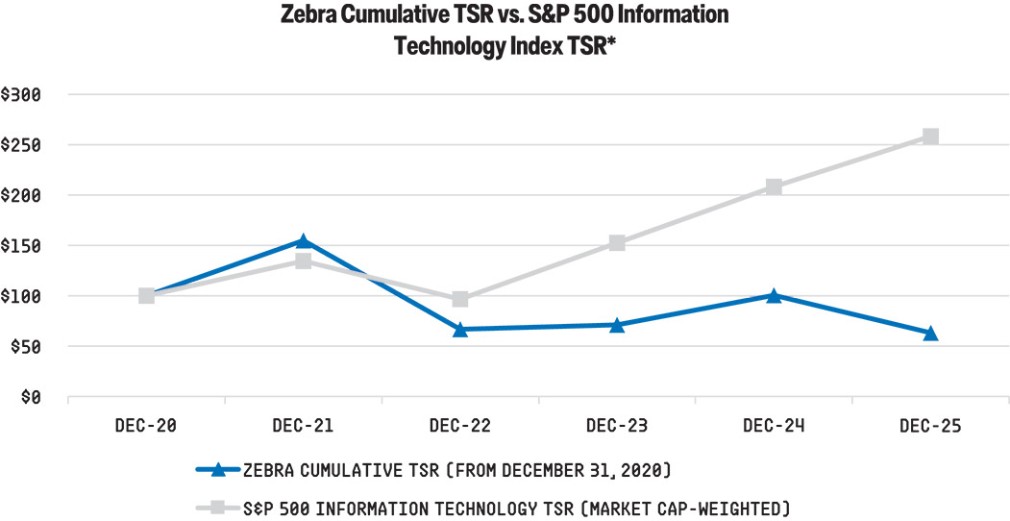
* | $100 invested on 12/31/2020 in stock or index, including reinvestment of dividends. Fiscal year ending December 31. |
| Indexed TSR | |||
| Zebra | | Cumulative Peer | |
Cumulative TSR | Group TSR | |||
Year | | ($) | ($) | |
2025 |
| 63.18 | 258.38 | |
2024 |
| 100.49 | 208.30 | |
2023 |
| 71.12 |
| 152.48 |
2022 |
| 66.72 |
| 96.60 |
2021 |
| 154.87 |
| 134.53 |
Most Important Performance Measures | |
✓ Adjusted EBITDA | ✓ Net Sales |
✓ Adjusted EBITDA Margin | ✓ Net Sales Compound Annual Growth Rate (CAGR) |
✓ Strategic Growth Index | ✓ Free Cash Flow Conversion |