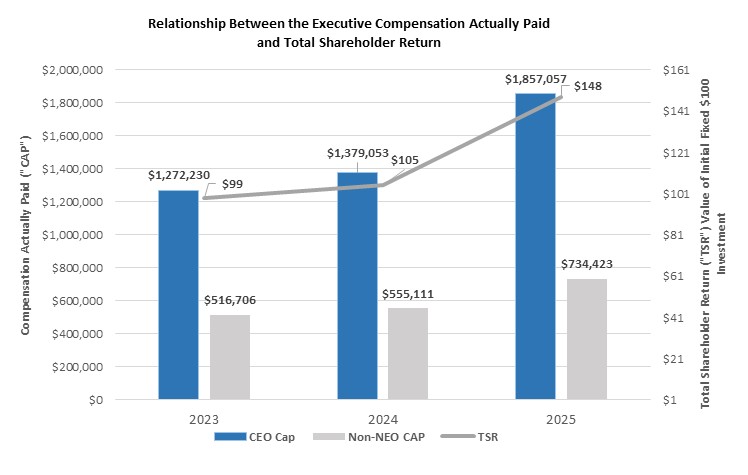
The following table summarizes the total compensation paid to our CEO and Other NEOs versus the performance of the Company for the fiscal years ended December 31, 2025, 2024 and 2023.
|
Year (a)(1) |
Summary Compensation Total for CEO ($) (b)(2)(3) |
Compensation Actually Paid to CEO ($) (c)(2)(4) |
Average Summary Compensation Total for Other NEOs ($) (d)(2)(5) |
Average Compensation Actually paid to Other NEOs ($) (e)(2)(4) |
Value of Initial Fixed $100 Investment Based on Total Shareholder Return ($) (f)(6) |
Net Income ($)(g)(7) |
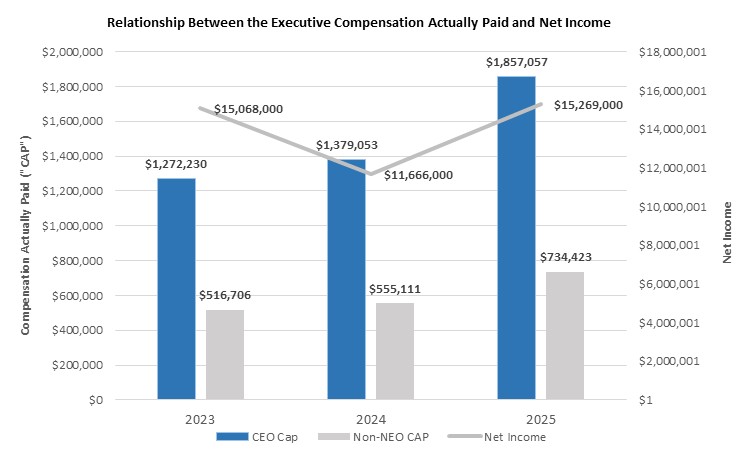
| 2025 | 1,859,294 | 1,857,057 | 729,472 | 734,423 | 147.81 | 15,269,000 |
| 2024 | 1,494,165 | 1,379,053 | 595,242 | 555,111 | 104.89 | 11,666,000 |
| 2023 | 1,416,019 | 1,272,230 | 566,602 | 516,706 | 98.93 | 15,068,000 |
| (1) | As a smaller reporting company, the Company is required to provide information for the prior three completed fiscal years. |
| (2) | For all years presented our CEO was James C. Hagan and our Other NEOs consisted of Allen J. Miles, III, and Guida R. Sajdak. |
| (3) | Column (b) shows the amount for the CEO included in the Summary Compensation Table. |
| (4) | Columns (c) and (e) show the total compensation paid to the Company’s CEO and average compensation paid to the Other NEOs, respectively, for the applicable years adjusted by changes in equity award values. The following table sets forth the adjustments made to the amounts disclosed in columns (c) and (e) to arrive at compensation “actually paid” to our CEO and Other NEOs during each of the years disclosed: |
| 2025 | 2024 | 2023 | ||||
|
CEO ($) |
Other NEOs ($) |
CEO ($) |
Other NEOs ($) |
CEO ($) |
Other NEOs ($) |
|
| Summary Compensation Table Total | 1,859,294 | 729,472 | 1,494,165 | 595,242 | 1,416,019 | 566,602 |
| Adjustments to determine compensation “actually paid” for CEO and Other NEOs | ||||||
| Deduction for amounts reported under the “Stock Awards” column in the Summary Compensation Table | (288,319) | (99,222) | (261,936) | (91,006) | (247,112) | (86,676) |
| Increase for fair value of awards granted during the year that remain unvested as of year-end (8) | 253,657 | 87,296 | 95,744 | 33,263 | 75,330 | 26,420 |
| Increase for fair value of awards granted during the year that vested during year | 65,208 | 22,438 | 47,868 | 16,634 | 37,107 | 13,019 |
| Increase (decrease) for change in fair value from prior year-end to current year-end of awards granted prior to year that were outstanding and unvested as of year-end | 23,136 | 8,036 | 2,302 | 707 | (11,526) | (3,628) |
| Increase for change in fair value from prior year-end to vesting date of awards granted prior to year that vested during the year | 8,708 | 4,620 | 910 | 271 | 2,412 | 969 |
| Decrease for change in fair value from prior year-end to vesting date of awards granted prior to year that were forfeited during the year | (64,627) | (18,217) | ||||
| Total Adjustments to Summary Compensation | (2,237) | 4,951 | (115,112) | (40,131) | (143,789) | (49,896) |
| Total Compensation Actually Paid | 1,857,057 | 734,423 | 1,379,053 | 555,111 | 1,272,230 | 516,706 |
| (5) | Column (d) shows the average amount of the total compensation shown in the Summary Compensation Table for the Other NEOs for the applicable years. |
| (6) | The calculation for each year is based on a fixed investment of $100 from the market close on the last trading day before the earliest year in the pay versus performance table through the end of each applicable year in the table, assuming reinvestment of dividends. The calculation begins on December 31, 2022, and, in the third year, extends through December 31, 2025. |
| (7) | Column (g) provides the Company’s net income for each year. |
| (8) | The increase in fair value of awards granted during the year and unvested as of year-end for 2025 reflects the estimated value of performance-based shares to be earned under the Company’s 2025 LTI over the three-year performance period based on performance over the first-year ending December 31, 2025. |
| (2) | For all years presented our CEO was James C. Hagan and our Other NEOs consisted of Allen J. Miles, III, and Guida R. Sajdak. |
| (4) | Columns (c) and (e) show the total compensation paid to the Company’s CEO and average compensation paid to the Other NEOs, respectively, for the applicable years adjusted by changes in equity award values. The following table sets forth the adjustments made to the amounts disclosed in columns (c) and (e) to arrive at compensation “actually paid” to our CEO and Other NEOs during each of the years disclosed: |
| 2025 | 2024 | 2023 | ||||
|
CEO ($) |
Other NEOs ($) |
CEO ($) |
Other NEOs ($) |
CEO ($) |
Other NEOs ($) |
|
| Summary Compensation Table Total | 1,859,294 | 729,472 | 1,494,165 | 595,242 | 1,416,019 | 566,602 |
| Adjustments to determine compensation “actually paid” for CEO and Other NEOs | ||||||
| Deduction for amounts reported under the “Stock Awards” column in the Summary Compensation Table | (288,319) | (99,222) | (261,936) | (91,006) | (247,112) | (86,676) |
| Increase for fair value of awards granted during the year that remain unvested as of year-end (8) | 253,657 | 87,296 | 95,744 | 33,263 | 75,330 | 26,420 |
| Increase for fair value of awards granted during the year that vested during year | 65,208 | 22,438 | 47,868 | 16,634 | 37,107 | 13,019 |
| Increase (decrease) for change in fair value from prior year-end to current year-end of awards granted prior to year that were outstanding and unvested as of year-end | 23,136 | 8,036 | 2,302 | 707 | (11,526) | (3,628) |
| Increase for change in fair value from prior year-end to vesting date of awards granted prior to year that vested during the year | 8,708 | 4,620 | 910 | 271 | 2,412 | 969 |
| Decrease for change in fair value from prior year-end to vesting date of awards granted prior to year that were forfeited during the year | (64,627) | (18,217) | ||||
| Total Adjustments to Summary Compensation | (2,237) | 4,951 | (115,112) | (40,131) | (143,789) | (49,896) |
| Total Compensation Actually Paid | 1,857,057 | 734,423 | 1,379,053 | 555,111 | 1,272,230 | 516,706 |
The following chart compares the compensation actually paid to our CEO and the average of the compensation actually paid to our other Non-NEOs with net income.
As described in more detail in the “Compensation Components” section of this Proxy Statement beginning on page 31, the Company’s executive compensation program includes variable components in the form of annual short-term incentive cash compensation based upon the Company’s financial performance. Compensation decisions at the Company are made independently of SEC disclosure requirements. While the Company utilizes several performance measures to align executive compensation with the Company’s performance, all of those measures are not presented in the “Pay Versus Performance Table.” Moreover, the Company generally seeks to incentivize long-term performance and, therefore, does not specifically align the Company’s performance measures with compensation that is actually paid (as computed in accordance with Item 402(v) of SEC Regulation S-K) for a particular year.
| (8) | The increase in fair value of awards granted during the year and unvested as of year-end for 2025 reflects the estimated value of performance-based shares to be earned under the Company’s 2025 LTI over the three-year performance period based on performance over the first-year ending December 31, 2025. |
| [1] | As a smaller reporting company, the Company is required to provide information for the prior three completed fiscal years. |
| [2] | Column (b) shows the amount for the CEO included in the Summary Compensation Table. |
| [3] | For all years presented our CEO was James C. Hagan and our Other NEOs consisted of Allen J. Miles, III, and Guida R. Sajdak. |
| [4] | Columns (c) and (e) show the total compensation paid to the Company’s CEO and average compensation paid to the Other NEOs, respectively, for the applicable years adjusted by changes in equity award values. The following table sets forth the adjustments made to the amounts disclosed in columns (c) and (e) to arrive at compensation “actually paid” to our CEO and Other NEOs during each of the years disclosed: |
| [5] | Column (d) shows the average amount of the total compensation shown in the Summary Compensation Table for the Other NEOs for the applicable years. |
| [6] | The calculation for each year is based on a fixed investment of $100 from the market close on the last trading day before the earliest year in the pay versus performance table through the end of each applicable year in the table, assuming reinvestment of dividends. The calculation begins on December 31, 2022, and, in the third year, extends through December 31, 2025. |
| [7] | Column (g) provides the Company’s net income for each year. |
| [8] | The increase in fair value of awards granted during the year and unvested as of year-end for 2025 reflects the estimated value of performance-based shares to be earned under the Company’s 2025 LTI over the three-year performance period based on performance over the first-year ending December 31, 2025. |