Pay vs Performance Disclosure
Dec. 31, 2025
USD ($)
$ / shares
Dec. 31, 2024
USD ($)
$ / shares
Dec. 31, 2023
USD ($)
$ / shares
Dec. 31, 2022
USD ($)
$ / shares
Dec. 31, 2021
USD ($)
$ / shares
PAY VERSUS PERFORMANCE
The following table reports the compensation of our Principal Executive Officer (PEO), and the average compensation of our other Named Executive Officers (Other NEOs) as reported in the Summary Compensation Table for the past five fiscal years, as well as their “compensation actually paid” as calculated pursuant to SEC rules and certain performance measures required by such rules.
Year | Summary Compensation Table Total Compensation for PEO ($)(1) | Compensation Actually Paid to PEO ($)(2) | Average Summary Compensation Table Total Compensation for Other NEOs ($)(3) | Average Compensation Actually Paid to Other NEOs ($)(2) | Value of Initial Fixed $100 Investment Based On: | Net Income(5) (millions) ($) | Core EPS ($) | |||||||||||||||||||||||||
Carl H. Lindner III | S. Craig Lindner | Carl H. Lindner III | S. Craig Lindner | Total Shareholder Return ($) | Peer Group(4) Total Shareholder Return ($) | |||||||||||||||||||||||||||
2025 | 11,042,543 | 11,148,296 | 11,330,815 | 11,436,568 | 3,172,454 | 3,341,827 | 260.78 | 228.84 | 842 | 10.29 | ||||||||||||||||||||||
2024 | 11,570,059 | 11,545,807 | 12,918,695 | 12,894,443 | 3,038,664 | 3,609,210 | 247.28 | 209.20 | 887 | 10.75 | ||||||||||||||||||||||
2023 | 9,844,148 | 9,914,566 | 9,311,061 | 9,381,479 | 2,919,108 | 2,775,585 | 199.86 | 154.70 | 852 | 10.56 | ||||||||||||||||||||||
2022 | 12,670,399 | 12,637,868 | 13,456,927 | 13,424,396 | 2,854,120 | 3,133,065 | 216.22 | 139.69 | 898 | 11.63 | ||||||||||||||||||||||
2021 | 12,449,582 | 12,341,739 | 16,851,687 | 16,743,844 | 2,639,597 | 4,137,031 | 194.78 | 117.51 | 1,995 | 11.59 | ||||||||||||||||||||||
(1) | For 2021 through 2025, our PEOs were the Co-CEOs, Carl H. Lindner III and S. Craig Lindner. The dollar amounts reported in this column are the amounts of total compensation reported for the Co-CEOs for each corresponding year in the “Total” column of the Summary Compensation Table. |
(2) | “Compensation actually paid” to our Co-CEOs and Other NEOs in each of 2025, 2024, 2023, 2022 and 2021 reflects the respective amounts set forth in the “Total” column of the Summary Compensation Table, as adjusted as set forth in the table below (dollars in thousands), in accordance with SEC rules. The dollar amounts reflected in the “Total” column of the Summary Compensation Table and above do not reflect the actual amount of compensation earned by or paid to our Co-CEOs and Other NEOs during the applicable year. For information regarding the decisions made by our management and Compensation Committee in regards to the NEO compensation for each fiscal year, please see the Compensation Discussion & Analysis section of this proxy statement. |
Covered Year | 2025 | 2024 | 2023 | 2022 | 2021 | ||||||||||||||||||||||||||||||||||||||||||
Carl H. Lindner III ($) | S. Craig Lindner ($) | Non-PEO NEOs Average ($) | Carl H. Lindner III ($) | S. Craig Lindner ($) | Non-PEO NEOs Average ($) | Carl H. Lindner III ($) | S. Craig Lindner ($) | Non-PEO NEOs Average ($) | Carl H. Lindner III ($) | S. Craig Lindner ($) | Non-PEO NEOs Average ($) | Carl H. Lindner III ($) | S. Craig Lindner ($) | Non-PEO NEOs Average ($) | |||||||||||||||||||||||||||||||||
Summary Compensation Table “Total” | 11,042.5 | 11,148.3 | 3,172.5 | 11,570.1 | 11,545.8 | 3,038.7 | 9,844.1 | 9,914.6 | 2,919.1 | 12,670.4 | 12,637.9 | 2,854.1 | 12,449.6 | 12,341.7 | 2,639.6 | ||||||||||||||||||||||||||||||||
Less: Stock Award Values Reported in Summary Compensation Table for Covered Year | (1,500.0) | (1,500.0) | (643.8) | (1,500.0) | (1,500.0) | (626.3) | (1,500.1) | (1,500.1) | (1,066.4) | (1,500.1) | (1,500.1) | (592.6) | (1,500.1) | (1,500.1) | (538.8) | ||||||||||||||||||||||||||||||||
Plus: Fair Value of Stock Awards Granted in Covered Year | 1,682.0 | 1,682.0 | 721.9 | 1,627.0 | 1,627.0 | 679.3 | 1,349.3 | 1,349.3 | 1,018.1 | 1,537.5 | 1,537.5 | 607.4 | 1,853.5 | 1,853.5 | 665.8 | ||||||||||||||||||||||||||||||||
Change in Fair Value of Outstanding Unvested Stock and Option Awards from Prior Years | (8.6) | (8.6) | (4.3) | 650.3 | 650.3 | 292.5 | (718.8) | (718.8) | (210.0) | (1.7) | (1.7) | (0.6) | 2,126.9 | 2,126.9 | 718.0 | ||||||||||||||||||||||||||||||||
Change in Fair Value of Stock and Option Awards from Prior Years that Vested in Covered Year | (226.3) | (226.3) | (67.0) | 111.4 | 111.4 | 29.1 | (89.5) | (89.5) | (22.8) | (25.9) | (25.9) | (8.2) | 341.1 | 341.1 | 110.9 | ||||||||||||||||||||||||||||||||
Dividends Paid during Covered Year on Unvested Stock Awards | 341.2 | 341.2 | 162.5 | 460.0 | 460.0 | 195.9 | 425.9 | 425.9 | 137.4 | 776.7 | 776.7 | 273.0 | 1,580.8 | 1,580.8 | 541.6 | ||||||||||||||||||||||||||||||||
Compensation Actually Paid | 11,330.8 | 11,436.6 | 3,341.8 | 12,918.7 | 12,894.4 | 3,609.2 | 9,311.1 | 9,381.5 | 2,775.6 | 13,456.9 | 13,424.4 | 3,133.1 | 16,851.7 | 16,743.8 | 4,137.0 | ||||||||||||||||||||||||||||||||
(3) | For 2025, 2024 and 2023, the Other NEOs were John B. Berding, Brian S. Hertzman, David L. Thompson and Mark A. Weiss. For 2022, the Other NEOs were John B. Berding, Brian S. Hertzman, Vito C. Peraino and David L. Thompson. For 2021, the Other NEOs were John B. Berding, Michelle A. Gillis, Brian S. Hertzman and Vito C. Peraino. |
(4) | For the relevant fiscal year, the dollar amounts reported represent the cumulative total shareholder return (TSR) of the S&P 500 Property & Casualty Index (“Peer Group TSR”) for the measurement periods ending on December 31 of each of 2025, 2024, 2023, 2022 and 2021, respectively. |
(5) | The dollar amounts reported represent the amount of net income (loss) reflected in our consolidated audited financial statements in the Company’s Annual Reports on Form 10-K for each of the years ended December 31, 2025, 2024, 2023, 2022 and 2021, respectively. |
(1) | For 2021 through 2025, our PEOs were the Co-CEOs, Carl H. Lindner III and S. Craig Lindner. The dollar amounts reported in this column are the amounts of total compensation reported for the Co-CEOs for each corresponding year in the “Total” column of the Summary Compensation Table. |
(3) | For 2025, 2024 and 2023, the Other NEOs were John B. Berding, Brian S. Hertzman, David L. Thompson and Mark A. Weiss. For 2022, the Other NEOs were John B. Berding, Brian S. Hertzman, Vito C. Peraino and David L. Thompson. For 2021, the Other NEOs were John B. Berding, Michelle A. Gillis, Brian S. Hertzman and Vito C. Peraino. |
(4) | For the relevant fiscal year, the dollar amounts reported represent the cumulative total shareholder return (TSR) of the S&P 500 Property & Casualty Index (“Peer Group TSR”) for the measurement periods ending on December 31 of each of 2025, 2024, 2023, 2022 and 2021, respectively. |
(2) | “Compensation actually paid” to our Co-CEOs and Other NEOs in each of 2025, 2024, 2023, 2022 and 2021 reflects the respective amounts set forth in the “Total” column of the Summary Compensation Table, as adjusted as set forth in the table below (dollars in thousands), in accordance with SEC rules. The dollar amounts reflected in the “Total” column of the Summary Compensation Table and above do not reflect the actual amount of compensation earned by or paid to our Co-CEOs and Other NEOs during the applicable year. For information regarding the decisions made by our management and Compensation Committee in regards to the NEO compensation for each fiscal year, please see the Compensation Discussion & Analysis section of this proxy statement. |
Covered Year | 2025 | 2024 | 2023 | 2022 | 2021 | ||||||||||||||||||||||||||||||||||||||||||
Carl H. Lindner III ($) | S. Craig Lindner ($) | Non-PEO NEOs Average ($) | Carl H. Lindner III ($) | S. Craig Lindner ($) | Non-PEO NEOs Average ($) | Carl H. Lindner III ($) | S. Craig Lindner ($) | Non-PEO NEOs Average ($) | Carl H. Lindner III ($) | S. Craig Lindner ($) | Non-PEO NEOs Average ($) | Carl H. Lindner III ($) | S. Craig Lindner ($) | Non-PEO NEOs Average ($) | |||||||||||||||||||||||||||||||||
Summary Compensation Table “Total” | 11,042.5 | 11,148.3 | 3,172.5 | 11,570.1 | 11,545.8 | 3,038.7 | 9,844.1 | 9,914.6 | 2,919.1 | 12,670.4 | 12,637.9 | 2,854.1 | 12,449.6 | 12,341.7 | 2,639.6 | ||||||||||||||||||||||||||||||||
Less: Stock Award Values Reported in Summary Compensation Table for Covered Year | (1,500.0) | (1,500.0) | (643.8) | (1,500.0) | (1,500.0) | (626.3) | (1,500.1) | (1,500.1) | (1,066.4) | (1,500.1) | (1,500.1) | (592.6) | (1,500.1) | (1,500.1) | (538.8) | ||||||||||||||||||||||||||||||||
Plus: Fair Value of Stock Awards Granted in Covered Year | 1,682.0 | 1,682.0 | 721.9 | 1,627.0 | 1,627.0 | 679.3 | 1,349.3 | 1,349.3 | 1,018.1 | 1,537.5 | 1,537.5 | 607.4 | 1,853.5 | 1,853.5 | 665.8 | ||||||||||||||||||||||||||||||||
Change in Fair Value of Outstanding Unvested Stock and Option Awards from Prior Years | (8.6) | (8.6) | (4.3) | 650.3 | 650.3 | 292.5 | (718.8) | (718.8) | (210.0) | (1.7) | (1.7) | (0.6) | 2,126.9 | 2,126.9 | 718.0 | ||||||||||||||||||||||||||||||||
Change in Fair Value of Stock and Option Awards from Prior Years that Vested in Covered Year | (226.3) | (226.3) | (67.0) | 111.4 | 111.4 | 29.1 | (89.5) | (89.5) | (22.8) | (25.9) | (25.9) | (8.2) | 341.1 | 341.1 | 110.9 | ||||||||||||||||||||||||||||||||
Dividends Paid during Covered Year on Unvested Stock Awards | 341.2 | 341.2 | 162.5 | 460.0 | 460.0 | 195.9 | 425.9 | 425.9 | 137.4 | 776.7 | 776.7 | 273.0 | 1,580.8 | 1,580.8 | 541.6 | ||||||||||||||||||||||||||||||||
Compensation Actually Paid | 11,330.8 | 11,436.6 | 3,341.8 | 12,918.7 | 12,894.4 | 3,609.2 | 9,311.1 | 9,381.5 | 2,775.6 | 13,456.9 | 13,424.4 | 3,133.1 | 16,851.7 | 16,743.8 | 4,137.0 | ||||||||||||||||||||||||||||||||
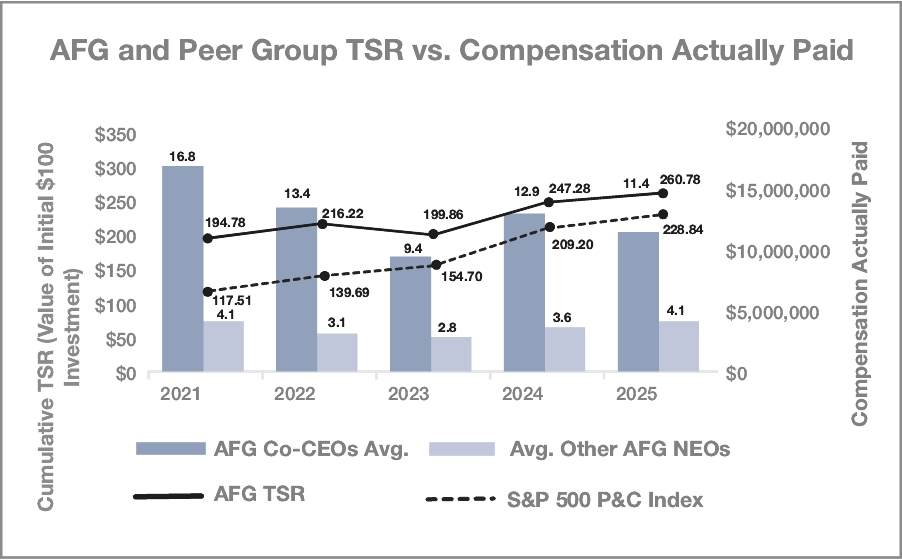
Relationship Between Compensation Actually Paid to our Co-CEOs and the Average of the Compensation Actually Paid to the Other NEOs and the Company’s Cumulative TSR and Comparison of Company’s Cumulative TSR and Peer Group TSR.
The table below reflects the relationship between the “compensation actually paid” for the Company’s Co-CEOs and the average Other NEOs versus the Company’s TSR and the peer group TSR, assuming an initial fixed investment of $100 for the years ended December 31, 2025, 2024, 2023, 2022 and 2021.
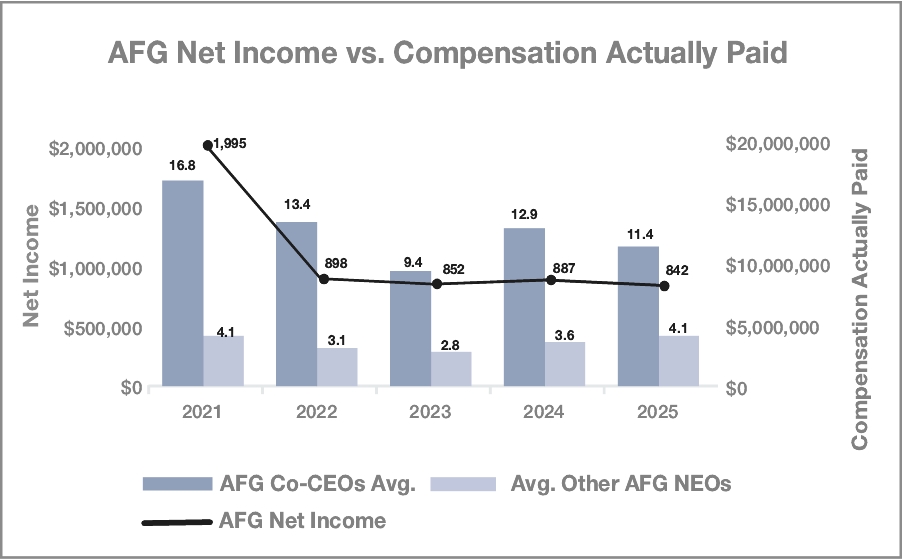
Relationship Between Compensation Actually Paid to our Co-CEOs and the Average of the Compensation Actually Paid to the Other NEOs and the Company’s Net Income.
The table below reflects the relationship between the “compensation actually paid” for the Company’s Co-CEOs and the average Other NEOs versus the Company’s Net Income (in thousands) for the years ended December 31, 2025, 2024, 2023, 2022 and 2021. Net income for 2021 includes the sale of the annuity business to Massachusetts Mutual Life Insurance Company for approximately $3.5 billion of after-tax proceeds.
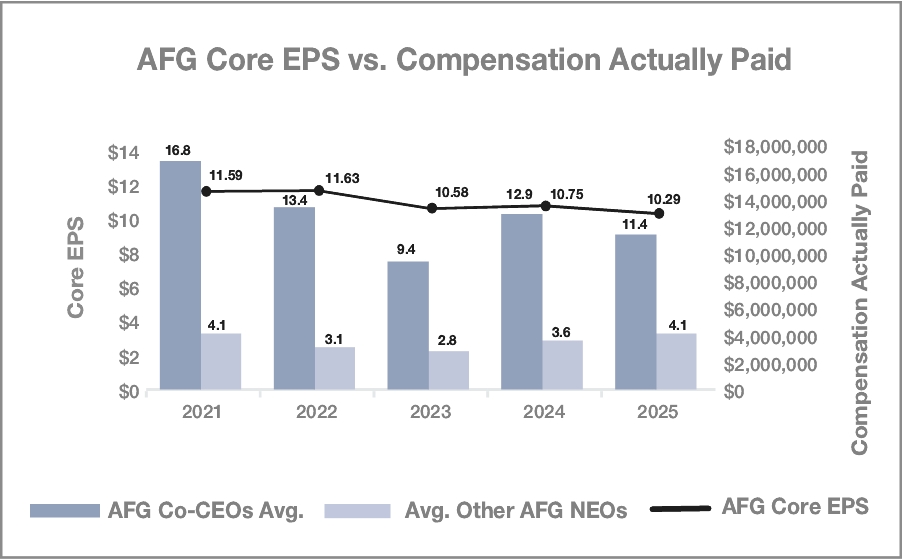
Relationship Between Compensation Actually Paid to our Co-CEOs and the Average of the Compensation Actually Paid to the Other NEOs and the Company’s Core Earnings Per Share.
The table below reflects the relationship between the “compensation actually paid” for the Company’s Co-CEOs and the average Other NEOs versus the Company’s Core EPS for the years ended December 31, 2025, 2024, 2023, 2022 and 2021.
Relationship Between Compensation Actually Paid to our Co-CEOs and the Average of the Compensation Actually Paid to the Other NEOs and the Company’s Cumulative TSR and Comparison of Company’s Cumulative TSR and Peer Group TSR.
The table below reflects the relationship between the “compensation actually paid” for the Company’s Co-CEOs and the average Other NEOs versus the Company’s TSR and the peer group TSR, assuming an initial fixed investment of $100 for the years ended December 31, 2025, 2024, 2023, 2022 and 2021.
The most important financial performance measures that link “compensation actually paid” to named executive officers in the applicable year to Company performance are listed below. For a description of these financial measures, see pages 45-52.
Most Important Performance Measures | ||
Core Earnings per Share | ||
Book Value per Share Growth vs. Industry Companies One Year and Three Year | ||
Core Return on Equity One Year and Three Year | ||