Pay vs Performance Disclosure - USD ($)
May 25, 2022
Dec. 31, 2022
Dec. 31, 2025
Dec. 31, 2024
Dec. 31, 2023
Dec. 31, 2022
Dec. 31, 2021
Pay versus Performance Table
In accordance with the SEC’s PVP rules, the following table sets forth the compensation for the principal executive officer (“PEO”) and the average compensation for the other NEOs, both as reported in the 2025 Summary Compensation Table (“SCT”) above in this Proxy Statement and with certain adjustments to reflect the CAP to such individuals, for each of 2025, 2024, 2023, 2022, and 2021. The table also provides information on the Company cumulative TSR, the cumulative TSR of the Company’s peer group, GAAP Net Income and Adjusted EBITDA.
Year(1) |
Summary Compensation Table Total for PEO |
Compensation Actually Paid to PEO(2)(3)(4) |
Average Summary Compensation Table Total for Non-PEO NEOs |
Average Compensation Actually Paid to Non-PEO NEOs(2)(3)(4) |
Value of Initial Fixed $100 Investment Based on: |
GAAP Net Income ($M)(6) |
Adjusted EBITDA (SM)(7) |
|||||||||||||||||||||||||||||||||
Shavel |
Stephenson |
Shavel |
Stephenson |
Verisk TSR (f) |
Peer Group TSR (5) (g) |
|||||||||||||||||||||||||||||||||||
(a) |
(b) |
(b) |
(c) |
(c) |
(d) |
(e) |
(h) |
(i) |
||||||||||||||||||||||||||||||||
2025 |
$ | 13,540,847 | N/A | $ | 6,493,547 | N/A | $ | 3,275,092 | $ | 1,086,690 | $ | 111.27 | $ | 130.80 | $ | 908 | $ | 1,727 | ||||||||||||||||||||||
2024 |
$ | 12,074,727 | N/A | $ | 21,282,096 | N/A | $ | 3,163,867 | $ | 4,834,504 | $ | 136.07 | $ | 138.91 | $ | 958 | $ | 1,576 | ||||||||||||||||||||||
2023 |
$ | 10,366,566 | N/A | $ | 21,717,026 | N/A | $ | 3,090,834 | $ | 5,238,100 | $ | 117.30 | $ | 121.50 | $ | 614 | $ | 1,433 | ||||||||||||||||||||||
2022 |
$ | 9,497,341 | $ | 11,539,051 | $ | 6,732,273 | ($ | 6,332,839 | ) | $ | 4,134,272 | $ | 2,547,625 | $ | 86.10 | $ | 92.96 | $ | 954 | $ | 1,285 | |||||||||||||||||||
2021 |
N/A | $ | 12,796,321 | N/A | $ | 16,416,053 | $ | 3,207,448 | $ | 3,917,525 | $ | 110.85 | $ | 117.32 | $ | 666 | $ | 1,248 | ||||||||||||||||||||||
| 1) | Scott G. Stephenson was the PEO in 2021 and from January 1, 2022 through his retirement on May 25, 2022. Beginning on May 25, 2022, Lee M. Shavel was the PEO. For 2025, the non-PEO NEOs included Elizabeth D. Mann, Nick Daffan, Kathy Card Beckles and Sunita Holzer. For 2024, the non-PEO NEOs included Elizabeth D. Mann, Nick Daffan, Kathy Card Beckles and Sunita Holzer. For 2023, the non-PEO NEOs included Elizabeth D. Mann, Nick Daffan, Kathy Card Beckles and Sunita Holzer. For 2022, the non-PEO NEOs included Elizabeth D. Mann, Nick Daffan, Kathy Card Beckles and Mark V. Anquillare. For 2021, the non-PEO NEOs included Lee M. Shavel, Nick Daffan, Kathy Card Beckles and Mark V. Anquillare. |
| (2) | SEC rules require certain adjustments be made to the amounts reported in the Summary Compens ation Table to determine CAP, as reported in the PVP table above. The following tables detail the applicable adjustments that were made to determine CAP by deducting and adding the following amounts from the “Total” column of the Summary Compensation Table and does not reflect the actual amounts of compensation earned by or paid to such NEOs during the applicable year. |
PEO SCT Total to CAP Reconciliation |
2025 |
2024 |
2023 |
2022 |
2021 |
|||||||||||||||||||
Shavel |
Shavel |
Shavel |
Stephenson |
Shavel |
Stephenson |
|||||||||||||||||||
Summary Compensation Table Total |
$ |
13,540,847 |
$ |
12,074,727 |
$ |
10,366,566 |
$ |
11,539,051 |
$ |
9,497,341 |
$ |
12,796,321 |
||||||||||||
Deduction for SCT “Stock Awards” column value |
($ | 8,800,086 | ) ($ | 7,600,135 | ) | ($ | 5,919,999 | ) | ($ | 8,400,001 | ) | ($ | 6,420,689 | ) | ($ | 7,875,006 | ) | |||||||
Deduction for SCT “Option Awards” column value |
($ | 2,199,881 | ) ($ | 1,899,792 | ) | ($ | 1,480,011 | ) | ($ | 2,100,016 | ) | ($ | 1,105,324 | ) | ($ | 2,625,006 | ) | |||||||
Deduction for SCT “Change in Pension Value and Nonqualified Deferred Compensation Earnings” column value |
$ | 0 | $ | 0 | $ | 0 | $ | 0 | $ | 0 | ($ | 98,355 | ) | |||||||||||
Total Deductions from SCT |
($ |
10,999,967 |
) ($ |
9,499,927 |
) |
($ |
7,400,010 |
) |
($ |
10,500,017 |
) |
($ |
7,526,013 |
) |
($ |
10,598,367 |
) | |||||||
Increase for service cost and prior service cost for pension plans |
$ | 0 | $ | 0 | $ | 0 | $ | 0 | $ | 0 | $ | 0 | ||||||||||||
Increase for year-end fair value of unvested equity granted during the year |
$ | 6,991,830 | $ | 12,058,835 | $ | 11,356,589 | $ | 2,686,913 | $ | 7,539,174 | $ | 14,021,396 | ||||||||||||
Increase /(deduction) for change in fair value of unvested equity granted in prior years |
($ | 5,694,024 | ) | $ | 5,516,920 | $ | 6,371,264 | ($ | 3,245,127 | ) | ($ | 1,743,448 | ) | $ | 2,539,694 | |||||||||
Increase for vesting date fair value of equity granted and vested during the year |
$ | 0 | $ | 0 | $ | 0 | $ | 1,751,269 | $ | 0 | $ | 0 | ||||||||||||
Increase /(deduction) for change in fair value of vested equity granted in prior years |
$ | 2,654,861 | $ | 1,131,542 | $ | 1,022,617 | ($ | 8,564,927 | ) | ($ | 1,034,781 | ) | ($ | 2,342,991 | ) | |||||||||
Increase based on value of dividends not otherwise reflected in fair value or total compensation |
$ | 0 | $ | 0 | $ | 0 | $ | 0 | $ | 0 | $ | 0 | ||||||||||||
Total Adjustments |
$ |
3,952,667 |
$ |
18,707,296 |
$ |
18,750,470 |
($ |
7,371,873 |
) |
$ |
4,760,945 |
$ |
14,218,099 |
|||||||||||
Compensation Actually Paid (SCT minus deductions plus total adjustments) |
$ |
6,493,547 |
$ |
21,282,096 |
$ |
21,717,026 |
($ |
6,332,839 |
) |
$ |
6,732,273 |
$ |
16,416,053 |
|||||||||||
Pay Versus Performance
Average Non-PEO NEO SCT Total to CAP Reconciliation |
2025 |
2024 |
2023 |
2022 |
2021 |
|||||||||||||||
Summary Compensation Table Total |
$ |
3,275,092 |
$ |
3,163,867 |
$ |
3,090,834 |
$ |
4,134,272 |
$ |
3,207,448 |
||||||||||
Deduction for SCT “Stock Awards” column value |
($ | 1,589,919 | ) | ($ | 1,534,981 | ) | ($ | 1,309,988 | ) | ($ | 2,690,771 | ) | ($ | 1,520,386 | ) | |||||
Deduction for SCT “Option Awards” column value |
($ | 397,587 | ) | ($ | 383,749 | ) | ($ | 327,511 | ) | ($ | 297,717 | ) | ($ | 425,107 | ) | |||||
Deduction for SCT “Change in Pension Value and Nonqualified Deferred Compensation Earnings” column value |
($ | 982 | ) | ($ | 2,677 | ) | $ | 0 | $ | 0 | ($ | 58,174 | ) | |||||||
Total Deductions from SCT |
($ |
1,988,487 |
) |
($ |
1,921,406 |
) |
($ |
1,637,499 |
) |
($ |
2,988,488 |
) |
($ |
2,003,667 |
) | |||||
Increase for service cost and prior service cost for pension plans |
$ | 0 | $ | 0 | $ | 0 | $ | 0 | $ | 0 | ||||||||||
Increase for year-end fair value of unvested equity granted during the year |
$ | 1,263,259 | $ | 2,435,580 | $ | 2,513,010 | $ | 2,821,246 | $ | 2,587,735 | ||||||||||
Increase /(deduction) for change in fair value of unvested equity granted in prior years |
($ | 1,166,605 | ) | $ | 608,136 | $ | 947,600 | ($ | 835,414 | ) | $ | 551,657 | ||||||||
Increase for vesting date fair value of equity granted and vested during the year |
$ | 0 | $ | 0 | $ | 0 | $ | 0 | $ | 0 | ||||||||||
Increase /(deduction) for change in fair value of vested equity granted in prior years |
($ | 296,569 | ) | $ | 548,328 | $ | 324,155 | ($ | 583,991 | ) | ($ | 425,648 | ) | |||||||
Increase based on value of dividends not otherwise reflected in fair value or total compensation |
$ | 0 | $ | 0 | $ | 0 | $ | 0 | $ | 0 | ||||||||||
Total Adjustments |
($ |
199,915 |
) |
$ |
3,592,043 |
$ |
3,784,765 |
$ |
1,401,841 |
$ |
2,713,744 |
|||||||||
Compensation Actually Paid (SCT minus deductions plus total adjustments) |
$ |
1,086,690 |
$ |
4,834,504 |
$ |
5,238,100 |
$ |
2,547,625 |
$ |
3,917,525 |
||||||||||
| (3) | The fair value of PSUs reporting for CAP purposes in columns (c) and (e) assumes estimated performance results as of the end of each fiscal year for internal metrics (i.e., EBITDA & ROIC) and Monte Carlo simulation valuation model for market metrics (i.e., TSR vs. performance peer group), in accordance with FASB ASC 718. PSUs will ultimately vest based on measured performance through the end of the three-year performance period for the relevant metrics. |
| (4) | The fair value of stock option awards reporting for CAP purposes in columns (c) and (e) was determined using the Black-Scholes option pricing model using materially the same assumptions as disclosed at the initial grant. |
| (5) | Reflects the total shareholder return indexed to $100 per share for the sixteen-company peer group we use for executive compensation benchmarking purposes which is also the industry line peer group reported in our Annual Report on Form 10-K for the year ended December 31, 2025. Two companies (FactSet and Guidewire) were added to the peer group from the 2024 Pay versus Performance disclosure. One company in the peer group from the 2023 Pay versus Performance disclosure (Black Knight) is no longer publicly traded and was replaced in the 2024 peer group. Two companies in the peer group from the 2022 Pay versus Performance disclosure (CoreLogic and IHS Markit) are no longer publicly traded and were replaced in the 2023 peer group. The comparable cumulative total shareholder return for the most recent prior peer groups for the periods starting on January 1, 2021 and ending on December 31st of the following years would be: 2021 ($117.18), 2022 ($93.17), 2023 ($121.63), 2024 ($138.78), and 2025 ($131.21). |
| (6) | Reflects “Net Income” for each applicable year as set forth in our Consolidated Statements of Operations included in our Annual Report on Form 10-K for each of the applicable years. |
| (7) | Reflects the Adjusted EBITDA amounts for each applicable year as set forth in our earnings release filed as an exhibit in our Current Report on Form 8-K for each of the applicable years. In 2023, 2024 and 2025, our Talent Management and Compensation Committee used Adjusted EBITDA on an absolute dollar basis, and in years 2021 and 2022 used Adjusted EBITDA year-over-year percentage growth rates, to determine our NEOs STI outcomes. EBITDA represents GAAP Net Income from continuing operations adjusted for (i) depreciation and amortization of fixed assets; (ii) amortization of intangible assets; (iii) interest expense; and (iv) provision for income taxes. Adjusted EBITDA represents EBITDA adjusted for acquisition-related costs (earn-outs), gain/loss from dispositions (which includes businesses held for sale), and nonrecurring gain/loss. Adjusted EBITDA was subject to further normalization by our Talent Management and Compensation Committee in 2023, 2024 and 2025 to eliminate the financial impact of certain items, including, among others, contributions from acquisitions not included in the Company’s budget, the timing of the divestitures, and the impact of foreign currency exchange rate changes. |
non-PEO
NEOs included Elizabeth D. Mann, Nick Daffan, Kathy Card Beckles and Sunita Holzer. For 2024, the non-PEO
NEOs included Elizabeth D. Mann, Nick Daffan, Kathy Card Beckles and Sunita Holzer. For 2023, the non-PEO
NEOs included Elizabeth D. Mann, Nick Daffan, Kathy Card Beckles and Sunita Holzer. For 2022, the non-PEO
NEOs included Elizabeth D. Mann, Nick Daffan, Kathy Card Beckles and Mark V. Anquillare. For 2021, the non-PEO
NEOs included Lee M. Shavel, Nick Daffan, Kathy Card Beckles and Mark V. Anquillare.
10-K
for the year ended December 31, 2025.
| (2) | SEC rules require certain adjustments be made to the amounts reported in the Summary Compens ation Table to determine CAP, as reported in the PVP table above. The following tables detail the applicable adjustments that were made to determine CAP by deducting and adding the following amounts from the “Total” column of the Summary Compensation Table and does not reflect the actual amounts of compensation earned by or paid to such NEOs during the applicable year. |
PEO SCT Total to CAP Reconciliation |
2025 |
2024 |
2023 |
2022 |
2021 |
|||||||||||||||||||
Shavel |
Shavel |
Shavel |
Stephenson |
Shavel |
Stephenson |
|||||||||||||||||||
Summary Compensation Table Total |
$ |
13,540,847 |
$ |
12,074,727 |
$ |
10,366,566 |
$ |
11,539,051 |
$ |
9,497,341 |
$ |
12,796,321 |
||||||||||||
Deduction for SCT “Stock Awards” column value |
($ | 8,800,086 | ) ($ | 7,600,135 | ) | ($ | 5,919,999 | ) | ($ | 8,400,001 | ) | ($ | 6,420,689 | ) | ($ | 7,875,006 | ) | |||||||
Deduction for SCT “Option Awards” column value |
($ | 2,199,881 | ) ($ | 1,899,792 | ) | ($ | 1,480,011 | ) | ($ | 2,100,016 | ) | ($ | 1,105,324 | ) | ($ | 2,625,006 | ) | |||||||
Deduction for SCT “Change in Pension Value and Nonqualified Deferred Compensation Earnings” column value |
$ | 0 | $ | 0 | $ | 0 | $ | 0 | $ | 0 | ($ | 98,355 | ) | |||||||||||
Total Deductions from SCT |
($ |
10,999,967 |
) ($ |
9,499,927 |
) |
($ |
7,400,010 |
) |
($ |
10,500,017 |
) |
($ |
7,526,013 |
) |
($ |
10,598,367 |
) | |||||||
Increase for service cost and prior service cost for pension plans |
$ | 0 | $ | 0 | $ | 0 | $ | 0 | $ | 0 | $ | 0 | ||||||||||||
Increase for year-end fair value of unvested equity granted during the year |
$ | 6,991,830 | $ | 12,058,835 | $ | 11,356,589 | $ | 2,686,913 | $ | 7,539,174 | $ | 14,021,396 | ||||||||||||
Increase /(deduction) for change in fair value of unvested equity granted in prior years |
($ | 5,694,024 | ) | $ | 5,516,920 | $ | 6,371,264 | ($ | 3,245,127 | ) | ($ | 1,743,448 | ) | $ | 2,539,694 | |||||||||
Increase for vesting date fair value of equity granted and vested during the year |
$ | 0 | $ | 0 | $ | 0 | $ | 1,751,269 | $ | 0 | $ | 0 | ||||||||||||
Increase /(deduction) for change in fair value of vested equity granted in prior years |
$ | 2,654,861 | $ | 1,131,542 | $ | 1,022,617 | ($ | 8,564,927 | ) | ($ | 1,034,781 | ) | ($ | 2,342,991 | ) | |||||||||
Increase based on value of dividends not otherwise reflected in fair value or total compensation |
$ | 0 | $ | 0 | $ | 0 | $ | 0 | $ | 0 | $ | 0 | ||||||||||||
Total Adjustments |
$ |
3,952,667 |
$ |
18,707,296 |
$ |
18,750,470 |
($ |
7,371,873 |
) |
$ |
4,760,945 |
$ |
14,218,099 |
|||||||||||
Compensation Actually Paid (SCT minus deductions plus total adjustments) |
$ |
6,493,547 |
$ |
21,282,096 |
$ |
21,717,026 |
($ |
6,332,839 |
) |
$ |
6,732,273 |
$ |
16,416,053 |
|||||||||||
Pay Versus Performance
Average Non-PEO NEO SCT Total to CAP Reconciliation |
2025 |
2024 |
2023 |
2022 |
2021 |
|||||||||||||||
Summary Compensation Table Total |
$ |
3,275,092 |
$ |
3,163,867 |
$ |
3,090,834 |
$ |
4,134,272 |
$ |
3,207,448 |
||||||||||
Deduction for SCT “Stock Awards” column value |
($ | 1,589,919 | ) | ($ | 1,534,981 | ) | ($ | 1,309,988 | ) | ($ | 2,690,771 | ) | ($ | 1,520,386 | ) | |||||
Deduction for SCT “Option Awards” column value |
($ | 397,587 | ) | ($ | 383,749 | ) | ($ | 327,511 | ) | ($ | 297,717 | ) | ($ | 425,107 | ) | |||||
Deduction for SCT “Change in Pension Value and Nonqualified Deferred Compensation Earnings” column value |
($ | 982 | ) | ($ | 2,677 | ) | $ | 0 | $ | 0 | ($ | 58,174 | ) | |||||||
Total Deductions from SCT |
($ |
1,988,487 |
) |
($ |
1,921,406 |
) |
($ |
1,637,499 |
) |
($ |
2,988,488 |
) |
($ |
2,003,667 |
) | |||||
Increase for service cost and prior service cost for pension plans |
$ | 0 | $ | 0 | $ | 0 | $ | 0 | $ | 0 | ||||||||||
Increase for year-end fair value of unvested equity granted during the year |
$ | 1,263,259 | $ | 2,435,580 | $ | 2,513,010 | $ | 2,821,246 | $ | 2,587,735 | ||||||||||
Increase /(deduction) for change in fair value of unvested equity granted in prior years |
($ | 1,166,605 | ) | $ | 608,136 | $ | 947,600 | ($ | 835,414 | ) | $ | 551,657 | ||||||||
Increase for vesting date fair value of equity granted and vested during the year |
$ | 0 | $ | 0 | $ | 0 | $ | 0 | $ | 0 | ||||||||||
Increase /(deduction) for change in fair value of vested equity granted in prior years |
($ | 296,569 | ) | $ | 548,328 | $ | 324,155 | ($ | 583,991 | ) | ($ | 425,648 | ) | |||||||
Increase based on value of dividends not otherwise reflected in fair value or total compensation |
$ | 0 | $ | 0 | $ | 0 | $ | 0 | $ | 0 | ||||||||||
Total Adjustments |
($ |
199,915 |
) |
$ |
3,592,043 |
$ |
3,784,765 |
$ |
1,401,841 |
$ |
2,713,744 |
|||||||||
Compensation Actually Paid (SCT minus deductions plus total adjustments) |
$ |
1,086,690 |
$ |
4,834,504 |
$ |
5,238,100 |
$ |
2,547,625 |
$ |
3,917,525 |
||||||||||
Relationship Between Compensation Actually Paid and Company TSR, and Comparison of Peer TSR versus Company TSR
The following graph sets forth the relationship between “Compensation Actually Paid” to our PEO(s), the average of “Compensation Actually Paid” to our other NEOs, and our Company’s cumulative TSR during the five most recently completed fiscal years, as well as a comparison of the Company’s cumulative TSR over the same period to that of the sixteen-company peer group we use for executive compensation benchmarking purposes which is also the industry line peer group reported in our Annual Report on Form
10-K
for the year ended December 31, 2025. 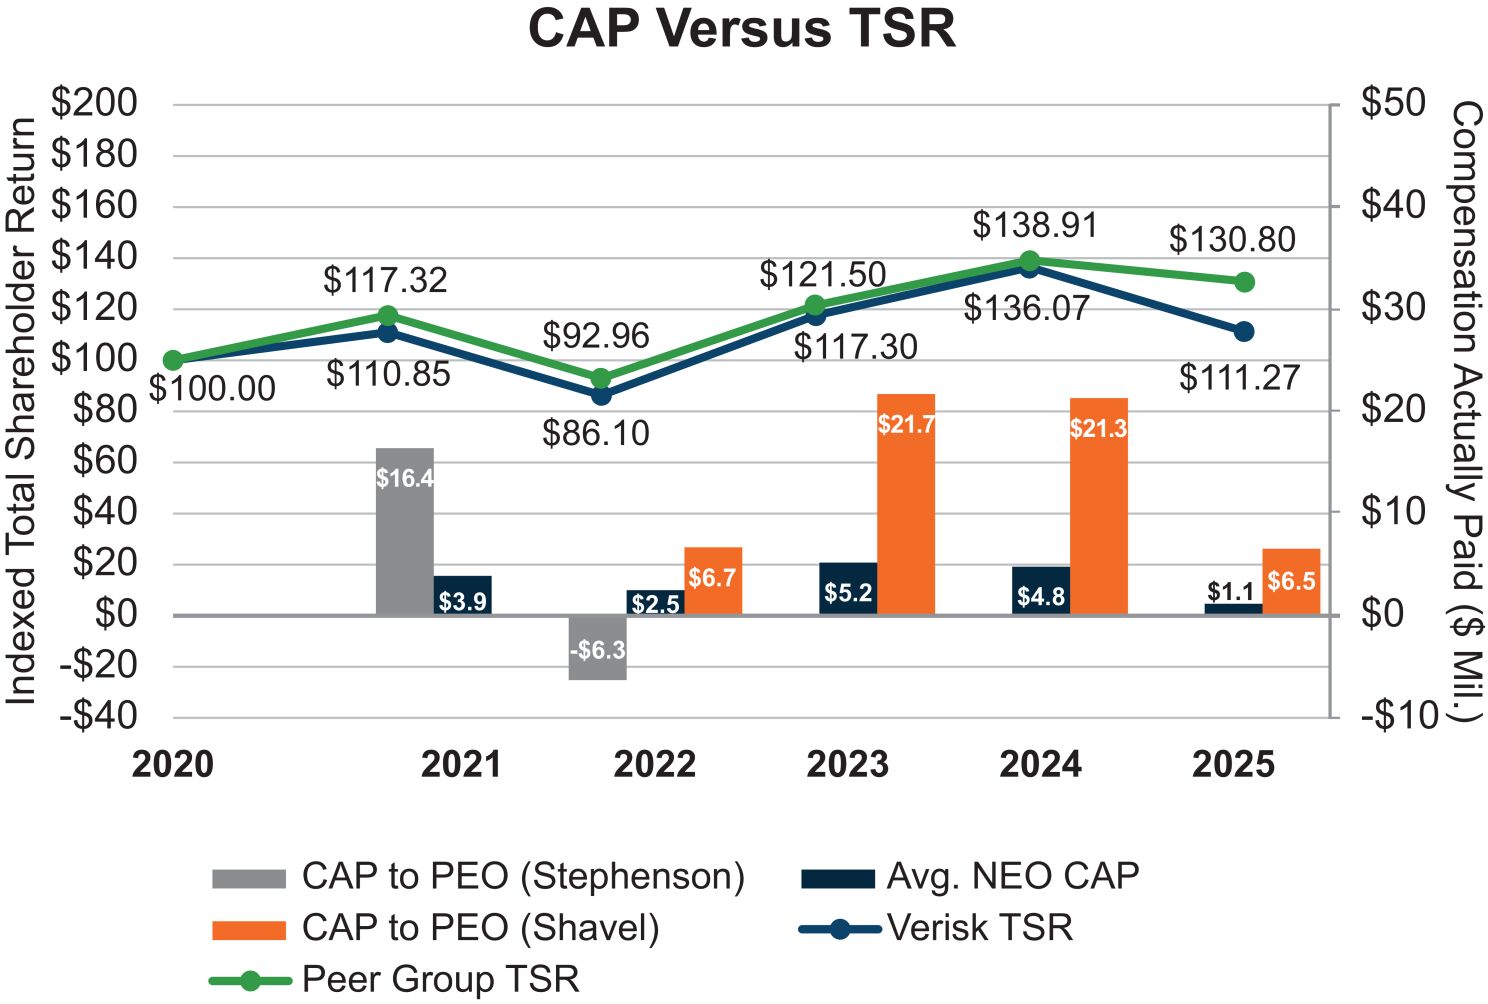
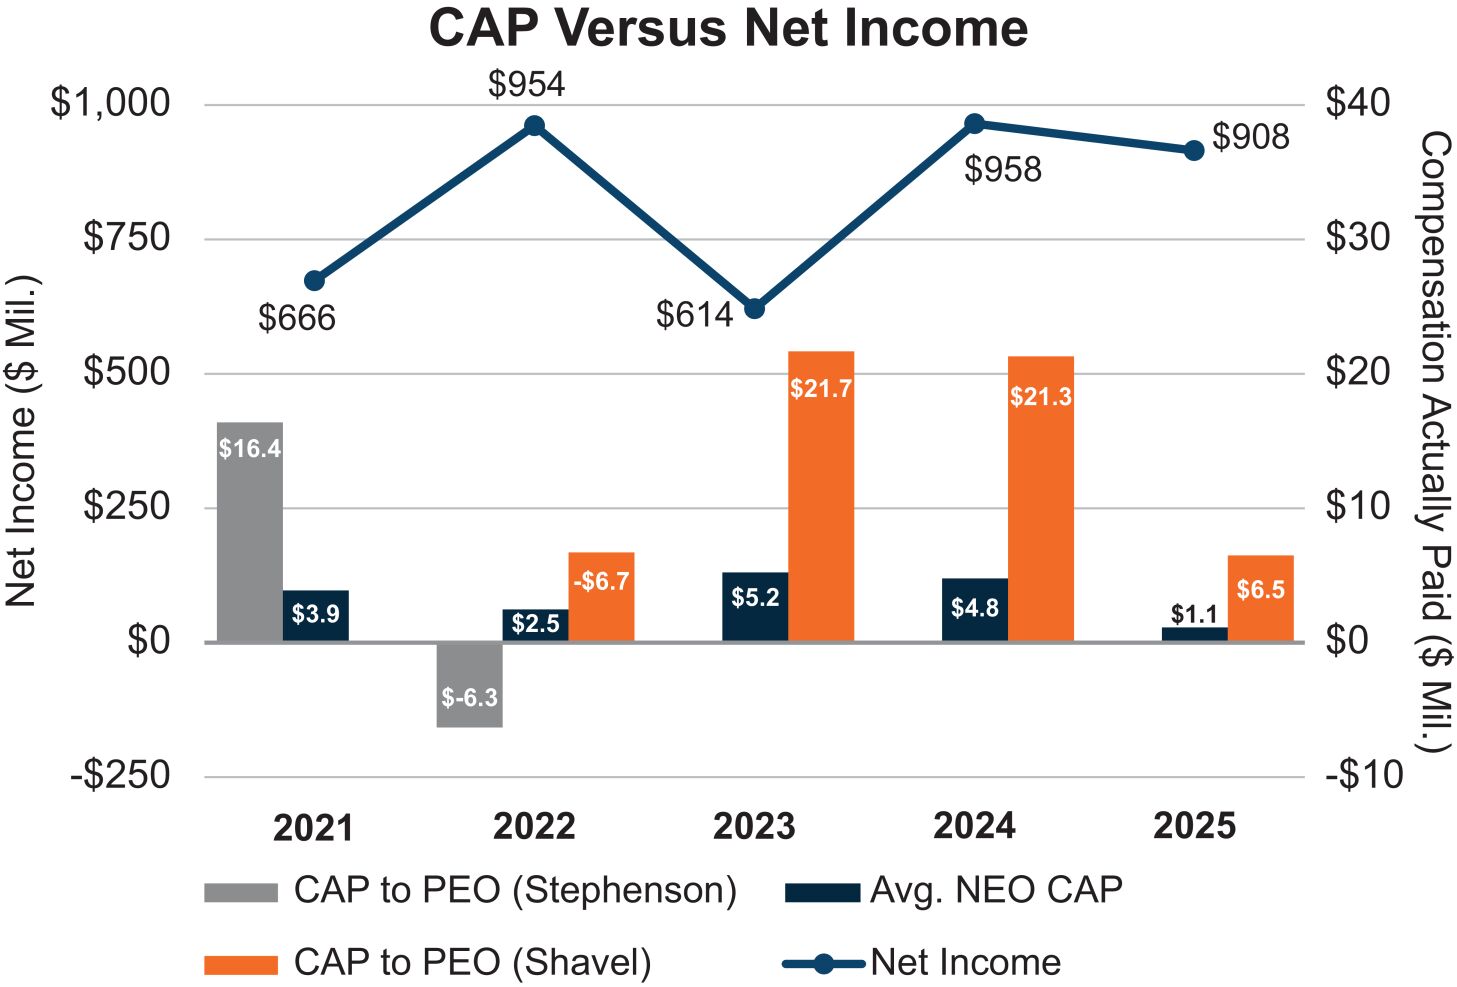
Relationship Between Compensation Actually Paid and GAAP Net Income
The following graph sets forth the relationship between “Compensation Actually Paid” to our PEO(s), the average of “Compensation Actually Paid” to our other NEOs, and our Net Income during the five most recently completed fiscal years.
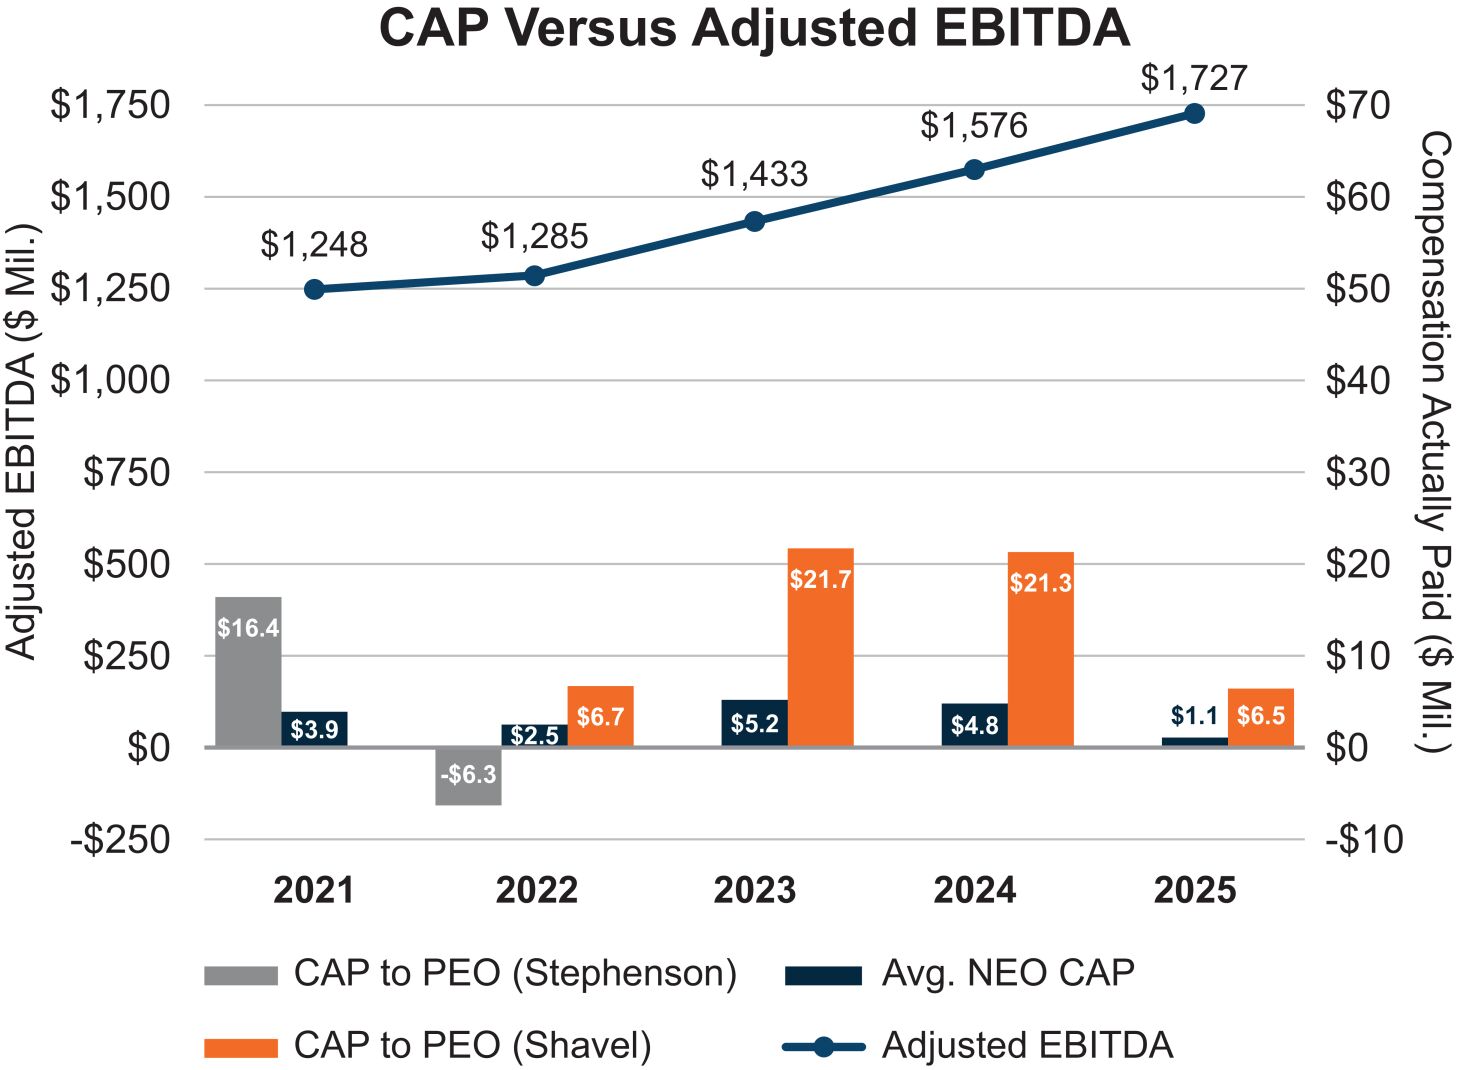
Relationship Between Compensation Actually Paid and Adjusted EBITDA
The following graph sets forth the relationship between “Compensation Actually Paid” to our PEO(s), the average of “Compensation Actually Paid” to our other NEOs, and our Adjusted EBITDA during the five most recently completed fiscal years.
Relationship Between Compensation Actually Paid and Company TSR, and Comparison of Peer TSR versus Company TSR
The following graph sets forth the relationship between “Compensation Actually Paid” to our PEO(s), the average of “Compensation Actually Paid” to our other NEOs, and our Company’s cumulative TSR during the five most recently completed fiscal years, as well as a comparison of the Company’s cumulative TSR over the same period to that of the sixteen-company peer group we use for executive compensation benchmarking purposes which is also the industry line peer group reported in our Annual Report on Form
10-K
for the year ended December 31, 2025.
Most Important Metrics Used for Linking Pay and Performance
The list below shows, in compliance with PVP regulations, the most important metrics the Company and the Talent Management and Compensation Committee used in the most recent fiscal year to link CAP to Company performance. These measures, along with others, significantly impact compensation outcomes for the NEOs.
Metrics |
Adjusted EBITDA |
Revenue |
Relative TSR |
ROIC |