Pay vs Performance Disclosure - USD ($)
Dec. 31, 2025
Dec. 31, 2024
Dec. 31, 2023
Dec. 31, 2022
Dec. 31, 2021
The table below provides additional information relating to the compensation of our Chief Executive Officer and
other Named Executive Officers, respectively, in accordance with Regulation S-K Item 402(v), for each of the years
indicated. In determining “compensation actually paid” (“CAP”) to our executives, we are required to make various
adjustments to amounts that have previously been reported in the Summary Compensation Table, reflecting the
different methods prescribed by the SEC for reporting the compensation of our Named Executive Officers in the
Summary Compensation Table above and in the Pay vs. Performance Table below. Compensation amounts shown
for our Other NEOs (as defined below) are reported as averages for each of the fiscal years indicated.
CEO Pay (1) | Other NEO Pay (1) | Value of Initial Fixed $100 Investment Based On: (4) | Other Performance Measures (5) | |||||||||||||
Year | Summary Compensation Table Total Compensation (2) | Compensation “Actually Paid” (3) | Average Summary Compensation Table Total Compensation (2) | Average Compensation “Actually Paid” (3) | Total Shareholder Return | Peer Group Total Shareholder Return | Net Income (thousands) | Adjusted EBITDA (thousands) | ||||||||
2025 | $7,735,670 | $6,133,675 | $2,045,673 | $1,622,601 | $302.26 | $181.72 | $353,761 | $401,468 | ||||||||
2024 | $7,401,994 | $8,887,141 | $1,713,329 | $1,980,299 | $328.05 | $175.53 | $147,468 | $347,211 | ||||||||
2023 | $7,753,037 | $9,117,186 | $2,021,658 | $2,287,151 | $267.67 | $198.71 | $97,403 | $289,046 | ||||||||
2022 | $5,754,808 | $7,946,721 | $1,436,391 | $1,807,773 | $220.00 | $194.98 | $25,941 | $232,638 | ||||||||
2021 | $6,516,179 | $7,323,619 | $1,731,592 | $1,897,064 | $142.26 | $120.74 | $(49,307) | $210,601 | ||||||||
years indicated included: (i) Ms. Simons and Messrs. Curtis, Laura, and McDonald in 2025; (ii) Messrs. Curtis, McDonald, Childress,
our Senior Vice President and Chief Commercial Officer, and Laura in 2024; (iii) Ms. Simons and Messrs. Curtis, McDonald and
Childress in 2023; (iv) Messrs. Curtis, McDonald and Childress, as well as Mr. David K. Lawrence, our former Senior Vice President,
General Counsel and Secretary, and Mr. Eric A. Silva, our former Senior Vice President, Strategic Planning, in 2022; and (v) Messrs.
Curtis, Lawrence, Martin and Silva, in 2021 (collectively referred to herein as the “Other NEOs”).
(2)Reflects the amount reported in the “Total” column of the Summary Compensation Table above for the Chief Executive Officer and the
average of the amounts reported in the “Total” column of the Summary Compensation Table for the Other NEOs for each of the fiscal
years indicated.
(3)Reflects the CAP to the Chief Executive Officer and the Other NEOs as computed in accordance with Item 402(v) of Regulation S-K
and may not reflect the actual amount of compensation earned by or paid to the Chief Executive Officer during the fiscal year indicated.
Such amounts are calculated by deducting the amounts reported in the “Stock Awards” column of the Summary Compensation Table
from the “Total” column of the Summary Compensation Table for the Chief Executive Officer, and by deducting the average of the
amounts reported in the “Stock Awards” column of the Summary Compensation Table from the average of the amounts reported in the
“Total” Column of the Summary Compensation Table for the Other NEOs, in each case, in the fiscal years indicated and making certain
adjustments as set forth below. Amounts reported under the “Other Adjustments” heading for 2020-2021 have been revised from those
amounts provided in our Definitive Proxy Statement on Schedule 14A with respect to our 2023 annual meeting of stockholders to
reflect changes to how we calculate the value of our restricted stock unit awards for Named Executive officers who are retirement
eligible in accordance with SEC guidance released in September 2023
Stock and (ii) the PHLX Oil Service Sector Index as of December 31, 2020, measured over each of the periods ending on December
31, 2021, 2022, 2023, 2024, and 2025. It is assumed that dividends, if any, are reinvested. The PHLX Oil Service Sector Index is the
published industry or line-of-business index that we selected for purposes of Item 201(e) of Regulation S-K under the Exchange Act in
our Annual Report on Form 10-K for the year ended December 31, 2025
from the “Total” column of the Summary Compensation Table for the Chief Executive Officer, and by deducting the average of the
amounts reported in the “Stock Awards” column of the Summary Compensation Table from the average of the amounts reported in the
“Total” Column of the Summary Compensation Table for the Other NEOs, in each case, in the fiscal years indicated and making certain
adjustments as set forth below. Amounts reported under the “Other Adjustments” heading for 2020-2021 have been revised from those
amounts provided in our Definitive Proxy Statement on Schedule 14A with respect to our 2023 annual meeting of stockholders to
reflect changes to how we calculate the value of our restricted stock unit awards for Named Executive officers who are retirement
eligible in accordance with SEC guidance released in September 2023.
Amounts Deducted from and Added to Total Compensation for the CEO to Determine Compensation “Actually Paid” | |||||||
Year | Summary Compensation Table Total | Stock Awards as Reported in Summary Compensation Table (A) | Other Adjustments | Total Compensation “Actually Paid” (F) | |||
Fair Value as of Year End of Awards Granted During Year that Remain Outstanding as of Year End (B) | Year-over-Year Change in Fair Value of Awards Granted in Prior Year that Remain Outstanding as of Year End (C) | Fair Value as of Vesting Date of Awards Granted During Year that Vest During Year (D) | Year-over-Year Change in Fair Value of Awards Granted in Prior Year that Vest During Year (E) | ||||
2025 | $7,735,670 | $(2,027,796) | $1,902,034 | $(1,060,535) | $— | $(415,698) | $6,133,675 |
2024 | $7,401,994 | $(2,218,135) | $2,633,089 | $965,203 | $— | $104,990 | $8,887,141 |
2023 | $7,753,037 | $(1,917,631) | $2,062,011 | $971,548 | $— | $248,221 | $9,117,186 |
2022 | $5,754,808 | $(1,473,176) | $1,822,196 | $1,607,307 | $— | $235,586 | $7,946,721 |
2021 | $6,516,179 | $(1,795,488) | $1,720,930 | $642,324 | $— | $239,674 | $7,323,619 |
Amounts Deducted from and Added to Total Compensation for the Other NEOs to Determine Compensation “Actually Paid” | |||||||
Year | Summary Compensation Table Total | Stock Awards as Reported in Summary Compensation Table (A) | Other Adjustments | Total Compensation “Actually Paid” (F) | |||
Fair Value as of Year End of Awards Granted During Year that Remain Outstanding as of Year End (B) | Year-over-Year Change in Fair Value of Awards Granted in Prior Year that Remain Outstanding as of Year End (C) | Fair Value as of Vesting Date of Awards Granted During Year that Vest During Year (D) | Year-over-Year Change in Fair Value of Awards Granted in Prior Year that Vest During Year (E) | ||||
2025 | $2,045,673 | $(426,149) | $399,720 | $(273,722) | $— | $(122,921) | $1,622,601 |
2024 | $1,713,329 | $(403,688) | $479,207 | $169,860 | $— | $21,591 | $1,980,299 |
2023 | $2,021,658 | $(580,961) | $654,833 | $155,230 | $— | $36,391 | $2,287,151 |
2022 | $1,436,391 | $(281,491) | $291,548 | $321,197 | $— | $40,128 | $1,807,773 |
2021 | $1,731,592 | $(374,016) | $358,485 | $135,092 | $— | $45,911 | $1,897,064 |
(A) Reflects either (i) the grant date fair value, with respect to the Chief Executive Officer, or (ii) the average grant date fair value, with
respect to the Other NEOs, as reported in the “Stock Awards” column of the Summary Compensation Table.
(B) Reflects either (i) the fair value, with respect to the Chief Executive Officer, or (ii) the average of the fair value, with respect to the
Other NEOs, as of the end of the covered fiscal year of any awards granted to the applicable individuals during the covered fiscal
year that are outstanding and unvested as of the end of the covered fiscal year.
(C) Reflects either (i) the amount, with respect to the Chief Executive Officer, or (ii) the average amount, with respect to the Other
NEOs, equal to the change in fair value as of the end of the covered fiscal year (from the end of the prior fiscal year) of any
portion of any awards granted in a prior fiscal year that remained outstanding and unvested as of the end of the covered fiscal
year.
(D) Reflects the average fair value, with respect to the Other NEOs, as of the vesting date of the portion of awards granted during the
covered fiscal year that vested during the covered fiscal year. Our Chief Executive Officer did not receive any awards that were
granted and that vested (in whole or a portion thereof) in the same fiscal year.
(E) Reflects either (i) the amount, with respect to the Chief Executive Officer, or (ii) the average amount, with respect to the Other
NEOs, equal to the change in fair value as of the vesting date (from the end of the prior fiscal year) of the portion of any awards
granted in a prior fiscal year that vested during the covered fiscal year.
(F) None of the awards (in whole or a portion thereof) granted to any of the named executive officers in prior fiscal years were
forfeited during any of the covered fiscal years and no dividends or other earnings were paid on stock or other awards during any
of the covered fiscal years.
The following table contains an unranked list of the most important financial performance measures used by the
Company to link executive “compensation actually paid” in 2025, calculated in accordance with the SEC’s
regulations, to the Company’s performance in fiscal year 2025, as such measures are defined for purposes of our
2025 cash bonus program and 2025 performance unit awards. The role of each of these performance measures in
the compensation of our named executive officers and a description of how each measure is calculated are
discussed under “Compensation Discussion & Analysis” above.
Key Performance Measures |
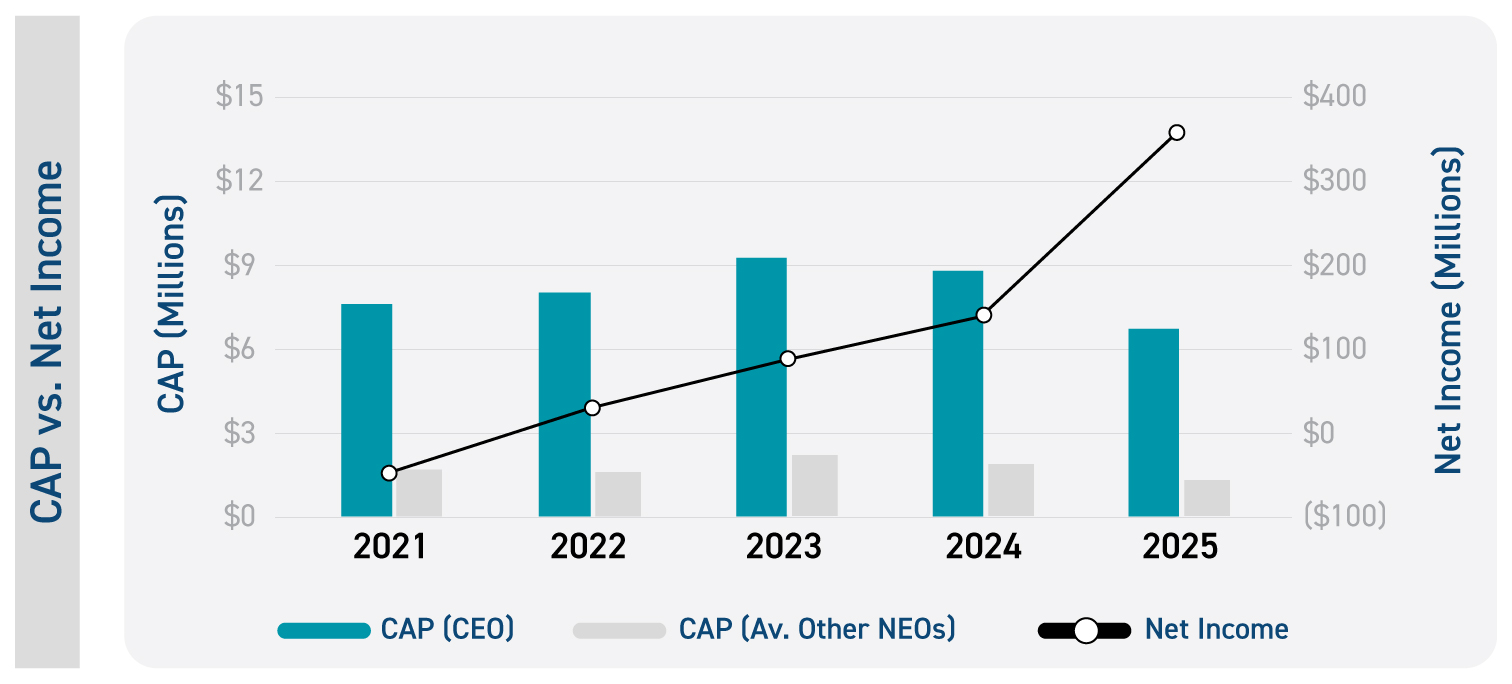
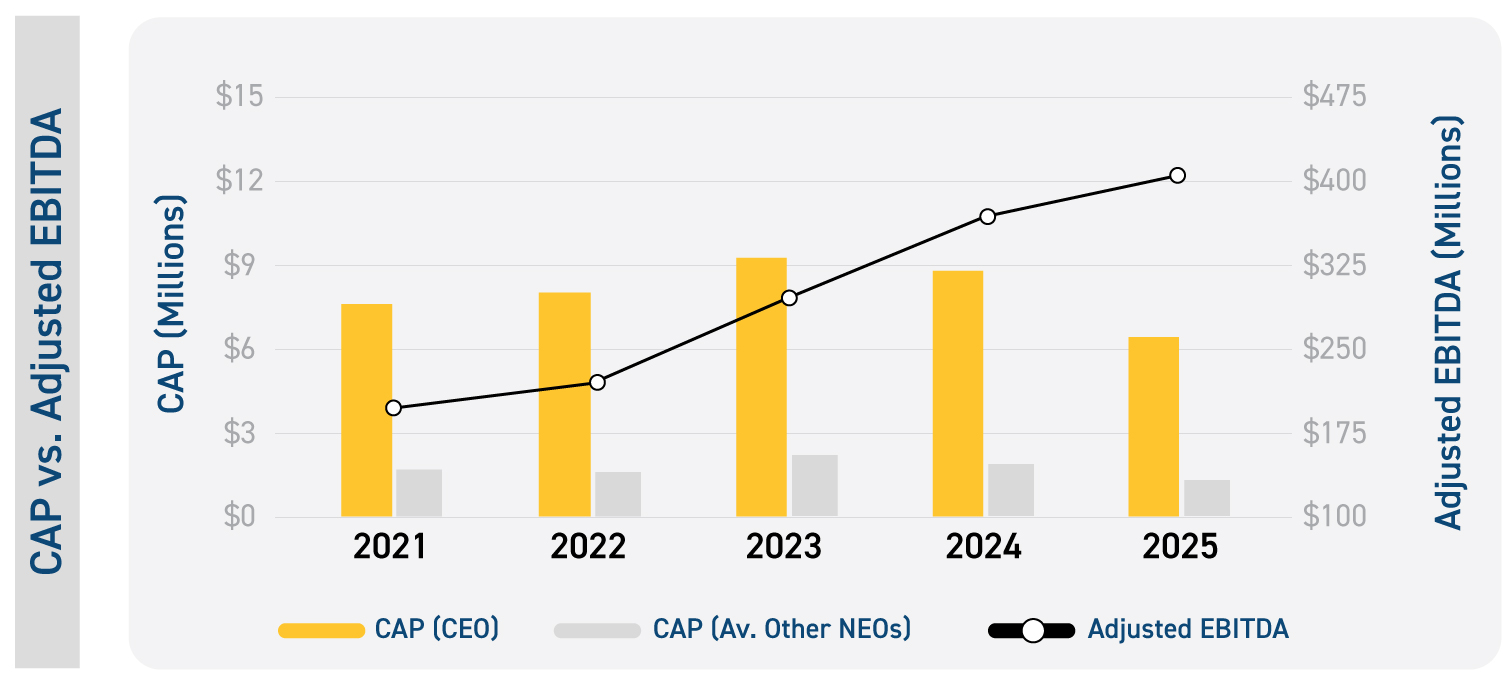
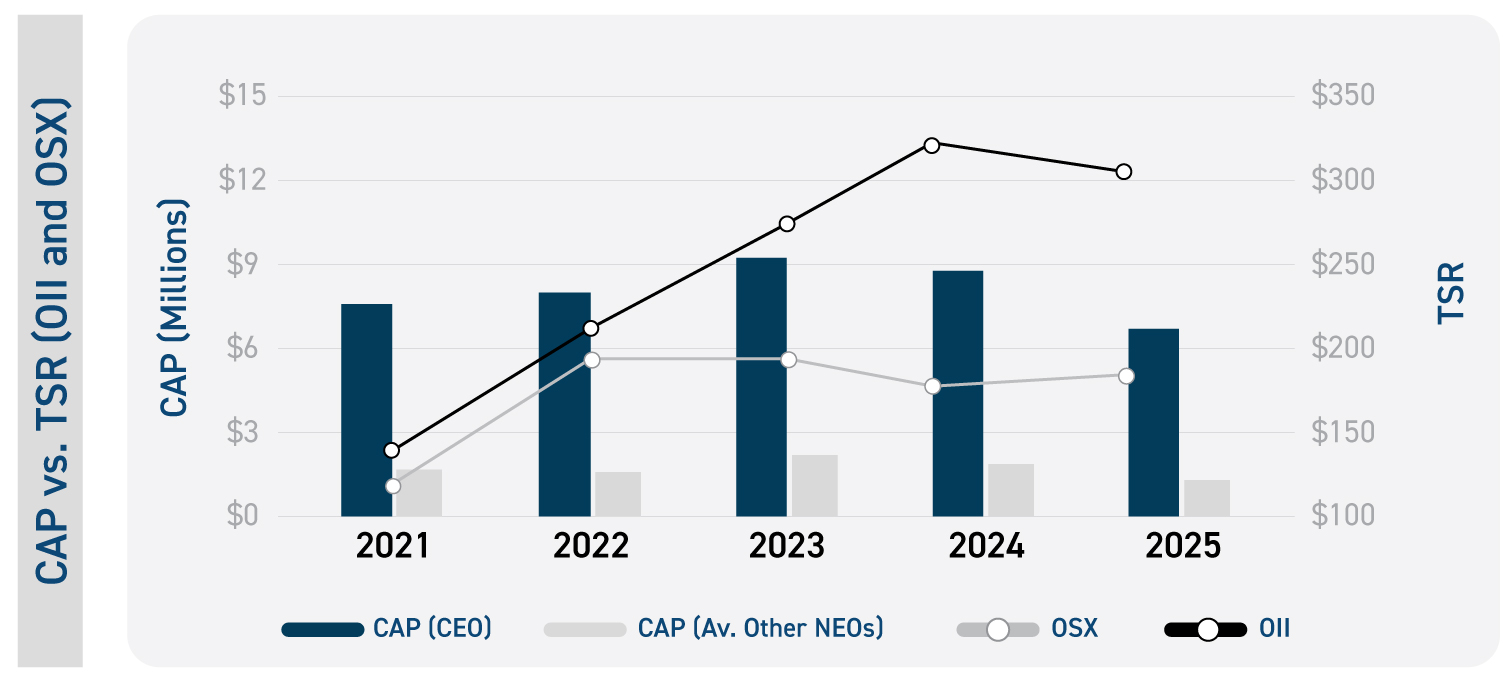
The following charts illustrate the relationship between CAP over the five-year period ended December 31, 2025,
and trends in our Relative Total Shareholder Return, Net Income and Adjusted EBITDA over the same period.
Further, the chart entitled “CAP vs. TSR (OII and OSX)” shows the relationship between our TSR and that of the
OSX over the same period, as described in Note (4) to the Pay vs. Performance Table above.