Pay vs Performance Disclosure
Dec. 31, 2025
USD ($)
$ / shares
Fiscal Year | Summary Comp Table Total for PEO(1)(2) ($) | Compensation Actually Paid to PEO(1)(3) ($) | Avg. Summary Compensation Table Total for Non-PEO NEOs(1)(2) ($) | Avg. Compensation Actually Paid to Non-PEO NEOs(1)(3) ($) | Value of an initial $100 Investment | Net Income(6) ($ Millions) | CSM: Adjusted EBITDA(7) ($ Millions) | ||||||||||||||||||||||
Total Shareowner Return(4) ($) | Peer Group Total Shareholder Return(5) ($) | ||||||||||||||||||||||||||||
| 2025 | 7,979,925 | 6,366,047 | 3,129,218 | 1,955,167 | 99.67 | 105.57 | 285 | 957 | |||||||||||||||||||||
| Year | PEO | NON-PEO NEOs | ||||||
| 2025 | David Sewell | Tina Pierce, Jeffrey Dormo, Simon Mawson, Jason Clifford | ||||||
| Reconciliation of Summary Compensation Table Total to Compensation Actually Paid for PEO | Fiscal Year 2025 ($) | |||||||
| Summary Compensation Table Total | 7,979,925 | |||||||
(Minus): Grant Date Fair Value of Equity Awards Granted in the Fiscal Year | (6,400,276) | |||||||
(Minus): Change in Pension Value | — | |||||||
Plus: Pension Service Cost and Associated Prior Service Cost | — | |||||||
Plus: Fair Value at Fiscal Year End of Outstanding and Unvested Equity Awards Granted in the Fiscal Year | 4,790,960 | |||||||
Plus/(Minus): Change in Fair Value of Outstanding and Unvested Equity Awards Granted in Prior Fiscal Years | (4,562) | |||||||
Plus: Fair Value at Vesting of Equity Awards Granted and Vested in the Fiscal Year | — | |||||||
| Reconciliation of Summary Compensation Table Total to Compensation Actually Paid for PEO | Fiscal Year 2025 ($) | |||||||
Plus/(Minus): Change in Fair Value as of the Vesting Date of Equity Awards Granted in Prior Fiscal Years that Vested in the Fiscal Year | — | |||||||
(Minus): Fair Value as of the Prior Fiscal Year End of Equity Awards Granted in Prior Fiscal Years that Failed to Meet Vesting Conditions in the Fiscal Year | — | |||||||
Plus: Value of Dividends or Other Earnings Paid on Equity Awards Not Otherwise Reflected in Total Compensation | — | |||||||
| Compensation Actually Paid | 6,366,047 | |||||||
| Reconciliation of Average Summary Compensation Table Total to Average Compensation Actually Paid for Non-PEO NEOs | Fiscal Year 2025 ($) | |||||||
| Summary Compensation Table Total | 3,129,218 | |||||||
(Minus): Grant Date Fair Value of Equity Awards Granted in the Fiscal Year | (2,134,996) | |||||||
(Minus): Change in Pension Value | (39,931) | |||||||
Plus: Pension Service Cost and Associated Prior Service Cost | 14,980 | |||||||
Plus: Fair Value at Fiscal Year End of Outstanding and Unvested Equity Awards Granted in the Fiscal Year | 1,018,079 | |||||||
Plus/(Minus): Change in Fair Value of Outstanding and Unvested Equity Awards Granted in Prior Fiscal Years | (32,183) | |||||||
Plus: Fair Value at Vesting of Equity Awards Granted and Vested in the Fiscal Year | — | |||||||
Plus/(Minus): Change in Fair Value as of the Vesting Date of Equity Awards Granted in Prior Fiscal Years that Vested in the Fiscal Year | — | |||||||
(Minus): Fair Value as of the Prior Fiscal Year End of Equity Awards Granted in Prior Fiscal Years that Failed to Meet Vesting Conditions in the Fiscal Year | — | |||||||
Plus: Value of Dividends or Other Earnings Paid on Equity Awards Not Otherwise Reflected in Total Compensation | — | |||||||
| Compensation Actually Paid | 1,955,167 | |||||||
For purposes of the above adjustments, the fair value of equity awards on the applicable date were determined in accordance with FASB ASC Topic 718, using valuation methodologies that are generally consistent with those used to determine the fair value for accounting purposes.
The table below contains ranges of assumptions used in the valuation of outstanding equity awards for the relevant fiscal year(s). For more information, please see the notes to our financial statements in our Annual Report on Form 10-K and the footnotes to the Summary Compensation Table of this Proxy Statement.
| Stock Options – Black-Scholes Model | Fiscal Year 2025 | |||||||
| Expected Term | 0.8 - 4.4 years | |||||||
| Strike Price | $43.65 - $50.59 | |||||||
| Peer-Based Volatility | 22.3% - 26.4% | |||||||
| Dividend Yield | 0% | |||||||
| Risk-Free Interest Rate | 3.4% - 3.6% | |||||||
| Reconciliation of Summary Compensation Table Total to Compensation Actually Paid for PEO | Fiscal Year 2025 ($) | |||||||
| Summary Compensation Table Total | 7,979,925 | |||||||
(Minus): Grant Date Fair Value of Equity Awards Granted in the Fiscal Year | (6,400,276) | |||||||
(Minus): Change in Pension Value | — | |||||||
Plus: Pension Service Cost and Associated Prior Service Cost | — | |||||||
Plus: Fair Value at Fiscal Year End of Outstanding and Unvested Equity Awards Granted in the Fiscal Year | 4,790,960 | |||||||
Plus/(Minus): Change in Fair Value of Outstanding and Unvested Equity Awards Granted in Prior Fiscal Years | (4,562) | |||||||
Plus: Fair Value at Vesting of Equity Awards Granted and Vested in the Fiscal Year | — | |||||||
| Reconciliation of Summary Compensation Table Total to Compensation Actually Paid for PEO | Fiscal Year 2025 ($) | |||||||
Plus/(Minus): Change in Fair Value as of the Vesting Date of Equity Awards Granted in Prior Fiscal Years that Vested in the Fiscal Year | — | |||||||
(Minus): Fair Value as of the Prior Fiscal Year End of Equity Awards Granted in Prior Fiscal Years that Failed to Meet Vesting Conditions in the Fiscal Year | — | |||||||
Plus: Value of Dividends or Other Earnings Paid on Equity Awards Not Otherwise Reflected in Total Compensation | — | |||||||
| Compensation Actually Paid | 6,366,047 | |||||||
| Reconciliation of Average Summary Compensation Table Total to Average Compensation Actually Paid for Non-PEO NEOs | Fiscal Year 2025 ($) | |||||||
| Summary Compensation Table Total | 3,129,218 | |||||||
(Minus): Grant Date Fair Value of Equity Awards Granted in the Fiscal Year | (2,134,996) | |||||||
(Minus): Change in Pension Value | (39,931) | |||||||
Plus: Pension Service Cost and Associated Prior Service Cost | 14,980 | |||||||
Plus: Fair Value at Fiscal Year End of Outstanding and Unvested Equity Awards Granted in the Fiscal Year | 1,018,079 | |||||||
Plus/(Minus): Change in Fair Value of Outstanding and Unvested Equity Awards Granted in Prior Fiscal Years | (32,183) | |||||||
Plus: Fair Value at Vesting of Equity Awards Granted and Vested in the Fiscal Year | — | |||||||
Plus/(Minus): Change in Fair Value as of the Vesting Date of Equity Awards Granted in Prior Fiscal Years that Vested in the Fiscal Year | — | |||||||
(Minus): Fair Value as of the Prior Fiscal Year End of Equity Awards Granted in Prior Fiscal Years that Failed to Meet Vesting Conditions in the Fiscal Year | — | |||||||
Plus: Value of Dividends or Other Earnings Paid on Equity Awards Not Otherwise Reflected in Total Compensation | — | |||||||
| Compensation Actually Paid | 1,955,167 | |||||||
For purposes of the above adjustments, the fair value of equity awards on the applicable date were determined in accordance with FASB ASC Topic 718, using valuation methodologies that are generally consistent with those used to determine the fair value for accounting purposes.
The table below contains ranges of assumptions used in the valuation of outstanding equity awards for the relevant fiscal year(s). For more information, please see the notes to our financial statements in our Annual Report on Form 10-K and the footnotes to the Summary Compensation Table of this Proxy Statement.
| Stock Options – Black-Scholes Model | Fiscal Year 2025 | |||||||
| Expected Term | 0.8 - 4.4 years | |||||||
| Strike Price | $43.65 - $50.59 | |||||||
| Peer-Based Volatility | 22.3% - 26.4% | |||||||
| Dividend Yield | 0% | |||||||
| Risk-Free Interest Rate | 3.4% - 3.6% | |||||||
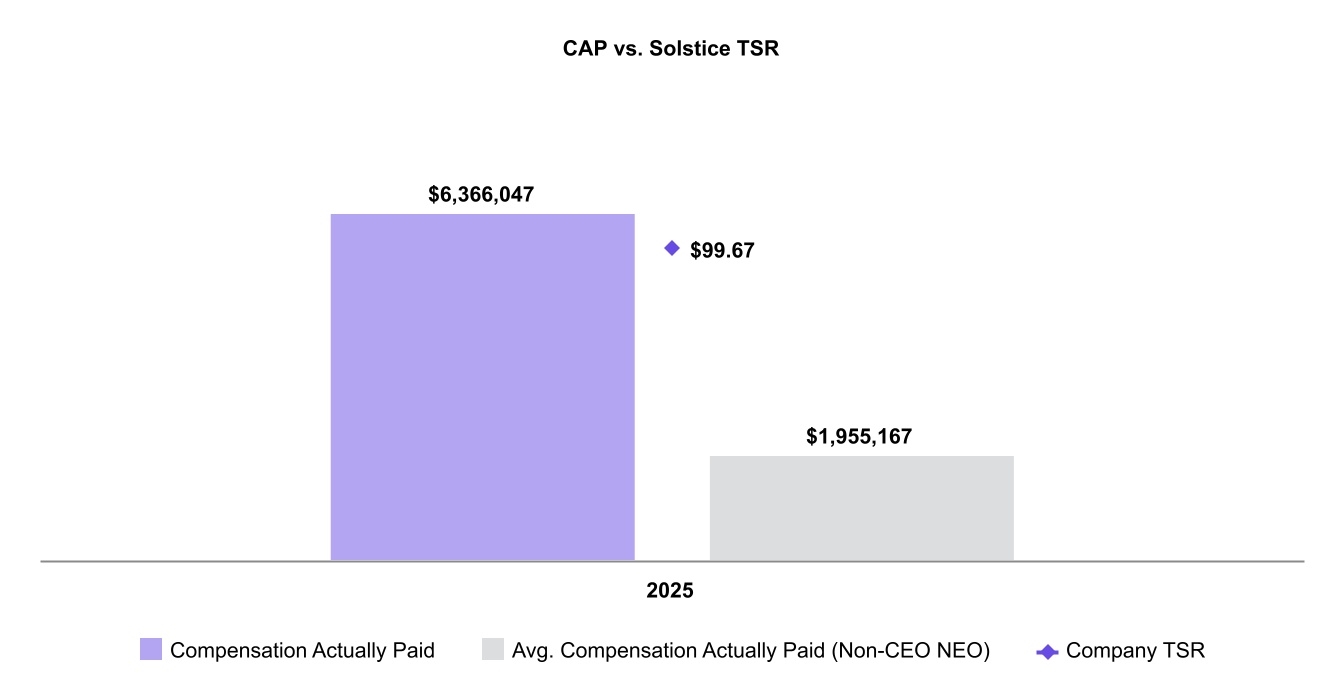
CAP VERSUS TSR
The chart below includes the PEO and Avg. Non-PEO NEO CAP values with our TSR for the applicable fiscal year:
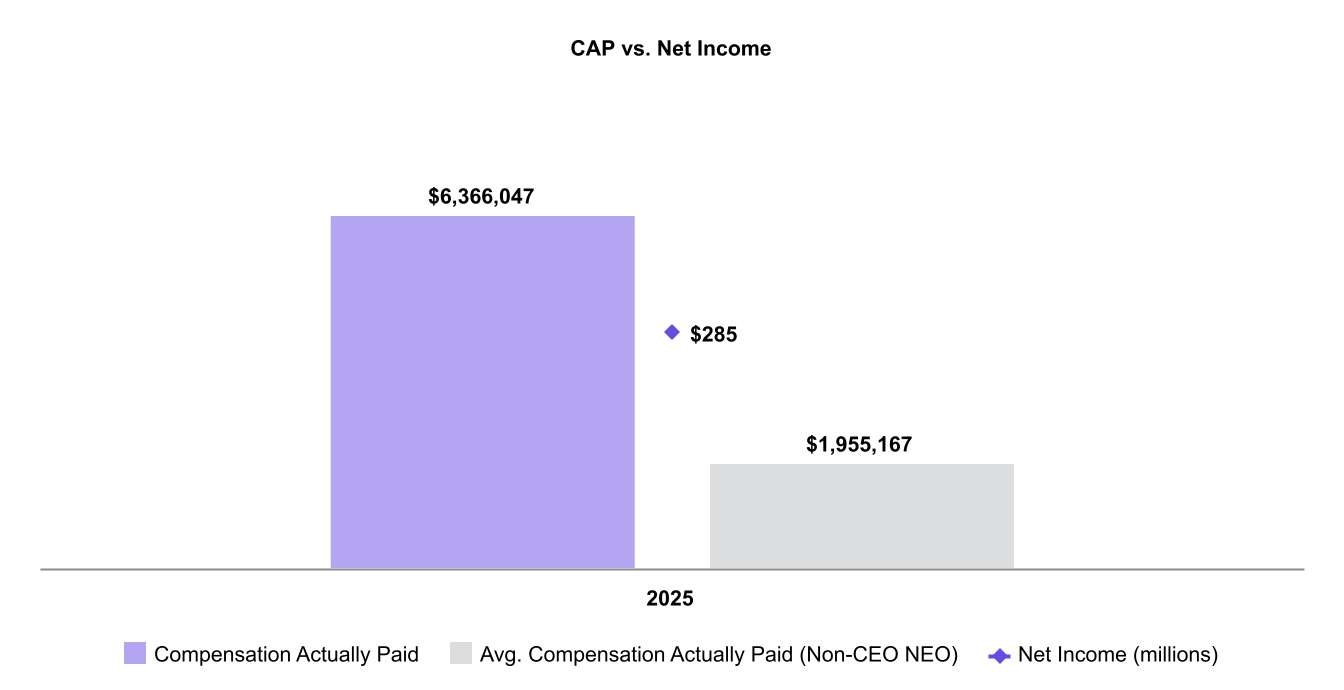
CAP VERSUS NET INCOME
The chart below includes the PEO and Avg. Non-PEO NEO CAP values with our Net Income for the applicable fiscal year:
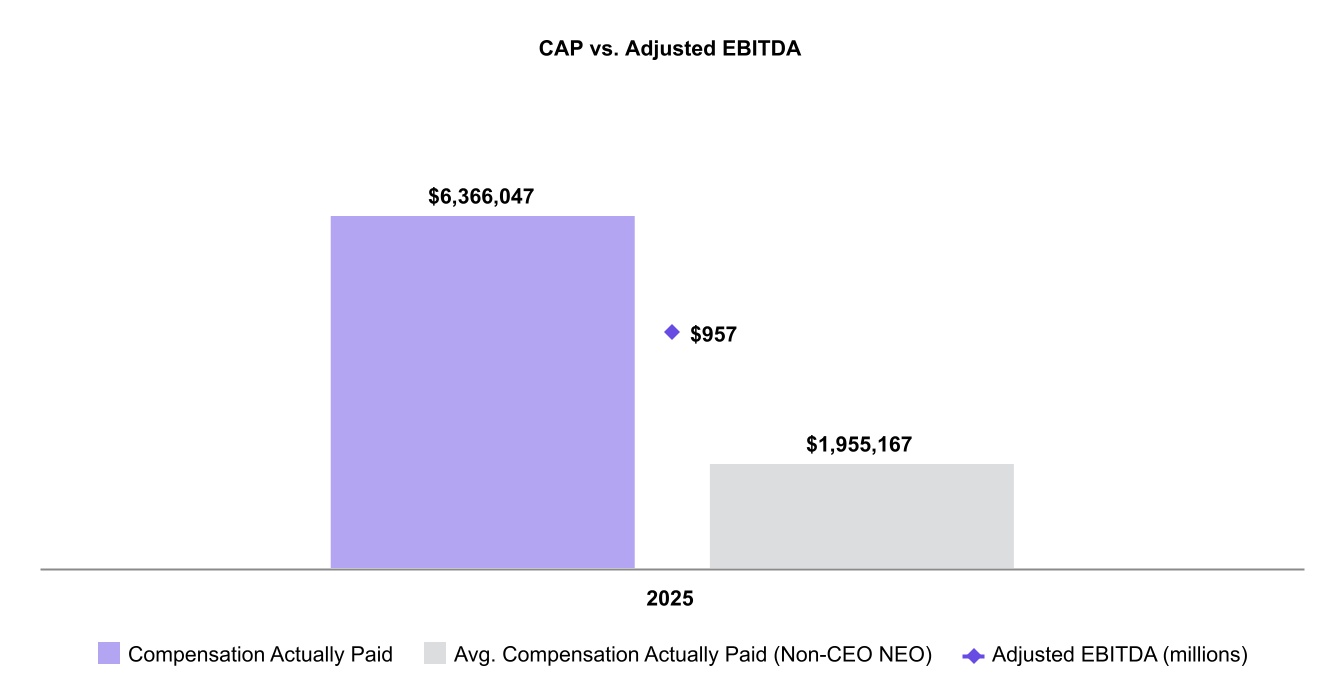
CAP VERSUS ADJUSTED EBITDA
The chart below includes the PEO and Avg. Non-PEO NEO CAP values with our CSM, Adjusted EBITDA for the applicable fiscal year:
| Most Important Financial Metrics | ||
| Revenue | ||
| Adjusted EBITDA | ||
| Operating Cash Flow | ||
| Adjusted Diluted Earnings Per Share | ||
| Return on Invested Capital | ||
| Relative Total Shareholder Return | ||
As required by Section 953(a) of the Dodd-Frank Wall Street Reform and Consumer Protection Act, and Item 402(v) of Regulation S-K, we are providing the following information regarding executive pay and performance. The table below shows pay both as reported in the Summary Compensation Table (“Summary Compensation Table Total”) for the applicable fiscal year and as “Compensation Actually Paid” (“CAP”) for our principal executive officer (“PEO”) and as an average of all of our other named executive officers (“Non-PEO NEOs”) for the applicable fiscal year. Both Summary Compensation Table Total pay and CAP are calculated in accordance with the requirements of Regulation S-K and may differ substantially from the manner in which the Compensation Committee makes executive compensation decisions, which is described in the Compensation Discussion and Analysis section.
The table below also shows (i) Solstice’s cumulative total shareholder return (“TSR”), (ii) the TSR of the S&P 500 Materials Index, (iii) Solstice’s net income for the applicable fiscal year, and (iv) Solstice’s performance with respect to a Company-selected measure (“CSM”), which in our assessment represents the single most important financial performance metric used to link CAP to our NEOs for the most recently completed fiscal year to Solstice’s performance. We selected Adjusted EBITDA for the 2025 fiscal year.
Amounts reflect Summary Compensation Table Total Pay for our NEOs for each corresponding year. Amounts reflect Summary Compensation Table Total Pay for our NEOs for each corresponding year.Total Shareholder Return (TSR) represents the cumulative return on a fixed investment of $100 in the Company’s common stock, for the period beginning on the separation date (October 30, 2025) through the end of the applicable fiscal year, assuming reinvestment of dividends. The dollar amounts reported represent the net income reflected in the Company’s audited financial statements for the applicable year.We completed our separation and became a fully independent publicly traded company on October 30, 2025. We believe the compensation paid to our PEO and Non-PEO NEOs in 2025 reflects our pay-for-performance philosophy. As described in the Compensation Discussion and Analysis, a significant portion of annual target compensation awarded to our NEOs is at risk because it depends on the Company’s performance against pre-established performance goals under our incentive plans. The relationship between the financial measures in the table above and compensation actually paid will expand as we build history as a standalone public company.
2025 CAP to our PEO of $6.4 million was lower compared to the Summary Compensation Table total of $7.9 million, and the average CAP for our Non-PEO NEOs of $2.0 million was lower compared to the Avg. Summary Compensation Table total of $3.0 million. For the period from October 30, 2025 through December 31, 2025, our TSR was 5.6% lower than the TSR of the S&P 500 Materials Index. The primary driver of these differences was the decrease in our stock price from the separation to December 31, 2025. Net Income for 2025 was $285 million and Adjusted EBITDA for 2025 was $957 million.
The graphs below illustrate the relationships over the last fiscal year between, respectively, CAP and our TSR, CAP and our net income, and CAP and the CSM.
Following is an unranked list of the financial performance measures we consider most important in linking company performance and compensation actually paid to our Named Executive Officers for the most recently completed fiscal year. Further information on our performance measures is described in our Compensation Discussion and Analysis above.