Exhibit 96.3
Bulawayo Mining Company Limited
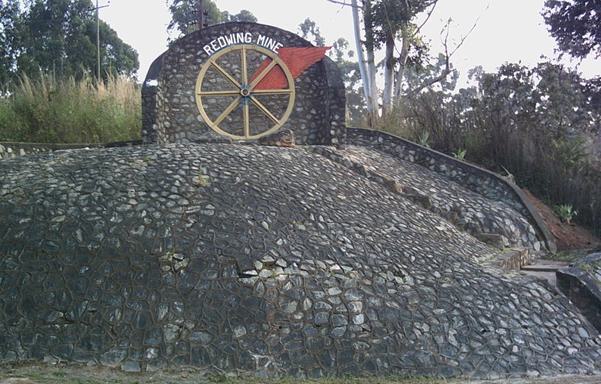
Redwing Mine
S-K 1300 Technical Report Summary
January 2025

| Our ref: Namib Minerals Redwing and Mazowe WSP Consents 1 April 26 | Level 27, 680 George Street |
| Sydney NSW 2000 | |
| Your ref: Namib Minerals Redwing and Mazowe WSP Consents 1 April 26 | GPO Box 5394 |
| Sydney NSW 2001 | |
| 1 April 2026 | |
| Tel: +61 2 9272 5100 | |
| Fax: +61 2 9272 5101 | |
| www.wsp.com |
Namib Minerals
Suite 210, 2nd Floor, Windward III, Regatta Office Park, PO Box 500 Grand Cayman,
Cayman Islands, KY1-1106
Dear All
WSP Consent - Redwing and Mazowe Mine TRS
Please take this letter as confirmation from this date onwards, WSP Australia Pty Limited, take ownership and is responsible for the preparation of the technical reports summary titled Redwing Mine S-K 1300 Technical Report Summary with an effective date of 31 December 2023, and the technical report summary titled Mazowe Mine S-K 1300 Technical Report Summary with an effective date of 31 December 2023.
Furthermore, in each case as signed and certified by WSP Australia Pty Limited (collectively, the “Technical Report Summaries”), WSP hereby states that it is the QP Firm responsible for the preparation of those Technical Report Summaries.
| Yours sincerely | |
| /s/ Colin McVie | |
| Colin McVie | |
| Technical Director Mine Advisory |
WSP Australia Pty Limited ABN 80 078 004 798

Redwing Mine
S-K 1300 Technical Report Summary
Bulawayo Mining Company Limited
WSP
Level 3, 51-55 Bolton St
Newcastle NSW 2300
PO Box 1162
Newcastle NSW 2300
Tel: +61 2 4929 8300
Fax: +61 2 4929 8382
wsp.com
| Rev | Date | Details | ||
| D | 29/01/2025 | Final report |
| Name | Date | Signature | ||||
| Aaron Radonich | /s/ Aaron Radonich | |||||
| Prepared by: | 29/01/2025 | |||||
| Allan Blair | /s/ Allan Blair | |||||
| Reviewed by: | Jerry DeWolfe | 09/01/2025 | /s/ Jerry DeWolfe |
| Table of contents |
| 1 | Executive summary | 1 |
| 1.1 | Property description and ownership | 1 |
| 1.2 | Geology and mineralisation | 1 |
| 1.3 | Exploration | 1 |
| 1.4 | Mineral Resources estimates | 2 |
| 1.5 | Mineral Reserves estimates | 3 |
| 1.6 | Capital and operating costs | 3 |
| 1.7 | Permitting requirements | 3 |
| 1.8 | QPs’ conclusions and recommendations | 3 |
| 1.8.1 | Mineral Resources | 3 |
| 1.8.2 | Mineral Reserves | 5 |
| 2 | Introduction | 7 |
| 2.1 | Registrant information | 7 |
| 2.2 | Terms of reference and purpose | 8 |
| 2.3 | Sources of information | 11 |
| 2.4 | Personal inspection | 11 |
| 2.5 | Previously filed Technical Report Summaries | 11 |
| 2.6 | WSP declaration | 11 |
| 3 | Property description | 12 |
| 3.1 | Property location | 12 |
| 3.2 | Title and mineral rights | 12 |
| 3.3 | Encumbrances | 13 |
| 3.4 | Risks to access, title, or right to perform work | 13 |
| 3.5 | Agreements and royalties | 14 |
| 4 | Accessibility, climate, local resources, infrastructure, and physiography | 15 |
| 4.1 | Topography, elevation, and vegetation | 15 |
| 4.2 | Access | 15 |
| 4.3 | Proximity to population centres | 15 |
| 4.4 | Climate | 15 |
| 4.5 | Local resources and existing infrastructure | 16 |
| 4.5.1 | Power supply | 16 |
i
| CONTENTS (Continued) | ||
| 4.5.2 | Water supply | 16 |
| 4.5.3 | Personnel | 17 |
| 4.5.4 | Suppliers | 17 |
| 5 | History | 17 |
| 5.1 | Exploration and ownership history | 17 |
| 5.2 | Production history | 18 |
| 5.3 | Production reconciliation | 19 |
| 5.4 | Aggregate fiscal year production | 19 |
| 5.5 | Exploration and development by previous owners or operators | 19 |
| 5.6 | Liabilities | 19 |
| 6 | Geological setting, mineralisation, and deposit | 20 |
| 6.1 | Regional geology | 20 |
| 6.1.1 | Mozambique Greenstone Belt | 20 |
| 6.1.2 | Granitoids | 20 |
| 6.2 | Structural setting | 21 |
| 6.3 | Local and property geology | 21 |
| 6.3.1 | Felsite | 21 |
| 6.3.2 | MSZ | 21 |
| 6.4 | Deposit type and geology | 22 |
| 6.5 | Mineralisation | 22 |
| 7 | Exploration | 25 |
| 7.1 | Diamond drilling | 25 |
| 7.2 | QP’s opinion | 33 |
| 8 | Sample preparation, analyses, and security | 34 |
| 8.1 | Sampling techniques | 34 |
| 8.1.1 | Core sampling | 34 |
| 8.1.2 | Channel sampling | 34 |
| 8.1.3 | Grab sampling | 34 |
| 8.1.4 | Drive face and stope-bench sampling | 34 |
| 8.1.5 | Sample security | 34 |
ii
| CONTENTS (Continued) | ||
| 8.2 | Dry bulk density determination | 34 |
| 8.3 | Sample preparation, analysis and procedures | 34 |
| 8.4 | Quality Assurance Quality Control | 35 |
| 8.4.1 | Drill core | 35 |
| 8.4.2 | Channel and grab samples | 35 |
| 8.4.3 | Certified Reference Material | 36 |
| 8.4.4 | Blanks | 36 |
| 8.4.5 | Duplicates | 36 |
| 8.5 | QP’s opinion on adequacy | 36 |
| 9 | Data verification | 37 |
| 9.1 | Mineral Resources data verification | 37 |
| 9.1.1 | Data verification conducted by RMC Zimbabwe | 37 |
| 9.1.2 | Data verification conducted by WSP | 37 |
| 9.1.3 | Limitations on exploration and Mineral Resources data verification | 37 |
| 9.2 | Mining and Mineral Reserves data verification | 38 |
| 9.3 | Geotechnical data verification | 38 |
| 9.4 | Hydrogeology and hydrology data verification | 39 |
| 9.4.1 | Hydrology | 41 |
| 9.4.2 | Hydrogeology | 41 |
| 9.5 | Processing and recovery methods data verification | 41 |
| 10 | Mineral processing and metallurgical testing | 42 |
| 10.1 | Nature and extent of mineral processing and metallurgical testing | 42 |
| 10.1.1 | Mineral processing | 42 |
| 10.1.2 | Process testwork | 43 |
| 10.2 | Metallurgical sampling representativity | 43 |
| 10.3 | Details of analytical or testing laboratories | 44 |
| 10.4 | Recovery Estimates | 44 |
| 10.5 | QP’s opinion on adequacy of the data collected | 44 |
| 11 | Mineral Resource estimates | 45 |
| 11.1 | Key assumptions, parameters, and methods | 45 |
| 11.1.1 | Care and maintenance | 45 |
| 11.1.2 | Resource database | 45 |
iii
| CONTENTS (Continued) | ||
| 11.1.3 | Geological interpretation | 45 |
| 11.1.4 | Data preparation | 45 |
| 11.1.5 | Exploratory data analysis | 45 |
| 11.1.6 | Dry bulk density | 46 |
| 11.1.7 | Block models | 46 |
| 11.1.8 | Grade interpolation parameters | 47 |
| 11.1.9 | Grade estimation | 47 |
| 11.1.10 | Model validation | 47 |
| 11.2 | Mineral Resources classification | 48 |
| 11.2.1 | Measured Mineral Resources | 48 |
| 11.2.2 | Indicated Mineral Resources | 49 |
| 11.2.3 | Inferred Mineral Resources | 50 |
| 11.3 | Cut-off grade, price, and justification | 50 |
| 11.3.1 | Tonnage-grade factors | 51 |
| 11.4 | Mineral Resources statement | 52 |
| 11.5 | Uncertainty in the estimates of Inferred, Indicated, and Measured Mineral Resources | 54 |
| 11.6 | QP’s opinion on factors likely to influence the prospect of economic extraction | 55 |
| 12 | Mineral Reserves estimates | 55 |
| 13 | Mining methods | 56 |
| 13.1 | Introduction | 56 |
| 13.2 | Parameters relative to the design and schedule | 56 |
| 13.2.1 | Geotechnical | 56 |
| 13.2.2 | Hydrogeological | 57 |
| 13.3 | Production parameters | 57 |
| 13.3.1 | Production rates | 57 |
| 13.3.2 | Expected mine life | 57 |
| 13.3.3 | Mining model | 58 |
| 13.3.4 | Mining dilution and recovery factors | 58 |
| 13.4 | Mining fleet, machinery, and personnel requirements | 59 |
| 13.5 | Scheduling results | 59 |
| 13.6 | Mining unit dimensions | 60 |
| 13.7 | Mine layout | 60 |
iv
CONTENTS (Continued)
| 14 | Processing and recovery methods | 61 |
| 14.1 | Processing methodologies and flowsheets | 61 |
| 14.2 | Processing plant throughput and characteristics | 62 |
| 14.3 | Primary and secondary crushing | 63 |
| 14.3.1 | Primary crushing | 63 |
| 14.3.2 | Secondary crushing | 63 |
| 14.4 | Downhill conveying | 63 |
| 14.5 | Product sampling | 63 |
| 14.6 | Product stockyard | 63 |
| 14.7 | Offshore tertiary crushing and screening | 63 |
| 14.8 | Energy and water process materials requirements | 63 |
| 14.8.1 | Mine power supply | 63 |
| 14.8.2 | Mine water management system | 64 |
| 14.9 | QP’s opinion | 64 |
| 15 | Infrastructure | 64 |
| 15.1 | Rail access | 64 |
| 15.2 | Port access | 64 |
| 15.3 | Roads | 64 |
| 15.4 | Camp | 64 |
| 15.5 | Tailings | 64 |
| 15.6 | Potable water and wastewater | 65 |
| 15.7 | Accommodation and offices | 65 |
| 15.8 | Non process infrastructure | 65 |
| 15.9 | Information and communications technology (ICT) systems | 65 |
| 15.10 | Other support facilities and utilities | 65 |
| 16 | Market studies | 66 |
| 16.1 | Nature and material terms of agency relationships | 66 |
| 16.2 | Results of relevant market studies | 66 |
| 16.3 | Commodity price projections | 66 |
v
CONTENTS (Continued)
| 16.4 | Mining and processing | 68 |
| 16.5 | Product transport and handling | 68 |
| 16.6 | Hedging arrangements | 68 |
| 16.7 | Forward sales contracts | 68 |
| 16.8 | Contracts with affiliated parties | 68 |
| 17 | Environmental studies, permitting, and plans, negotiations, or agreements with local individuals or groups | 69 |
| 17.1 | Introduction | 69 |
| 17.2 | Project context | 69 |
| 17.3 | Project permitting | 69 |
| 17.4 | Environmental and social impact assessment | 70 |
| 17.4.1 | Biodiversity and natural resources | 70 |
| 17.4.2 | Managing impacts on water | 70 |
| 17.4.3 | Acid and metalliferous drainage (AMD) | 70 |
| 17.4.4 | Erosion and protection of soils | 70 |
| 17.4.5 | Noise and vibration | 70 |
| 17.4.6 | Air quality | 70 |
| 17.4.7 | Local climate impacts | 70 |
| 17.4.8 | Greenhouse gas emissions | 70 |
| 17.4.9 | Resources use and non-mineral waste | 70 |
| 17.5 | Project standards | 71 |
| 17.6 | Stakeholder engagement | 71 |
| 17.6.1 | Stakeholder engagement plan | 71 |
| 17.6.2 | Consultation | 71 |
| 17.7 | Cultural, economic, and social conditions | 71 |
| 17.7.1 | Cultural heritage | 71 |
| 17.7.2 | Local landscape | 71 |
| 17.7.3 | Contributing to the national and local economy | 71 |
| 17.7.4 | Establishing a social management framework | 71 |
| 17.7.5 | Impacts on land use and access | 71 |
| 17.7.6 | Protecting community health and safety | 72 |
| 17.7.7 | Protecting the workforce | 72 |
| 17.7.8 | Commitment to local procurement and hiring | 72 |
| 17.8 | Mine closure | 72 |
| 17.8.1 | Plan | 72 |
| 17.8.2 | Cost | 73 |
| 17.9 | Translating the ESIA into environmental and social management | 73 |
vi
CONTENTS (Continued)
| 17.10 | QP’s opinion | 74 |
| 18 | Capital and operating costs | 74 |
| 19 | Economic analysis | 74 |
| 20 | Adjacent properties | 75 |
| 21 | Other relevant data and information | 75 |
| 22 | Interpretation and conclusions | 76 |
| 22.1 | Mineral Resources interpretations and conclusions | 76 |
| 22.2 | Mineral Reserves interpretations and conclusions | 76 |
| 23 | Recommendations | 77 |
| 23.1 | Mineral Resources recommendations | 77 |
| 23.2 | Mineral Reserves recommendations | 77 |
| 24 | References | 78 |
| 25 | Reliance on information provided by the Registrant | 79 |
List of tables
| Table 1.1 | RGM underground Measured and Indicated Mineral Resource estimate as of 31 December 2023 | 2 |
| Table 1.2 | RGM underground Inferred Mineral Resource estimate as of 31 December 2023 | 2 |
| Table 2.1 | List of acronyms and abbreviations used in this TRS | 9 |
| Table 2.2 | List of QPs | 11 |
| Table 5.1 | Mineral Resource summary comparison end December 2022 to end December 2023 | 19 |
| Table 6.1 | Structural deformation events | 21 |
| Table 9.1 | Summary of laboratory results (SRKSA (2016)) | 38 |
| Table 11.1 | Variography summary (KDM 2018) | 46 |
| Table 11.2 | Block dimension schemes for the 30 June 2018 block models (KDM 2018) | 46 |
vii
List of tables continued
| Table 11.3 | Kriging parameters generated from variographic analysis (KDM 2018) | 47 |
| Table 11.4 | 31 December 2023 COG estimation parameters | 51 |
| Table 11.5 | RGM underground Measured and Indicated Mineral Resource estimate as of 31 December 2023 | 53 |
| Table 11.6 | RGM underground Inferred Mineral Resource estimate as of 31 December 2023 | 53 |
| Table 13.1 | Block call factors 2012–2018 (RGM Operations Reports) | 58 |
| Table 13.2 | Preliminary mining design parameters | 60 |
| Table 16.1 | Zimbabwean inflation rate and economic indicators (Trading Economics, 30 May 2024) | 67 |
| Table 17.1 | RGM present closure obligation (Enmin 2024) | 73 |
| Table 20.1 | Summary of adjacent claims (Virimai 2022) | 75 |
List of figures
| Figure 2.1 | BMC Limited corporate structure | 7 |
| Figure 3.1 | Property location map | 12 |
| Figure 3.2 | RGM ML 34 boundary | 13 |
| Figure 4.1 | Climate statistics for Penhalonga, Zimbabwe (Meteoblue, 2024) | 16 |
| Figure 5.1 | RGM total gold production 1981–2023 | 18 |
| Figure 6.1 | Regional geology of Zimbabwe showing locations of greenstone belts (Prendergast 2004) | 20 |
| Figure 6.2 | RGM MSZ schematic section | 22 |
| Figure 6.3 | Penhalonga Valley local geology | 23 |
| Figure 6.4 | RGM surface geology | 23 |
| Figure 6.5 | RGM local stratigraphy | 24 |
| Figure 7.1 | Plan view of all drill hole collars and existing mine development | 30 |
| Figure 9.1 | Catchment boundaries of Zimbabwe (BMC Limited) | 39 |
| Figure 9.2 | Sub-catchment boundaries of Save Zimbabwe (BMC Limited) | 40 |
| Figure 10.1 | Process plant production and recovery 1981–2023 | 42 |
| Figure 11.1 | 40L 020 Bund block grade and drill hole comparison | 48 |
| Figure 13.1 | RGM mine layout looking south | 61 |
| Figure 14.1 | RGM processing flowsheet (Virimai, 2018) | 62 |
| Figure 16.1 | Historical (blue) gold spot price and forecast (grey) in US$/oz (Trading Economics 30 May 2024) | 67 |
| Figure 16.2 | Zimbabwean gold currency exchange rate ZiG/USD (Trading Economics, 1 July 2024) | 68 |
List of appendices
| Appendix A | Limitations statement |
viii
| 1 | Executive summary |
| 1.1 | Property description and ownership |
The Redwing Gold Mine (RGM) [or the Property] is located in Penhalonga, some 20 km north-northeast of the City of Mutare (latitude 18°52’S and longitude 32°41’E), Manicaland Province, in the Mutare Mining District of Zimbabwe. The RGM is situated within the ML 34 tenement which has a surface area of 1,254 hectares (ha).
Redwing Mining Company (Private) Limited Zimbabwe (RMC Zimbabwe), a wholly owned subsidiary of KD Mining Company (UK) Limited (KDM UK), which is a wholly owned subsidiary of Bulawayo Mining Company Limited (BMC Limited), currently holds Mining Lease (ML) 34.
The RGM is accessible to major commercial centres via a well-established network of primary asphalt roads and is accessible from the surrounding communities through secondary gravel roads. Penhalonga has a population of approximately 8,000, and Harare has a population of approximately 1.5 million.
Access to the mine site and to the ore is authorised by the applicable mining legislation, and RMC Zimbabwe’s title and mining rights. Mining exploration and exploitation works conducted or to be conducted on site are authorised in accordance with the applicable legislation, and RMC Zimbabwe’s title and mining rights.
| 1.2 | Geology and mineralisation |
The RGM is located within the Mutare Greenstone Belt (MGB), which extends from the Mozambique Belt in the east, into the granites and gneisses of the Zimbabwe Craton in the west. The geology is dominated by an east-west trending series of metavolcanics consisting of olivine cumulates, komatiites, komatiitic basalts and high iron tholeiites. The rocks are extrusive, indicated by the presence of spinifex texture and pillow lavas as well as lenses of intercalated clastic sediments and discontinuous strings of Banded Iron Formation (BIF). The MGB is bounded by the Penhalonga Diorite to the north and south.
The local geology around the RGM includes an intrusive felsite consisting of a tabular micro-granitic body. The felsite lies in the core of the Penhalonga synform and it is the folding of this micro-granitic sheet within the diorite that is believed to be responsible for the localisation of gold mineralisation within Mineralised Shear Zones (MSZ).
Mineralisation within the MSZ (narrow reefs) is distinctly limited to physical deformation that has allowed the migration of hydrothermal fluids resulting in the deposition of quartz, sulphides and gold. While comparatively high gold values are associated with grey quartz and pyrite impregnation, zones of sheared and propylitised diorite commonly form part of contiguous reef structure.
The orebody strikes east-west and dips at a locally variable but shallow angle of approximately 35° to the south. At its widest, the orebody attains a thickness of approximately 7 m. It has been worked on a strike length of more than 2,500 m.
The RGM orebody boundaries are clearly defined, and the mineralisation envelope is defined by assay cut-offs.
| 1.3 | Exploration |
Diamond core drilling is the drilling method employed at the RGM, with core sizes typically AXT (35.51 mm core diameter) and BQ (36.50 mm core diameter) for evaluation and exploration drill holes respectively. Diamond drill core is logged and sampled on a 1 m interval, depending on geology. Samples are taken to at least 1 m beyond the geologically defined mineralisation boundary in all drill holes. For underground evaluation and exploration drill holes, full core is sampled, while for surface exploration drill holes, mineralised zones only are split in half using a core splitter, with half the core being sent for assay and the other half kept for future reference.
Diamond drill core and channel samples were used for the purposes of geological modelling and Mineral Resources estimation.
Geotechnical laboratory results are sparse and incomplete.
| Project No PS213686 | WSP |
| Redwing Mine | January 2025 |
| S-K 1300 Technical Report Summary | Page 1 |
| Bulawayo Mining Company Limited |
| 1.4 | Mineral Resources estimates |
This report is prepared as a Technical Report Summary (TRS) for the Property, in accordance with the United States Securities and Exchange Commission’s (SEC) Modernized Property Disclosure Requirements for Mining Registrants as described in Subpart 229.1300 of Regulation S K, Disclosure by Registrants Engaged in Mining Operations (S-K 1300) and Item 601(b)(96).
The disclosure of Mineral Resources under this report is based upon the Qualified Person’s (QP’s) initial assessment. The Mineral Resources estimate has been defined, classified, and reported according to the guiding principles and minimum standards set out in SAMREC (2016). WSP’s view is that there are no material differences between SAMREC (206), and S-K 1300 requirements for the reporting of Mineral Resources.
The relevant Qualified Persons (QPs) are satisfied that there has been sufficient orebody knowledge work completed to support Reasonable Prospects for Economic Extraction (RPEE) at the Property from a Mineral Resources perspective. The initial assessment incorporates the QPs’ qualitative evaluation of relevant technical and economic factors likely to influence the prospect of economic extraction to establish the economic potential of the mining property or project (Section 11.3).
Evaluation data collection includes diamond drilling, channel sampling and sludge drilling.
Given there has been no mining or exploration conducted since the mine was placed on C&M, while the workings have been flooded, in the QP’s opinion the 2018 assumptions for definition of the resource base remain current.
For the purpose of demonstrating the capacity to exploit the resource as required under S-K 1300, the QPs have reviewed a high level cashflow model and are satisfied that the scale of the resource and free cashflow after operating costs will cover the cost of re-establishing access to underground workings, dewatering underground workings, surface infrastructure, and plant refurbishment/replacement. A process recovery of 90% for gold was applied for cashflow modelling consistent with recent historical averages and fixed tail estimates. Further assumptions are provided under Section 11.3 and Table 11-5.
Table 1.1 presents the underground Measured and Indicated Mineral Resources (exclusive of Mineral Reserves) reported as at 31 December 2023 on an in-situ basis.
Table 1.1 RGM underground Measured and Indicated Mineral Resource estimate as of 31 December 2023
| Category | Tonnage (Mt) | Au Grade (g/t) | Au Metal (koz) | |||||||||
| Underground | ||||||||||||
| Measured Resources | 1.45 | 2.92 | 136 | |||||||||
| Indicated Resources | 8.20 | 3.99 | 1,052 | |||||||||
| Grand Total | 9.65 | 3.83 | 1,188 | |||||||||
Notes: Mt = million tonnes; Au Grade g/t = gold grams per tonne; koz = thousand ounces.
Table 1.2 presents the underground Inferred Mineral Resources reported as at 31 December 2023 on an in-situ basis.
Table 1.2 RGM underground Inferred Mineral Resource estimate as of 31 December 2023
| Category | Tonnage (Mt) | Au Grade (g/t) | Au Metal (koz) | |||||||||
| Underground | ||||||||||||
| Inferred Resources | 15.83 | 2.61 | 1,328 | |||||||||
| Grand Total | 15.83 | 2.61 | 1,328 | |||||||||
Notes: Mt = million tonnes; Au Grade g/t = gold grams per tonne; koz = thousand ounces.
It should be noted that the underground Mineral Resources estimate for the Property is reported exclusive of Mineral Reserves. The Property does not have a current Mineral Reserve.
It should be noted that the sands (tailings) Mineral Resources estimate for the Property is not included as part of the Mineral Resources for the Property, as the RGM does not currently possess a processing facility capable of processing the sands (tailings) material.
The Mineral Resources presented in this Section are not Mineral Reserves, and do not reflect demonstrated economic viability. The reported Inferred Mineral Resources are considered too speculative geologically to have the economic considerations applied to them that would enable them to be categorised as Mineral Reserves. There is no certainty that all or any part of this Mineral Resource will be converted into Mineral Reserve.
All figures are rounded to reflect the relative accuracy of the estimates and totals may not add correctly.
| Project No PS213686 | WSP |
| Redwing Mine | January 2025 |
| S-K 1300 Technical Report Summary | Page 2 |
| Bulawayo Mining Company Limited |
Based on the geological results presented in this TRS, supported by the assumptions made by RMC Zimbabwe (presented in Section 11.3), it is the QP’s opinion that the Mineral Resources have RPEE.
| 1.5 | Mineral Reserves estimates |
Not applicable since this TRS is an Initial Assessment and no Mineral Reserves have been estimated.
| 1.6 | Capital and operating costs |
Not applicable since this TRS is an Initial Assessment and no Mineral Reserves have been estimated.
Any future estimation of Mineral Reserves and potential recommencement of operations will require the support of an additional drilling and resource definition campaign and at least a pre-feasibility to feasibility level of evaluation.
| 1.7 | Permitting requirements |
The ML is inspected on an annual basis by the Government of Zimbabwe. The area covered by the ML was surveyed and declared to be 1,254.2 ha. The ML 34 is inspected annually, and the current certificate is valid till 13 August 2025.
There is also a requirement for renewal of environmental and miscellaneous operating permits as outlined in Section 17.3 before recommencement of active mining operations. All the environmental and miscellaneous licensing is currently expired.
There has been a significant increase in artisanal gold mining activities during the period of business administration to the present day, confined to areas outside the fenced RGM tenement area. The previous business administrator (appointed July 2020, removed by court action September 2022) engaged parties under contract for this purpose, with the main contractors nominated as Betterbrands and Probatek. Poor artisanal mining practices resulted in a significant number of fatalities that posed a risk to permitting and future operation, including 22 fatalities and 8 lost time accidents in 2022, 22 fatalities and 9 lost time accidents in 2023, and 2 fatalities and 1 lost time accident to end April 2024. Following legal action to remove Betterbrands, concluded in January 2024, the control of operations has now reverted back to RMC and contract artisanal miners are in the process of being removed from site. These issues pose a risk to permitting and future operation that will need to be effectively managed.
| 1.8 | QPs’ conclusions and recommendations |
| 1.8.1 | Mineral Resources |
Based on the information presented in this TRS, the QP’s key conclusions are as follows:
| — | The level of understanding in terms of regional geology, local geology and the nature and controls on mineralisation is high and provides a solid foundation for geological modelling, Mineral Resource estimation and mining geology. |
| — | Location of samples for surface and level-infill drilling are un-reliable due to errors with collar location and downhole survey. |
| — | Mineral Resource estimates are currently transitioning from paper-based estimates to digital estimates. |
| — | Mineral Resource estimates were completed on an unconstrained basis. |
| — | Estimates utilised all available samples i.e., channel, sludge, diamond drill core etc. |
| — | Dry bulk density (BD) of 2.7 tonnes per cubic metre (t/m3) assigned for all domains. |
| Project No PS213686 | WSP |
| Redwing Mine | January 2025 |
| S-K 1300 Technical Report Summary | Page 3 |
| Bulawayo Mining Company Limited |
| — | Validation of the Mineral Resource estimates has not been reported. Standard industry practice is to conduct both visual and statistical validation of estimates and present the findings of this work in the Mineral Resource report to give the reader an appreciation of the robustness of the estimates. |
| — | Estimation within modelled mineralisation domains (constrained estimate) would likely result in an increase in contained metal. |
| — | Gold price increase have not been reflected in the reporting Au Cut-off Grade (COG). A lower reporting cut-off grade may lead to an increase in contained metal. |
| — | The on-site assay laboratory is well-equipped and maintained and is considered suitable for the work that it is used for. |
| — | The drilling, sampling, assay and Quality Assurance and Quality Control (QAQC) techniques used for both exploration and resource definition are consistent with standard industry practice and are considered appropriate for the purposes of geological modelling and Mineral Resource estimation. More detailed information on core recovery is however required. |
| — | Data and database management requires further work. |
| — | The COG used for Mineral Resource estimation seem reasonable on face value, but the methodology used for determination of these values has not been reported and requires further explanation. |
| — | The method used for high-grade cutting is deemed appropriate and consistent with industry practice. |
| — | Mineral Resource estimates used a combination of paper-based estimation methods and digital estimation |
| — | The Mineral Resources Mineral Reserves (MRMR) technical report developed by RMC Zimbabwe covers a number of areas in sufficient detail, however; a number of areas require more detail to give the reader a more thorough understanding of the work that has been conducted, the results of the work and any inherent risks to the Mineral Resource estimate. |
| — | Mining, processing, and market modifying factors, study assumptions and parameters are used to establish RPEE for the reporting of Mineral Resources. No significant risks exist that could impact the reliability and/or confidence of Mineral Resources estimates. |
Based on the information presented in this TRS, the QP’s key recommendations are as follows:
| — | Data and database management is an area that requires further work. The RGM would benefit from the introduction of a corporate database, with inbuilt validation routines and reporting functionality, to assist with what is a large quantity of geological information. |
| — | Review lithology, structural and mineralisation modelling practices. |
| — | Data analysis is conducted; however, it is recommended that for future Mineral Resource estimates, deposit wide Exploratory Data Analysis (EDA) is undertaken prior to estimation, to ensure data is fit for purpose for geological modelling and Mineral Resource estimation. |
| — | It is recommended that a succinct geological modelling and Mineral Resource estimation process flow is developed and followed for future Mineral Resource estimates. |
| — | It is recommended that Mineral Resource estimation is constrained to modelled mineralisation domain wireframes, using an appropriate Au cut-off grade. |
| — | All paper-based estimation techniques should be converted to computer-based (digital) as soon as possible. |
| — | A comparison between BD values determined from underground grab samples, and drill core should be undertaken to ensure that the mean values used for Mineral Resource estimation are appropriate, and that bias is not being incorporated into the Mineral Resource estimate. |
| Project No PS213686 | WSP |
| Redwing Mine | January 2025 |
| S-K 1300 Technical Report Summary | Page 4 |
| Bulawayo Mining Company Limited |
| — | Validation of the Mineral Resource estimates produced, or at least the documentation of validation work undertaken is an area that requires further work. Standard industry practice is to conduct both visual and statistical validation of estimates and present the findings of this work in the Mineral Resource report, to give the reader an appreciation of the robustness of the estimates. |
| — | RPEE have been considered, and the parameters used are considered reasonable. |
| — | Review Mineral Resource classification methodology and block assignment. |
| — | The Mineral Resource report developed covers a number of areas in sufficient detail; however, some areas require more detail to give the reader a more thorough understanding of the work that has been conducted, the results of the work and any inherent risks to the Mineral Resource estimate. |
| — | Mineral Resource reconciliation practices should be reviewed, and a system implemented that provides a measure of Mineral Resource estimate performance. Planned versus actual resource tonnages and grades should be developed and updated each time a Mineral Resource estimate is completed. It is recommended that mined development and production be reconciled monthly, and stope close-out reports be developed for each completed stope. |
| — | A Mineral Resource update, according to industry best practice, should be completed prior to re-establishment of commercial production. |
| — | An underground drilling program, collared from footwall drives, aimed at increasing confidence in the existing resource should be undertaken. |
| — | Subsequent to future MRM updates, a stope optimisation exercise is recommended. Stope optimisation allows for the rapid development of valid stope shapes according to specified criteria. |
| 1.8.2 | Mineral Reserves |
Not applicable since this TRS is an Initial Assessment and no Mineral Reserves have been estimated.
For the historical 2018 Mineral Reserve estimate, the QP provides comment as follows:
| — | QP’s view is that the Mineral Reserve estimate represents a low level of conversion of the existing resource base as a function largely of those blocks that are readily accessible and meet the technical and economic constraints, such as pay limits for viable economic extraction. The QP notes that the relatively low inventory might have difficulty supporting both the capital and operating costs without the support from additional sources and that the average grades remaining are considerably higher than recent historical mining and processing performance at 2.7 g/t Au for 2016-2018. |
| — | It should be noted that a Mineral Reserve has not been estimated and reported since June 2018 as the RGM has been on C&M since 1 April 2019. Due to the positive change in gold price between 30 June 2018 (approx. US$1,250/oz) and 31 December 2023 (3-year trailing average US$1,848/oz), it is likely that a Mineral Reserve estimated at end December 2023 would be reported at a lower pay-limit, resulting in an increase in Mineral Reserve tonnages and therefore gold content. |
| — | The process of estimating the mineral reserve for RGM is well developed and relatively straight forward. |
| — | The Mineral Resource estimated for the RGM is significant and deserving of a long-term plan for increased exploitation and production ramp-up. This can be facilitated by improving the Mineral Reserve base estimate for mining. It should include consideration of process plant upgrade or replacement (improved throughput and recovery) and options for modernising the underground operation. Surface mining opportunities should also be examined. |
| — | The current methodology for estimation of Mineral Reserves appear to conform with standard African mining industry approaches but will benefit from clarification and upgrade of the approach. |
| Project No PS213686 | WSP |
| Redwing Mine | January 2025 |
| S-K 1300 Technical Report Summary | Page 5 |
| Bulawayo Mining Company Limited |
For the historical 2018 Mineral Reserve estimate, the QP provides comment as follows:
| — | The 2018 Mineral Reserve estimate will require update to reflect significant changes in gold price, operating costs and capital costs to support any future proposal to recommence mining operations. |
| — | The mine could consider amalgamating the separate models to assist with interpretation and processing. |
| — | WSP understands that wireframe surfaces are developed for the purpose of the Mineral Resource estimation and subsequently converted by spreadsheet calculation using modifying factors and pay limits to ascertain final reserve estimates. Industry recommended practice also includes preparation of development and stoping wireframes representing the material planned to be mined, inclusive of allowances for mining method, pillars and minimum mining widths. These wireframe solids can then be used to directly interrogate tonnage and grade from the block model by category and facilitate subsequent automated scheduling and animation using software such as Mine24D™ and Deswik™. RMC Zimbabwe could consider implementing this approach. |
| — | Consideration could also be given to application of pay limits, minimum mining width, BF and APF on a block-by-block basis commensurate with the technical and economic merits of each stoping block. |
| — | The QP recommends reviewing individual stope performance to test and vary the relatively nominal assumptions. This could include modelling of dilution skins and using block model grades. |
| — | Prepare a LOM design to support a detailed mining schedule. Consider using industry leading practice to generate 3D mine designs linked to physical quantity and cost schedules. |
| — | Identify access and requirements and estimate pay limits for each block. Annotate and exclude those blocks that are not accessible or economic. |
| — | Where possible, prioritise high value (Au grade) targets for escalated development and earlier production as this may have a significant impact on project returns. |
| — | Prepare a detailed narrative report to support the annual LOM plan. |
| — | Identify those areas where more mechanised long hole stope mining may be introduced to improve productivity and unit cost. A structured plan is required that explains how the proposed production rates will be achieved. This will require a pre-feasibility to feasibility study level of assessment. |
| — | Employee numbers averaging 872 at peak production appear nominal and will need to be adjusted to reflect the approach and mining method(s) adopted. |
| — | Estimates for development advance at the rate of 15.6 km per annum appear nominal rather than based on a clear and detailed plan. |
| — | Drill metres (jackhammer only) also appear to be nominal and underestimated if based on 1.33 t/m drilled. |
| — | Power outage (10% of hours) issues that plague the mine are assumed to be resolved after two years. A plan needs to be put in place that clearly identifies how this will be achieved. |
| Project No PS213686 | WSP |
| Redwing Mine | January 2025 |
| S-K 1300 Technical Report Summary | Page 6 |
| Bulawayo Mining Company Limited |
| 2 | Introduction |
| 2.1 | Registrant information |
This Technical Report Summary (TRS) is for the Bulawayo Mining Company Limited (BMC Limited) owned Redwing Gold Mine (RGM) [the Property], located in Manicaland Province in eastern Zimbabwe, and was prepared by the Qualified Persons (QPs) for BMC Limited.
BMC Limited is a private company incorporated in the United Kingdom (UK) and is a wholly owned subsidiary of Metallon Corporation Limited (UK) [Metallon]. KD Mining Company (UK) Limited (KDM) is a private company incorporated in the UK and is a wholly owned subsidiary BMC Limited.
Bulawayo Mining Company (Private) Limited Zimbabwe (BMC Zimbabwe), Mazowe Mining Company (Private) Limited Zimbabwe (RMC Zimbabwe), and Redwing Mining Company (Private) Limited Zimbabwe (RMC Zimbabwe) are responsible for the management of mineral assets located in Zimbabwe, the principal activities of which include exploration, development and operation of precious metals mineral assets.
RMC Zimbabwe is directly responsible for the day-to-day management of the mining operations and holds Mining Lease (ML) 34. The area covered by ML 34 has a surface area of 1,254 hectares (ha) [Figure 3.2] (BMC 2023a).
Figure 2.1 presents the corporate structure of BMC Limited.
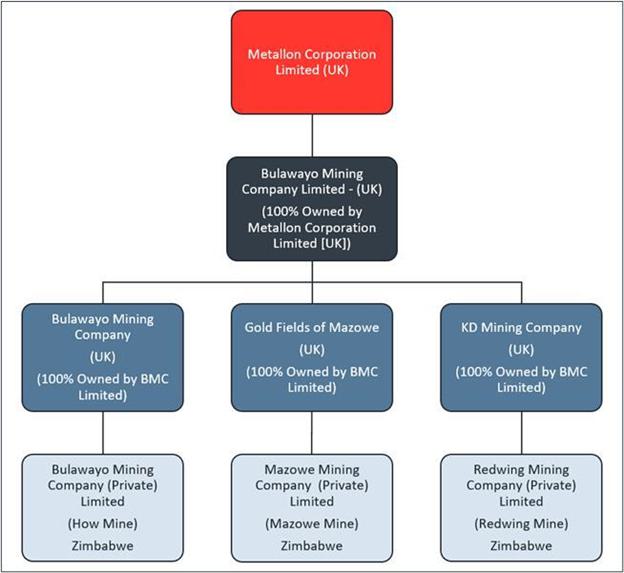
Figure 2.1 BMC Limited corporate structure
| Project No PS213686 | WSP |
| Redwing Mine | January 2025 |
| S-K 1300 Technical Report Summary | Page 7 |
| Bulawayo Mining Company Limited |
In October 2002, Metallon (herein referred to as BMC Limited) acquired a portfolio of mineral assets from a holding subsidiary of Lonmin plc (Lonmin), known as Independence Mining (Private) Limited.
This portfolio of mineral assets located in Zimbabwe consists of three mining properties located within a significant land package consisting of some 66.02 square kilometres (km2) in area. The mining properties comprise three separate underground gold mines, namely: How, Mazowe, and Redwing. Each mining property is serviced by its own dedicated processing facilities and accompanying infrastructure. BMC Limited considers there to be significant exploration potential at each of the mining properties.
From acquisition of the assets in 2002 until 2006, gold production steadily increased with gold production peaking in 2005 at approximately 156,000 ounces (oz) of gold, making BMC Limited Zimbabwe’s largest gold producer.
Due to political unrest and hyperinflation in 2007, BMC Limited’s mining activities in Zimbabwe ceased and all mines were placed on Care and Maintenance (C&M). In 2009, mining activities recommenced, with many of the mines requiring rehabilitation work.
Operations were suspended at the Mazowe Gold Mine (MGM) on 31 December 2018, and at the RGM on 30 March 2019 due to general economic challenges. Both mines were placed on a Supreme Court ordered Corporate Rescue, with the MGM commencing 20 February 2020, and the RGM commencing 23 July 2020. Both Corporate Rescue proceedings were nullified on 7 October 2021 for the MGM, and 5 September 2022 for the RGM.
During the Corporate Rescue period, Betterbrands Mining Company (Pvt) Ltd (BBM) was engaged as a tributor to mine on Mining Lease (ML) 34 (Virimai 2022). On 8 March 2024, the non-standard tribute agreement with BBM was cancelled, and BBM was evicted from the RGM.
In January 2024, 15 artisanal miners were trapped for a period of three days at the RGM.
Gold production from RGM since 2018 is as follows (RMC Operation Reports):
| — | 2018: 6,787 oz. |
| — | 2019: 214 oz. |
| — | 2020: 1,348 oz. |
| — | 2021: 1,391 oz. |
| — | 2022: 2,237 oz. |
| — | 2023: 2,741 oz. |
BMC Limited’s forward strategy is to produce 300,000 oz of gold per annum through expansion across all mines, and through a broader acquisition strategy across Africa.
BMC Limited is pursuing a focused expansion strategy throughout Africa, with the aim of securing prospective green minerals assets in Zimbabwe, and the Democratic Republic of Congo (DRC).
| 2.2 | Terms of reference and purpose |
The purpose of this TRS is to report Mineral Resources, and Mineral Reserves for the Property effective as of 31 December 2023. The TRS utilises:
| — | Australian English spelling. |
| — | Metric units of measure. |
| — | Grades presented in grams per tonne (g/t). |
| — | Co-ordinate system presented in metric units using Cape/Lo29. |
| — | United States Dollars (USD). |
| Project No PS213686 | WSP |
| Redwing Mine | January 2025 |
| S-K 1300 Technical Report Summary | Page 8 |
| Bulawayo Mining Company Limited |
Summary Mineral Resources in Table 1.1 and Table 1.2 are presented based on a BMC Limited equity ownership basis (100%). No current Mineral Reserves as at 31 December 2023 have been estimated.
Key acronyms and definitions used in this TRS include those items listed in Table 2.1.
Table 2.1 List of acronyms and abbreviations used in this TRS
| Acronym/abbreviation | Description | |
| AAS | Atomic Absorption Spectroscopy | |
| amsl | Above mean sea level | |
| APF | Assay plan factor | |
| ASCII | American Standard Code for Information Interchange | |
| Au | Gold | |
| BBM | Betterbrands Mining Company (Pvt) Ltd | |
| ⁰C | Degrees Celsius | |
| BCF | Block Call Factor | |
| BD | Bulk Density | |
| BIF | Banded Iron Formation | |
| BF | Block Factor | |
| BMC Limited | Bulawayo Mining Company Limited | |
| BSV | Bernheim-Storis-Vesuvius | |
| CIP | Carbon in Pulp | |
| cm | Centimetres | |
| C&M | Care and Maintenance | |
| COG | Cut Off Grade | |
| CRM | Certified Reference Material | |
| CV | Coefficient of Variation | |
| DRC | Democratic Republic of Congo | |
| EIA | Environmental Impact Assessment | |
| EMP | Environmental Management Plan | |
| ER | Extraction Ratio | |
| g/cm3 | Grams per cubic centimetre | |
| g/t | Grams per tonne | |
| ha | Hectares | |
| ID2 | Inverse squared distance | |
| k | Thousand | |
| kg | Kilograms | |
| KDM | KD Mining Company (UK) Limited | |
| km | Kilometres | |
| km2 | Square kilometres | |
| koz | Thousand ounces | |
| kt | Thousand tonnes | |
| ktpa | Thousand tonnes per annum |
| Project No PS213686 | WSP |
| Redwing Mine | January 2025 |
| S-K 1300 Technical Report Summary | Page 9 |
| Bulawayo Mining Company Limited |
| Acronym/abbreviation | Description | |
| ktpm | Thousand tonnes per month | |
| kV | Kilovolts | |
| l/s | Litres per second | |
| LDV | Low Density Villages | |
| LOM | Life of Mine | |
| m3 | Cubic metre | |
| Ma | Million years | |
| MAR | Mean Annual Run-off | |
| MCF | Mine Call Factor | |
| MGB | Mutare Greenstone Belt | |
| MGM | Mazowe Gold Mine | |
| ML | Mining Lease | |
| mm | millimetres | |
| Moz | Million ounces | |
| MRMR | Mineral Resources Mineral Reserves | |
| MSZ | Mineralised Shear Zones | |
| Mt | Million tonnes (metric) | |
| Mtpa | Million tonnes per annum | |
| MVA | Megavolt-ampere | |
| OK | Ordinary Kriging | |
| oz | Ounces | |
| QP | Qualified Person | |
| RGM | Redwing Gold Mine | |
| RMC Zimbabwe | Redwing Mining Company (Private) Limited | |
| RPEE | Reasonable Prospects for Economic Extraction | |
| RTGS | Real time gross settlement | |
| SAMREC | South African Mineral Resource Committee | |
| SD | Standard Deviation | |
| SRK | SRK consulting (UK) Ltd | |
| SRKSA | SRK Consulting (South Africa) (Pty) Ltd | |
| t | Tonnes | |
| t/m | Tonnes per metre | |
| t/m3 | Tonnes per cubic metre | |
| TBL | Terminal Benefits Liability | |
| TRS | Technical Report Summary | |
| TSF | Tailings Storage Facility | |
| μm | Micrometre | |
| USD | United States Dollar | |
| V | Volts | |
| WSP | WSP Australia Pty Limited | |
| Wt.% | Weight percent | |
| ZETDC | Zimbabwe Electricity Transmission and Distribution Company | |
| ZiG | Zimbabwe gold currency |
| Project No PS213686 | WSP |
| Redwing Mine | January 2025 |
| S-K 1300 Technical Report Summary | Page 10 |
| Bulawayo Mining Company Limited |
| 2.3 | Sources of information |
This TRS relies upon various reports and other material prepared by BMC Limited, and BMC Limited’s staff and consultants as provided to WSP. This data and information have been supplemented with information in the public domain, and through information gathered during a site inspection by WSP in May 2024 (Section 2.4).
While WSP has reviewed the data and other information contained in the reports and other material provided to it and is not aware of any reason to doubt that such data and information is complete and accurate, excluding Golder (2021), WSP was not responsible for the preparation of those reports and other material.
WSP has taken reasonable care to ensure that the information contained in this TRS is in accordance with the facts and information available to it and is unaware of any omission likely to affect its import. In this regard, the attention of any reader of the TRS is specifically directed to Section 24, and Appendix A.
| 2.4 | Personal inspection |
Information in this TRS has been prepared under the supervision of the following QPs:
| — | Aaron Radonich, Fellow of the Australasian Institute of Mining and Metallurgy (FAusIMM, Member Number 221172), Principal Geologist, WSP. Aaron is responsible for RGM Mineral Resources. The date of the last personal inspection was May 2024. |
| — | Allan Blair, Member of the Australasian Institute of Mining and Metallurgy (FAusIMM, Member Number 102240), Principal Mining Engineer, WSP. Allan is responsible for RGM Mineral Reserves. The date of the last personal inspection was May 2024. |
Table 2.2 presents a tabulation of the QPs, their personal inspections, and their areas of responsibility.
| Table 2.2 | List of QPs |
| QP | Qualifications/Affiliation | Date of Personal Inspection | Areas of Responsibility | |||
| Aaron Radonich | Fellow AusIMM, PGCert Geostatistics, BSc (Hons.), BSc | May 2024 | Sections 1.1, 1.2, 1.3, 1.4, 1.7, 1.8.1, 2, 3, 4, 5, 6, 7, 8, 9.1, 11, 20, 21, 22,1, 23.1, 24 and 25. | |||
| Allan Blair | FAusIMM, MBA, BSc, BAppSc Mining Engineering | May 2024 | Sections 1.5, 1.6, 1.8.2, 5, 9.2, 9.3, 9.4, 9.5, 10, 12, 13, 14, 15, 16, 17, 18, 19, 22.2 and 23.2. |
| 2.5 | Previously filed Technical Report Summaries |
This is the first TRS filed for the Property and therefore does not update a previously filed TRS.
| 2.6 | WSP declaration |
The opinions of QPs in the employ of WSP contained herein and effective 31 December 2023, are based on information collected throughout the course of investigations by the QPs. The information in turn reflects various technical and economic conditions at the time of preparing the TRS. Given the nature of the mining business, these conditions can change significantly over relatively short periods of time. Consequently, actual results may be significantly more or less favourable.
This TRS may include technical information that requires subsequent calculations to derive sub-totals, totals, and weighted averages. Such calculations inherently involve a degree of rounding, and consequently introduce a margin of error. Where these occur, the QPs do not consider them to be material.
Neither WSP, nor the QPs responsible for this TRS, are insiders, associates, or affiliates of BMC Limited or any of its subsidiaries. The results of the technical review by the QPs are not dependent on any prior agreements concerning the conclusions to be reached, nor are there any undisclosed understandings concerning any future business dealings.
| Project No PS213686 | WSP |
| Redwing Mine | January 2025 |
| S-K 1300 Technical Report Summary | Page 11 |
| Bulawayo Mining Company Limited |
| 3 | Property description |
| 3.1 | Property location |
The RGM is located in Penhalonga, some 20 km north-northeast of the City of Mutare (latitude 18°52’S and longitude 32°41’E), Manicaland Province, in the Mutare Mining District of Zimbabwe (Figure 3.1).
The RGM is located approximately 265 km southeast of the capital city of Harare.
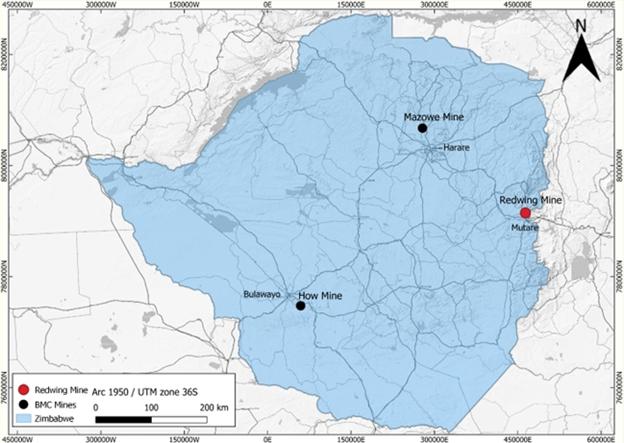
Figure 3.1 Property location map
| 3.2 | Title and mineral rights |
RMC Zimbabwe holds ML 34. The area covered by the ML was surveyed in 2015 as having a surface area of 1,254 hectares (ha). Cases of illegal gold mining activities have been reported in some sections of the ML, including along the Mutare River (KDM 2018).
| Project No PS213686 | WSP |
| Redwing Mine | January 2025 |
| S-K 1300 Technical Report Summary | Page 12 |
| Bulawayo Mining Company Limited |
Figure 3.2 presents the ML 34 boundary.
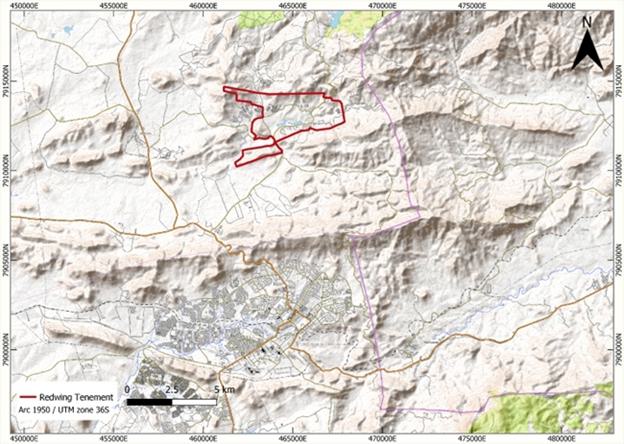
Figure 3.2 RGM ML 34 boundary
While WSP has referred to tenement holdings in this TRS, such reference is for convenience only and may not be complete or accurate. WSP is not expert in tenement management and the reader should not rely on information in this TRS relating to the current ownership and legal standing of the tenements or any encumbrances impacting on those tenements. This TRS assumes that all tenements and tenement applications are in good standing and free of all encumbrances other than those set out in this TRS.
| 3.3 | Encumbrances |
There are no known significant encumbrances to the Property that would impact the current Mineral Resources or Mineral Reserves. Risks to access, title or right to perform work.
| 3.4 | Risks to access, title, or right to perform work |
Access to the mine site and to the ore is authorised by the applicable mining legislation, and RMC Zimbabwe’s title and mining rights (Section 3.2). Mining exploration and exploitation works conducted or to be conducted on site are authorised in accordance with the applicable legislation, and RMC Zimbabwe’s title and mining rights (Section 3.2). Other required permits and authorisations (e.g., environmental, building, etc.) are applied for by RMC Zimbabwe in accordance with the applicable legislation.
| Project No PS213686 | WSP |
| Redwing Mine | January 2025 |
| S-K 1300 Technical Report Summary | Page 13 |
| Bulawayo Mining Company Limited |
| 3.5 | Agreements and royalties |
In 2022, the government of Zimbabwe has promulgated new regulations through Statutory Instrument 189 of 2022 to the effect that mineral royalties are to be paid partly in kind and partly in monetary form. The mineral royalties are collected from minerals specified in terms of section 49(1)(c1) of the Reserve Bank of Zimbabwe Act [Chapter 11:15] deemed to be components of the reserves maintained by the Reserve Bank of Zimbabwe. Minerals include but are not limited to gold, diamonds, platinum group metals, and lithium. These regulations have also caused timeous amendments to the Finance Act and the Reserve Bank of Zimbabwe Act to ensure the cooperation in application of legislation (BMC 2023)
In 2024, the monetary component was revised. Royalties remitted to the Zimbabwe Revenue Authority in respect of gold and those minerals specified are paid based on 50% in kind and 50% in monetary form. With regards the “in kind component”, miners submit actual minerals they would have extracted. The 50% monetary component would be paid as follows:
| — | 37.5% in the Zimbabwe Gold (ZiG) currency. |
| — | 12.5% in foreign currency (RBZ 2024). |
Prior to the promulgation of these regulations, royalties were paid only in monetary form.
A US$21 per kilogram (/kg) realisation fee is also charged for gold lodged with Fidelity Printers and Refiners (BMC 2023).
| Project No PS213686 | WSP |
| Redwing Mine | January 2025 |
| S-K 1300 Technical Report Summary | Page 14 |
| Bulawayo Mining Company Limited |
| 4 | Accessibility, climate, local resources, infrastructure, and physiography |
| 4.1 | Topography, elevation, and vegetation |
The RGM sits at an altitude of approximately 1,200 m above mean sea level (amsl). The RGM is situated close to the Mutare River which flows south-westerly into the Odzi River, and provides a source of potable water, as well as being considered the primary recharge source of the underground water system, which serves as the key water source for the RGM processing facilities (SRK 2012).
The vegetation type in the area shows a strong lithological influence, where Brachsygeia Species (masas and mpfuit) cover the majority of the greenstone belt, while Uapaca Kirkiana (sugar plum) is dominant on the granites. Hyparrhenia is the dominant grass species (SRK 2012).
Climatic conditions in the area ensure a perennial flow of these two major rivers and their associated tributaries (KDM 2018).
| 4.2 | Access |
The RGM is linked to major commercial centres by a well-established network of primary asphalt roads and is accessible from the surrounding communities through secondary gravel roads (KDM 2018).
Penhalonga has a population of approximately 8,000 and Harare has a population of approximately 1.5 million.
| 4.3 | Proximity to population centres |
The RGM is located in Penhalonga, some 20 km north-northeast of the City of Mutare (latitude 18°52’S and longitude 32°41’E), Manicaland Province, in the Mutare Mining District of Zimbabwe. The RGM is located some 265 km southeast Harare. The mine is linked to major commercial centres by a well-established network of primary asphalt roads and is accessible from the surrounding communities through secondary gravel roads.
Harare is serviced by Robert Gabriel Mugabe (RGM) International Airport, operated by the Airport Company of Zimbabwe (Private) Limited (ACZ), which has the capacity to handle 2.5 million passengers per annum (ACZ 2024). The National Railways of Zimbabwe (NRZ) provides both freight services (NRZ 2024a), and passenger services (NRZ 2024b).
| 4.4 | Climate |
The RGM operates continuously throughout the year, with no interruptions dues to seasonal changes.
The RGM lies in natural farming region I, of Zimbabwe’s Agro-ecological farming regions. The RGM is situated on the high veldt in the eastern highlands of Zimbabwe. Winters are generally cold with mild summers. Rainfall is distinctly higher than the rest of the country which under normal climatic conditions is evenly distributed around the year. Despite its tropical location, the city has a temperate climate. The average annual temperature is 19°C. The coldest month is July (minimum 6°C and maximum 20°C) and the hottest month is October (minimum 16°C and maximum 32°C). The annual rainfall is 818 mm.
Rain falls mostly in the months December to February although heavy showers are possible before and after this period. The wettest month on record was January 1926 which received 580 mm while January 1991 received only 24 mm. Average rainfall received over the past 5 years is 1,000 mm (MGZ 2019).
| Project No PS213686 | WSP |
| Redwing Mine | January 2025 |
| S-K 1300 Technical Report Summary | Page 15 |
| Bulawayo Mining Company Limited |
Figure 4.1 presents climate statistics for Penhalonga, Zimbabwe.
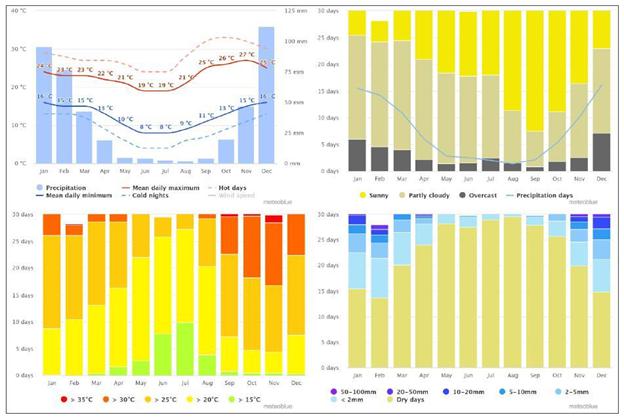
| Figure 4.1 | Climate statistics for Penhalonga, Zimbabwe (Meteoblue, 2024) |
| 4.5 | Local resources and existing infrastructure |
| 4.5.1 | Power supply |
Power is supplied to RGM by a 33 kilovolts (kV) supply from the power utility company, Zimbabwe Electricity Transmission and Distribution Company (ZETDC). The installed capacities of the mine substations are as follows (BMC Limited):
| — | Redwing: | 7.5 Megavolt-ampere (MVA). |
| — | Old West: | 1 MVA. |
| — | Rezende: | 2 MVA. |
| 4.5.2 | Water supply |
Domestic water is diverted from the Mutare River and is transported by gravity through a concreted trench to a sump, where it is pumped to the RGM water treatment plant. The RGM water treatment plant consists of two 212 cubic metres (m3) tanks (4 and 5) for settling sludge by addition of aluminium sulphate. Water then passes through three 19 m3 sand filter tanks before flowing into the 212 m3 fresh water holding tank (9), where it is chlorinated prior to distribution. Tanks 1, 2, and 3 are used for temporary water treatment during cleaning or maintenance of tanks 4, 5, and 9 (Golder 2021).
A 6-inch take-off line runs to Old West, from which a 4-inch branch feeds the RGM village and other take-offs feed the clinic, workshops, administration offices, compressors and the Low Density Village houses (Golder 2021).
A separate 4-inch line runs to feed the Liverpool High Density Village, before it proceeds as a 3-inch line to feed the Rezende houses. The total volume of water processed is 95 m3/hour (Golder 2021).
| Project No PS213686 | WSP |
| Redwing Mine | January 2025 |
| S-K 1300 Technical Report Summary | Page 16 |
| Bulawayo Mining Company Limited |
| 4.5.3 | Personnel |
General labour force is available within the surrounding communities. For specialised skills, advertisements are advertised in the public press and will usually be sourced from any part of the country.
| 4.5.4 | Suppliers |
Consumables and spares are sourced locally with a few exceptional cases where some are imported, especially from South Africa.
| 5 | History |
| 5.1 | Exploration and ownership history |
Various portions of the present day RGM property are part of the shallow historical workings that exploited the numerous mineralised shear zones (MSZ) located above the water table. In 1889, Baron de Rezende and James Henry Jeffreys pegged the Rezende Mineralised Shear Zone (the Rezende Mine) and began mining operations. In 1909, Rezende Mines Ltd. (Rezende) was formed to operate the mine and other deposits in close vicinity. Operations continued until 1954, when Rezende Mine closed. There was little activity until 1955, when the Rezende Mine was acquired by Independence Gold Mining (Pvt) Ltd. (Independence). Independence was subsequently acquired by Lonrho Zimbabwe (Pvt) Ltd. (Lonrho) in 1980 (KDM 2018).
The Old West Mine was initially pegged in 1899; however, mining did not commence until 1909, before ceasing operations in 1950. The nearby RGM was worked down to the water table between 1904 and 1905, before ceasing operations in 1909. Rezende acquired the claims covering the RGM in 1909, sunk a shaft and resumed mining operations, which again ceased in 1919. In 1968, Mutare Exploration Co. Ltd. (Mutare) acquired both the RGM and Old West properties and initiated a diamond drilling campaign to cover the Felsite ore body. Between 1975 and 1978, Independence acquired the properties prior to a takeover by Lonrho in 1980 (KDM 2018).
An exploration drilling campaign targeting mostly the Felsite mineralisation was conducted in close proximity to the RGM in the early 1980’s. The drilling covered an approximate area of 9 km2 (6 km by 1.5 km), and a total of 22,883 m of drilling was completed. The drill holes were on a widely spaced irregular grid. The area north of the RGM that was also covered by this exploration drilling is a target for future in-fill drilling aimed at increasing resource confidence.
Lonmin plc (Lonrho) relinquished ownership of Independence to Metallon Resources of South Africa in October 2002. Independence then changed the name to Metallon Gold Zimbabwe (Pvt) Ltd in September 2004 (KDM 2018).
In 2008, the RGM was flooded. The causes of flooding were attributed to a shortage of foreign currency, emanating from the 2007/2008 economic meltdown, prolonged power outages and ZESA’s inability to supply adequate power to the region. The situation was worsened by aged pumps that were due for replacement. Consequently, in September 2008, the mine suspended operations as working areas and other critical equipment were submerged. The mine subsequently acquired five submersible pumps in the first quarter of 2010, each pumping an average of 140 cubic metres per hour (m3/hour). Two pumps were installed in the Rezende Shaft, two in the Redwing Main Shaft and one in the Old West Shaft. The pumps were commissioned in March 2010 (KDM 2018).
The RGM resumed operations in September 2009, with re-treatment of tailings (sands) dumps i.e., the Duiker and Concentrate Dumps. This re-treatment ceased on 25 September 2013, mainly due to depressed feed grades that rendered re-processing of sands uneconomic (KDM 2018).
Having pumped water to below 6 Level, the RGM resumed underground mining by instituting development on 4 Level on 21 February 2015. This was in preparation of production of gold from underground, that eventually commenced in November 2015 (KDM 2018).
Following an organisational re-structuring process, which became effective from 1 June 2016, the Redwing Mine now falls under The King’s Daughter Mining Company (Private) Limited (KDM), a wholly owned subsidiary of Metallon (KDM 2018).
Access for men and materials to and from the underground workings is through the South Winze Shaft to 6 Level and rock hoisting to surface is via the Redwing Main Shaft. The Rezende Shaft to the east is used for de-watering while to the west of the RGM, the Old West No. 1 and 2 shafts are not used (KDM 2018).
The RGM was placed on C&M on 1 April 2019.
A Supreme Court ordered Corporate Rescue was implemented on 23 July 2020. During the Corporate Rescue period, BBM was engaged as a tributor to mine on ML 34 (Virimai 2022).
| Project No PS213686 | WSP |
| Redwing Mine | January 2025 |
| S-K 1300 Technical Report Summary | Page 17 |
| Bulawayo Mining Company Limited |
Mine dewatering was maintained until suspended on 23 December 2020, due to power supply disconnections. The water level has since risen to 47.3 m from the Redwing Shaft surface collar (or 71.1 m above 4 Level) and has been stagnant at that level since 19 April 2021. Any recommencement of mining operations will require dewatering to access Mineral Resources and Mineral Reserves.
The Corporate Rescue proceedings were nullified on 5 September 2022.
In January 2024, 15 artisanal miners were trapped for three days at the RGM.
On 8 March 2024 the non-standard tribute agreement with BBM was cancelled, and BBM was evicted from ML 34.
| 5.2 | Production history |
Total gold produced from the RGM between 1981 and 2023 is approximately 0.65 million ounces (Moz). Figure 5.1 presents total gold production from the RGM for the period 1981-2023.
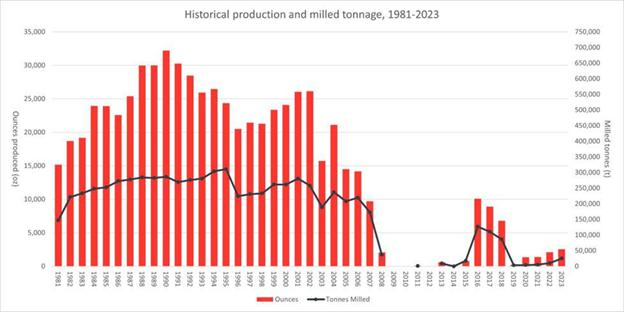
| Figure 5.1 | RGM total gold production 1981–2023 |
| Project No PS213686 | WSP |
| Redwing Mine | January 2025 |
| S-K 1300 Technical Report Summary | Page 18 |
| Bulawayo Mining Company Limited |
| 5.3 | Production reconciliation |
The Property’s Mineral Resources as of the end of the last fiscal year 2023 compared to the 2022 fiscal year are compared in Table 5.1. While there has been minor adjustment of COG between 2022 and 2023 there was no change between the Mineral Resources for 2022 and 2023. There has been no statement of Mineral Reserves for 2022 and 2023 and therefore no requirement for comparison.
| Table 5.1 | Mineral Resource summary comparison end December 2022 to end December 2023 |
| 31 December 2022 | 31 December 2023 | Var. (%) | ||||||||||||||||||||||||||
| Category | Tonnes
(kt) | Grade (Au g/t) | Au
(koz) | Tonnes
(kt) | Grade (Au g/t) | Au
(koz) | Au (koz) | |||||||||||||||||||||
| Total Mineral Resources | ||||||||||||||||||||||||||||
| Measured Mineral Resources | 1,450 | 2.92 | 136 | 1,450 | 2.92 | 136 | 0 | % | ||||||||||||||||||||
| Indicated Mineral Resources | 8,200 | 3.99 | 1,052 | 8,200 | 3.99 | 1,052 | 0 | % | ||||||||||||||||||||
| Total M+I Mineral Resources | 9,650 | 3.83 | 1,188 | 9,650 | 3.83 | 1,188 | 0 | % | ||||||||||||||||||||
| Inferred Mineral Resources | 15,830 | 2.61 | 1,328 | 15,830 | 2.61 | 1,328 | 0 | % | ||||||||||||||||||||
| Total Mineral Resources | 25,480 | 3.07 | 2,515 | 25,480 | 3.07 | 2,515 | 0 | % | ||||||||||||||||||||
Notes: Numbers are rounded.
| 5.4 | Aggregate fiscal year production |
Since the mine has been on C&M since April 2019, there has been no material production from Mineral Resources over the past 3 years.
| 5.5 | Exploration and development by previous owners or operators |
Previous exploration and development is discussed in Section 5.1.
| 5.6 | Liabilities |
Inspection of the Financial Statements for the year ended 31 December 2022 indicates RMC carries substantial liabilities that total US$8.88 M comprising:
| — | Non-Current Liability for an “Environmental rehabilitation provision” for US$3.007 M |
| — | Current Liability for “Trade and other payables” for US$5.873 M. |
Inspection RMC records of current assets and current liabilities as at end February 2024 reveals:
| — | Current Assets comprising “Other Debtors” for US$2.452 M |
| — | Current Liabilities of US$7.214 M comprising “Trade Creditors” US$1.939 M, “Statutory Payments” US$2.211 M and “Other” US$3.064 M. |
| Project No PS213686 | WSP |
| Redwing Mine | January 2025 |
| S-K 1300 Technical Report Summary | Page 19 |
| Bulawayo Mining Company Limited |
| 6 | Geological setting, mineralisation, and deposit |
| 6.1 | Regional geology |
| 6.1.1 | Mozambique Greenstone Belt |
The RGM is located within the Mutare Greenstone Belt (MGB) extends from the Mozambique Belt in the east, into the granites and gneisses of the Zimbabwe Craton in the west. It forms a tapering triangular shape from approximately 20 km in the east to less than 3 km in the west. The grade of metamorphism increases with the degree of structural deformation, from greenschist facies in the east to amphibolite facies in the southwest. The geology is dominated by an east-west trending series of metavolcanics consisting of olivine cumulates, komatiites, komatiitic basalts, and high iron tholeiites. The rocks are extrusive, indicated by the presence of spinifex texture and pillow lavas as well as lenses of intercalated clastic sediments and discontinuous strings of banded iron formations (BIF) (KDM 2018).
The Penhalonga tonalities, syntectonic granodiorites, trondhjemites and tonalities (now gneisses), microgranites (sheets and dykes), potassium-rich granites (ca. 2,600 Ma), dolerite dykes and sills have all intruded the greenstone supracrustals. The Penhalonga tonalities (ca. 2,741 ± 3 Ma) are the oldest intrusions and therefore provide a good estimate of the age of the MGB (KDM 2018).
Figure 6.1 presents a simplified regional geology map of Zimbabwe and the locations of major greenstone belts. The MGB can be seen in the middle right.
| 6.1.2 | Granitoids |
The MGB is bounded by the Penhalonga Diorite to the north and south.
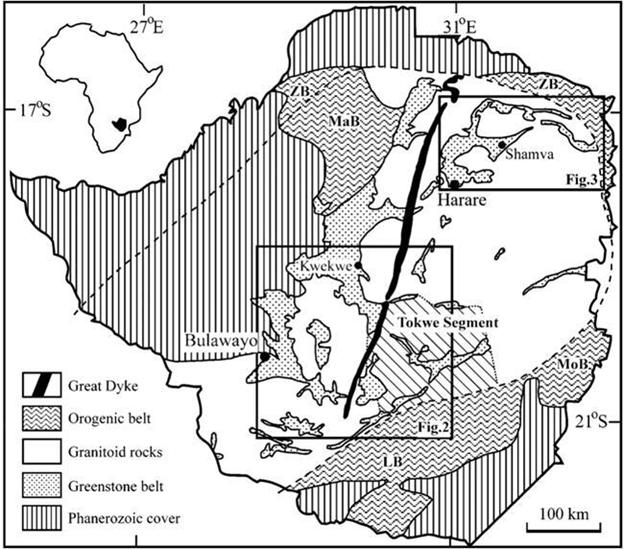
| Figure 6.1 | Regional geology of Zimbabwe showing locations of greenstone belts (Prendergast 2004) |
| Project No PS213686 | WSP |
| Redwing Mine | January 2025 |
| S-K 1300 Technical Report Summary | Page 20 |
| Bulawayo Mining Company Limited |
| 6.2 | Structural setting |
The MGB has undergone at least four deformation events, as described in Table 6.1 (KDM 2018).
| Table 6.1 | Structural deformation events |
| Deformation Event | Description | |
| D1 | SSE-NNW regional compression, resulting in folding of the MGB into a series of at least two east-west striking synclinoria, separated by a tight antiform. Regional shearing and cleavage formation, striking east-west accompanied this folding. | |
| D2 | Faulting transecting all rock types characterised by NNE-SSW faults parallel to the Great Dyke and conjugate NW-SE faulting. | |
| D3 | ENE-WSW striking faults displacing both the D1 and D2 structures in a sinistral sense. | |
| D4 | Locally developed E-W striking fault system, exposed underground at the RGM where Faults displace mineralised structures. |
Known gold deposits occur in all lithologies apart from the younger potassium-rich granites. More than 80% of known mineralisation is hosted by east-west trending structural elements, sub-parallel to the regional strike. These dip on average at 60° to the north or south. The east-west striking deposits show a clear spatial relationship to those structures formed during the D1 deformation event. These deposits are located in subsidiary or second-order structures that commonly splay off or are associated with the regional D1 shears. The Champion Mine is a typical example. Other deposits, including the Rezende dip steeply either to the northeast or southwest and are hosted in D2 structures (NW-striking faults) [KDM 2018].
| 6.3 | Local and property geology |
| 6.3.1 | Felsite |
The Felsite consists of a tabular micro-granitic body, which intruded the Penhalonga diorite. It is a robust orebody, constituting the main mineralisation style at the RGM. It strikes east-west and dips at a locally variable but shallow angle of approximately 35° to the south. At its widest, the orebody attains a thickness of approximately 7 m. It has been worked on a strike length of more than 2,500 m. The Felsite lies in the core of the Penhalonga synform and it is the folding of this micro-granitic sheet within the diorite that is believed to be responsible for the localisation of gold mineralisation (KDM 2018).
Two phases of deformation are recognisable in the Felsite, and these are believed to be responsible for the development of three cleavage plane generations within the orebody. These cleavage plane generations consist of the following (KDM 2018):
| — | Shallow dipping, northeast trending, un-mineralised cleavage planes, which lack quartz infill. |
| — | East-southeast dipping, quartz-filled, mineralised planes with variable inclinations. The shallow dipping (approximately 25°) cleavage planes are mineralised but lack quartz infill. These generally displace the steeply dipping cleavage planes. The steep dipping (+25°) planes are predominantly quartz filled. |
| — | The contact between the diorite and the Felsite is locally sheared and mineralised. This shearing, either from the contact or in most cases from the fold hinges, continues into the diorite as a single dilational quartz filled plane, shallowly dipping, predominantly towards the east-northeast. |
Superimposed on the first folding event of the Felsite, is a second folding event with an axis appearing to plunge steeply towards the north. This has resulted in a fold interference believed to have produced the apparent dome and basin configuration that is evident, particularly on the upper levels of the RGM (KDM 2018).
| 6.3.2 | MSZ |
There are several sub-parallel shears that cut across both the Penhalonga diorite and Felsite. These shears are southeast striking deformation zones, which have a variable but steep dip, ranging between 45° and 75° to the north-northeast. These shears include the Rezende, Village North and Kent reefs. Elongated lineations in the Rezende mineralised shear zone are oriented west-northwest and east-southeast, suggesting both dextral and sinistral senses of movement (KDM 2018).
The MSZ host grey to white, fine-grained quartz veins and veinlets. These are characterised by a distinct crack-seal, banded or ribboned appearance, with anastomosing slivers of altered country rock. Associated sulphide mineralisation includes pyrite, galena, chalcopyrite, accessory arsenopyrite, and occasional native gold. The Rezende mineralised shear zone averages 2.5 m in thickness, with a strike extent of approximately 1,400 m and 800 m up and down-dip. The Village North and Kent MSZ have widely variable thickness, ranging from several cm to more than 6 m in places (KDM 2018).
| Project No PS213686 | WSP |
| Redwing Mine | January 2025 |
| S-K 1300 Technical Report Summary | Page 21 |
| Bulawayo Mining Company Limited |
| 6.4 | Deposit type and geology |
Mineralisation at RGM may be described as a lithological and structurally controlled/shear hosted gold deposit, hosted predominantly within the Felsite and MSZ.
| 6.5 | Mineralisation |
There is strong structural and lithological control on gold mineralisation at the RGM. The sulphide and gold mineralisation in the Felsite orebody is bound within the structurally deformed micro-granitic body, with few transgressive shear or vein extensions into the host diorite. To date, no significant mineralisation has been delineated within the diorite. While no specific metallogenetic studies have been completed, the prevalence of galena in the Felsite orebody reduce with depth. This also appears to be the case with gold (KDM 2018).
Mineralisation within the MSZ (narrow reefs) is distinctly limited to physical deformation that has allowed the migration of hydrothermal fluids resulting in the deposition of quartz, sulphides and gold. While comparatively high gold values are associated with grey quartz and pyrite impregnation, zones of sheared and propylitised diorite commonly form part of contiguous reef structure (KDM 2018).
Figure 6.2 presents a schematic section of the RGM MSZ (quartz reefs) in relation to the Felsite orebody.
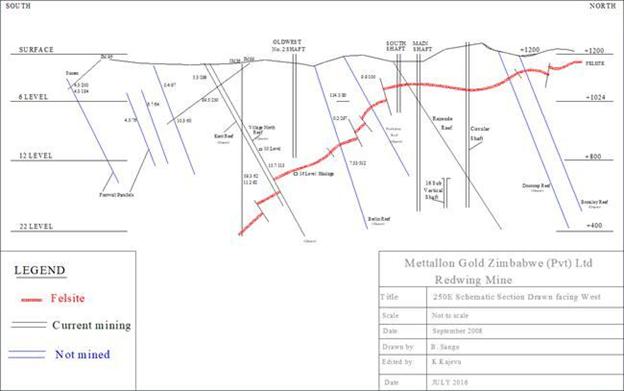
| Figure 6.2 | RGM MSZ schematic section |
| Project No PS213686 | WSP |
| Redwing Mine | January 2025 |
| S-K 1300 Technical Report Summary | Page 22 |
| Bulawayo Mining Company Limited |
The local geology of the Penhalonga Valley is presented in Figure 6.3.
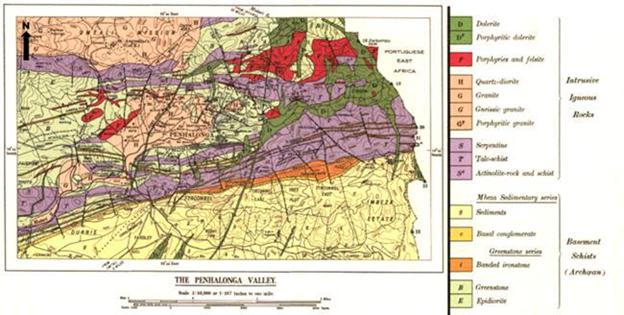
| Figure 6.3 | Penhalonga Valley local geology |
| Figure 6.4 | present the surface geology of the RGM. |
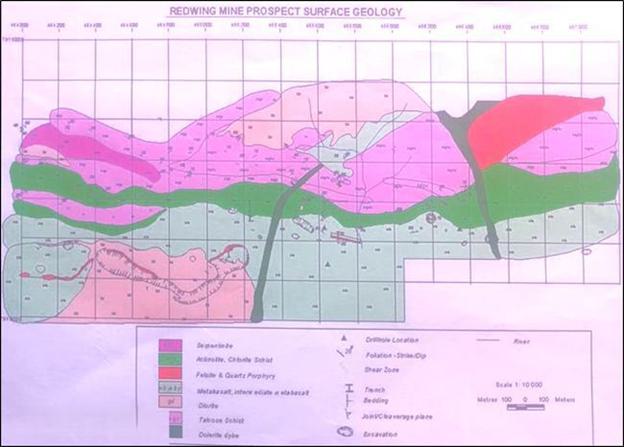
| Figure 6.4 | RGM surface geology |
| Project No PS213686 | WSP |
| Redwing Mine | January 2025 |
| S-K 1300 Technical Report Summary | Page 23 |
| Bulawayo Mining Company Limited |
| Figure 6.5 | presents the local stratigraphy of the RGM area. |
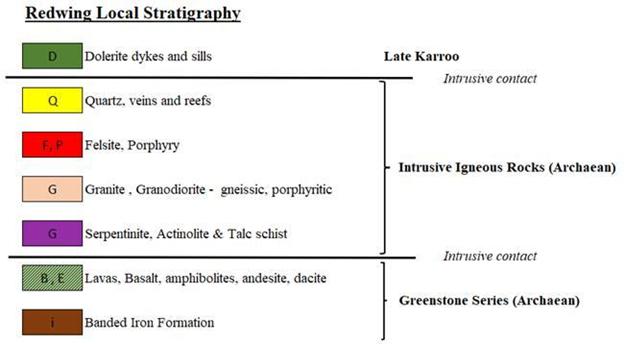
| Figure 6.5 | RGM local stratigraphy |
| Project No PS213686 | WSP |
| Redwing Mine | January 2025 |
| S-K 1300 Technical Report Summary | Page 24 |
| Bulawayo Mining Company Limited |
| 7 | Exploration |
| 7.1 | Diamond drilling |
Diamond core drilling is the drilling method employed at the RGM. Diamond drill core is logged and sampled on a 1 m interval, depending on geology. Samples are taken to at least 1 m beyond the geologically defined mineralisation boundary in all drill holes (KDM 2018).
Core size drilled at the RGM is typically AXT (35.51 mm core diameter) and BQ (36.50 mm core diameter) for evaluation and exploration drill holes respectively (KDM 2018).
All exploration drill holes are collar and downhole surveyed (KDM 2018).
| 7.1.1 | Historical exploration drilling |
An exploration drilling campaign targeting mostly the felsite orebody was carried out around RGM in the early 1980’s. The drilling covered an approximate area of 9 km2 (6 km x 1.5 km), with a total of 22 883 m drilled. The holes were on a widely spaced irregular grid. A total of 78 vertical drill holes were drilled, 31 of which had tails drilled near the end of hole with 1 drill hole having 2 tails drilled. 22 angled drill holes were drilled at various dips and bearings.
The area north of RGM that was covered by this exploration drilling is a target of in-fill drilling to upgrade the felsite resource from Inferred to Indicated mineral resource category.
Drill hole identity and collar survey coordinates are contained in Table 7.1. A plan view of all drill hole collars is provided in Figure 7.1.
| Table 7.1 | RGM historical surface drill hole data |
| Drill hole ID | Hole type | X-collar (mE) | Y-collar (mN) | Z-collar (mRL) | Dip (⁰) | Bearing (⁰) | Depth (m) | |||||||||||||||||||
| IM001 | Core | -35,016.70 | -87,338.50 | 1,195.80 | -90 | 180 | 160.00 | |||||||||||||||||||
| IM002 | Core | -34,814.50 | -87,325.00 | 1,181.20 | -90 | 180 | 136.00 | |||||||||||||||||||
| IM002DEF1 | Core | -34,814.50 | -87,325.00 | 1,094.10 | -75 | 0 | 22.40 | |||||||||||||||||||
| IM003 | Core | -34,612.50 | -87,372.00 | 1,189.50 | -90 | 180 | 99.40 | |||||||||||||||||||
| IM003DEF1 | Core | -34,612.50 | -87,372.00 | 1,122.10 | -75 | 0 | 20.40 | |||||||||||||||||||
| IM004 | Core | -34,314.60 | -87,470.10 | 1,181.60 | -90 | 180 | 231.40 | |||||||||||||||||||
| IM004DEF1 | Core | -34,314.60 | -87,470.10 | 962.40 | -75 | 0 | 12.20 | |||||||||||||||||||
| IM005 | Core | -34,102.20 | -87,530.10 | 1,169.00 | -90 | 180 | 284.00 | |||||||||||||||||||
| IM005DEF1 | Core | -34,102.20 | -87,530.10 | 909.20 | -75 | 0 | 22.40 | |||||||||||||||||||
| Project No PS213686 | WSP |
| Redwing Mine | January 2025 |
| S-K 1300 Technical Report Summary | Page 25 |
| Bulawayo Mining Company Limited |
| Drill hole ID | Hole type | X-collar (mE) | Y-collar (mN) | Z-collar (mRL) | Dip (⁰) | Bearing (⁰) | Depth (m) | |||||||||||||||||||
| IM006 | Core | -34,428.00 | -87,398.50 | 1,184.30 | -90 | 180 | 246.00 | |||||||||||||||||||
| IM007 | Core | -35,275.30 | -87,617.20 | 1,182.10 | -90 | 180 | 394.00 | |||||||||||||||||||
| IM007DEF1 | Core | -35,275.30 | -87,617.20 | 811.70 | -75 | 0 | 13.30 | |||||||||||||||||||
| IM008 | Core | -31,525.80 | -86,237.00 | 1,414.29 | -60 | 180 | 106.00 | |||||||||||||||||||
| IM008A | Core | -31,526.90 | -86,236.60 | 1,414.30 | -90 | 180 | 224.00 | |||||||||||||||||||
| IM009 | Core | -34,706.20 | -86,982.70 | 1,232.00 | -90 | 180 | 163.60 | |||||||||||||||||||
| IM009DEF1 | Core | -34,706.20 | -86,982.70 | 1,083.30 | -75 | 0 | 14.90 | |||||||||||||||||||
| IM010 | Core | -34,565.10 | -86,827.10 | 1,220.30 | -90 | 180 | 53.50 | |||||||||||||||||||
| IM011 | Core | -34,675.70 | -87,178.80 | 1,195.50 | -90 | 180 | 99.20 | |||||||||||||||||||
| IM011DEF1 | Core | -34,675.70 | -87,178.80 | 1,116.90 | -75 | 0 | 13.70 | |||||||||||||||||||
| IM012 | Core | -34,879.70 | -87,133.80 | 1,206.00 | -90 | 180 | 122.50 | |||||||||||||||||||
| IM012DEF1 | Core | -34,879.70 | -87,133.80 | 1,125.50 | -75 | 0 | 27.50 | |||||||||||||||||||
| IM013 | Core | -34,705.80 | -86,980.20 | 1,232.00 | -45 | 180 | 145.00 | |||||||||||||||||||
| IM014 | Core | -34,565.00 | -86,829.00 | 1,220.30 | -45 | 180 | 47.00 | |||||||||||||||||||
| IM015 | Core | -34,616.20 | -87,516.30 | 1,183.40 | -90 | 180 | 321.00 | |||||||||||||||||||
| IM015DEF1 | Core | -34,616.20 | -87,516.30 | 880.40 | -75 | 0 | 17.20 | |||||||||||||||||||
| IM016 | Core | -34,844.10 | -87,532.10 | 1,176.30 | -90 | 180 | 286.00 | |||||||||||||||||||
| IM016DEF1 | Core | -34,844.10 | -87,532.10 | 921.30 | -75 | 0 | 20.00 | |||||||||||||||||||
| IM016DEF2 | Core | -34,844.10 | -87,532.10 | 925.80 | -80 | 210 | 27.50 | |||||||||||||||||||
| IM017 | Core | -34,720.00 | -86,835.70 | 1,256.90 | -45 | 180 | 186.00 | |||||||||||||||||||
| IM018 | Core | -34,149.90 | -86,834.30 | 1,243.50 | -90 | 180 | 302.00 | |||||||||||||||||||
| IM019 | Core | -35,026.00 | -87,533.00 | 1,169.10 | -90 | 180 | 247.00 | |||||||||||||||||||
| IM019DEF1 | Core | -35,026.00 | -87,533.00 | 955.10 | -75 | 0 | 33.00 | |||||||||||||||||||
| IM020 | Core | -33,429.10 | -87,455.10 | 1,210.30 | -90 | 180 | 287.00 | |||||||||||||||||||
| IM021 | Core | -33,462.90 | -87,090.10 | 1,200.00 | -90 | 180 | 153.00 | |||||||||||||||||||
| IM021DEF1 | Core | -33,462.90 | -87,090.10 | 1,090.00 | -75 | 0 | 23.00 | |||||||||||||||||||
| IM022 | Core | -34,341.00 | -87,785.50 | 1,161.10 | -90 | 180 | 480.00 | |||||||||||||||||||
| IM022DEF1 | Core | -34,341.00 | -87,785.50 | 707.60 | -75 | 0 | 12.20 | |||||||||||||||||||
| IM023 | Core | -33,697.30 | -86,960.80 | 1,207.40 | -90 | 180 | 169.00 | |||||||||||||||||||
| IM023DEF1 | Core | -33,697.30 | -86,960.80 | 1,068.70 | -75 | 0 | 16.90 | |||||||||||||||||||
| Project No PS213686 | WSP |
| Redwing Mine | January 2025 |
| S-K 1300 Technical Report Summary | Page 26 |
| Bulawayo Mining Company Limited |
| Drill hole ID | Hole type | X-collar (mE) | Y-collar (mN) | Z-collar (mRL) | Dip (⁰) | Bearing (⁰) | Depth (m) | |||||||||||||||||||
| IM024 | Core | -34,763.00 | -87,741.70 | 1,164.90 | -90 | 180 | 490.00 | |||||||||||||||||||
| IM024DEF1 | Core | -34,763.00 | -87,741.70 | 705.30 | -75 | 0 | 12.40 | |||||||||||||||||||
| IM025 | Core | -33,450.00 | -87,226.80 | 1,192.60 | -90 | 180 | 200.00 | |||||||||||||||||||
| IM025DEF1 | Core | -33,450.00 | -87,226.80 | 1,019.60 | -75 | 0 | 35.00 | |||||||||||||||||||
| IM026 | Core | -33,904.00 | -86,939.00 | 1,207.70 | -90 | 180 | 131.00 | |||||||||||||||||||
| IM026DEF1 | Core | -33,904.00 | -86,939.00 | 1,103.70 | -75 | 0 | 20.30 | |||||||||||||||||||
| IM027 | Core | -33,772.70 | -87,830.80 | 1,154.30 | -90 | 180 | 156.00 | |||||||||||||||||||
| IM028 | Core | -34,767.30 | -87,128.10 | 1,202.00 | -90 | 180 | 129.00 | |||||||||||||||||||
| IM028DEF1 | Core | -34,767.30 | -87,128.10 | 1,112.50 | -75 | 0 | 19.50 | |||||||||||||||||||
| IM029 | Core | -33,644.40 | -87,348.80 | 1,178.80 | -90 | 180 | 202.50 | |||||||||||||||||||
| IM029DEF1 | Core | -33,644.40 | -87,348.80 | 1,002.30 | -75 | 0 | 18.50 | |||||||||||||||||||
| IM030 | Core | -36,174.40 | -87,848.90 | 1,156.40 | -90 | 180 | 404.50 | |||||||||||||||||||
| IM031 | Core | -33,662.60 | -87,162.30 | 1,180.20 | -90 | 180 | 141.00 | |||||||||||||||||||
| IM031DEF1 | Core | -33,662.60 | -87,162.30 | 1,079.50 | -75 | 0 | 22.30 | |||||||||||||||||||
| IM032 | Core | -33,772.60 | -87,831.20 | 1,154.30 | -72 | 0 | 423.50 | |||||||||||||||||||
| IM033 | Core | -34,406.00 | -87,611.40 | 1,169.60 | -90 | 180 | 515.00 | |||||||||||||||||||
| IM033DEF1 | Core | -34,406.00 | -87,611.40 | 678.90 | -75 | 0 | 18.80 | |||||||||||||||||||
| IM034 | Core | -34,543.50 | -87,751.80 | 1,175.40 | -90 | 180 | 483.00 | |||||||||||||||||||
| IM035 | Core | -35,703.00 | -87,908.30 | 1,155.00 | -90 | 180 | 212.00 | |||||||||||||||||||
| IM036 | Core | -34,467.80 | -88,017.60 | 1,161.30 | -90 | 180 | 779.00 | |||||||||||||||||||
| IM036DEF1 | Core | -34,467.80 | -88,017.60 | 411.30 | -75 | 0 | 17.70 | |||||||||||||||||||
| IM037 | Core | -33,309.90 | -87,105.40 | 1,210.30 | -90 | 180 | 179.00 | |||||||||||||||||||
| IM038 | Core | -36,478.80 | -87,320.40 | 1,196.70 | -60 | 180 | 197.50 | |||||||||||||||||||
| IM039 | Core | -36,281.10 | -87,358.30 | 1,179.20 | -90 | 180 | 275.00 | |||||||||||||||||||
| IM040 | Core | -37,112.10 | -87,363.20 | 1,163.20 | -90 | 180 | 40.70 | |||||||||||||||||||
| IM041 | Core | -37,012.20 | -87,329.70 | 1,161.20 | -90 | 180 | 14.90 | |||||||||||||||||||
| IM042 | Core | -36,901.00 | -87,322.90 | 1,165.90 | -90 | 180 | 23.30 | |||||||||||||||||||
| IM043 | Core | -36,896.90 | -87,355.70 | 1,166.10 | -90 | 180 | 16.70 | |||||||||||||||||||
| IM044 | Core | -36,898.50 | -87,287.40 | 1,166.40 | -90 | 180 | 22.70 | |||||||||||||||||||
| Project No PS213686 | WSP |
| Redwing Mine | January 2025 |
| S-K 1300 Technical Report Summary | Page 27 |
| Bulawayo Mining Company Limited |
| Drill hole ID | Hole type | X-collar (mE) | Y-collar (mN) | Z-collar (mRL) | Dip (⁰) | Bearing (⁰) | Depth (m) | |||||||||||||||||||
| IM045 | Core | -34,645.30 | -87,312.50 | 1,189.80 | -90 | 180 | 94.00 | |||||||||||||||||||
| IM046 | Core | -34,869.20 | -87,221.30 | 1,194.30 | -90 | 180 | 68.00 | |||||||||||||||||||
| IM047 | Core | -34,576.60 | -87,313.70 | 1,194.80 | -90 | 180 | 84.70 | |||||||||||||||||||
| IM048 | Core | -34,676.80 | -87,372.50 | 1,183.00 | -90 | 180 | 95.00 | |||||||||||||||||||
| IM049 | Core | -34,509.50 | -87,338.80 | 1,193.60 | -90 | 180 | 81.20 | |||||||||||||||||||
| IM050 | Core | -34,718.70 | -87,288.00 | 1,187.90 | -90 | 180 | 88.00 | |||||||||||||||||||
| IM051 | Core | -34,727.80 | -87,218.00 | 1,192.70 | -90 | 180 | 77.00 | |||||||||||||||||||
| IM052 | Core | -34,459.50 | -87,319.80 | 1,186.70 | -90 | 180 | 114.00 | |||||||||||||||||||
| IM053 | Core | -34,468.00 | -88,021.00 | 1,158.80 | -45 | 0 | 108.00 | |||||||||||||||||||
| IM054 | Core | -34,455.20 | -87,238.80 | 1,193.30 | -90 | 180 | 119.00 | |||||||||||||||||||
| IM055 | Core | -34,399.50 | -88,024.50 | 1,146.20 | -45 | 0 | 126.00 | |||||||||||||||||||
| IM056 | Core | -34,771.00 | -87,376.50 | 1,181.10 | -90 | 180 | 104.00 | |||||||||||||||||||
| IM057 | Core | -34,531.00 | -88,015.00 | 1,161.70 | -45 | 0 | 102.00 | |||||||||||||||||||
| IM058 | Core | -34,795.30 | -87,246.80 | 1,187.90 | -90 | 180 | 74.00 | |||||||||||||||||||
| IM059 | Core | -34,696.60 | -87,707.60 | 1,159.90 | -45 | 0 | 125.00 | |||||||||||||||||||
| IM060 | Core | -34,822.90 | -87,077.90 | 1,217.00 | -90 | 180 | 124.00 | |||||||||||||||||||
| IM061 | Core | -35,074.00 | -87,497.20 | 1,179.40 | -45 | 0 | 110.00 | |||||||||||||||||||
| IM062 | Core | - | - | - | -90 | 180 | 150.00 | |||||||||||||||||||
| IM063 | Core | -33,959.70 | -87,655.50 | 1,159.50 | -90 | 180 | 371.20 | |||||||||||||||||||
| IM066 | Core | -34,621.00 | -87,976.00 | 1,167.00 | -90 | 180 | 176.50 | |||||||||||||||||||
| IM067 | Core | -34,878.00 | -87,782.00 | 1,169.56 | -50 | 50 | 143.00 | |||||||||||||||||||
| IM068 | Core | -34,487.30 | -87,157.40 | 1,202.00 | -90 | 180 | 152.30 | |||||||||||||||||||
| IM069 | Core | -34,516.30 | -87,049.20 | 1,211.40 | -90 | 180 | 155.00 | |||||||||||||||||||
| IM070 | Core | -34,592.20 | -87,072.90 | 1,204.20 | -90 | 180 | 164.90 | |||||||||||||||||||
| IM071 | Core | -34,600.70 | -87,001.10 | 1,208.70 | -90 | 180 | 165.00 | |||||||||||||||||||
| IM072 | Core | -34,664.40 | -87,046.50 | 1,214.60 | -90 | 180 | 178.30 | |||||||||||||||||||
| IM073 | Core | -34,729.90 | -87,057.00 | 1,214.80 | -90 | 180 | 166.30 | |||||||||||||||||||
| IM074 | Core | -36,059.00 | -87,080.40 | 1,224.00 | -90 | 180 | 139.15 | |||||||||||||||||||
| IM075 | Core | -36,150.00 | -87,125.00 | 1,205.50 | -90 | 180 | 185.10 | |||||||||||||||||||
| Project No PS213686 | WSP |
| Redwing Mine | January 2025 |
| S-K 1300 Technical Report Summary | Page 28 |
| Bulawayo Mining Company Limited |
| Drill hole ID | Hole type | X-collar (mE) | Y-collar (mN) | Z-collar (mRL) | Dip (⁰) | Bearing (⁰) | Depth (m) | |||||||||||||||||||
| IM076 | Core | -36,270.10 | -87,130.30 | 1,198.10 | -90 | 180 | 205.00 | |||||||||||||||||||
| IM077 | Core | -36,264.00 | -87,164.30 | 1,192.80 | -50 | 180 | 119.00 | |||||||||||||||||||
| IM078 | Core | -36,293.40 | -87,170.00 | 1,196.66 | -50 | 180 | 59.72 | |||||||||||||||||||
| IM079 | Core | -36,349.90 | -87,178.70 | 1,202.57 | -50 | 180 | 85.00 | |||||||||||||||||||
| IM080 | Core | -33,728.70 | -86,782.60 | 1,239.00 | -90 | 180 | 197.50 | |||||||||||||||||||
| IM081 | Core | -33,782.70 | -86,782.60 | 1,239.00 | -60 | 180 | 43.80 | |||||||||||||||||||
| IM082 | Core | -33,728.70 | -86,782.60 | 1,239.00 | -60 | 140 | 121.90 | |||||||||||||||||||
| IM083 | Core | -33,977.70 | -86,825.10 | 1,244.80 | -90 | 180 | 150.57 | |||||||||||||||||||
| IM084 | Core | -34,934.00 | -87,053.00 | 1,230.53 | -90 | 180 | 110.60 | |||||||||||||||||||
| IM085 | Core | -34,969.90 | -87,745.00 | 1,168.99 | -90 | 180 | 607.39 | |||||||||||||||||||
| IM085DEF1 | Core | -34,969.90 | -87,745.00 | 578.99 | -75 | 0 | 19.00 | |||||||||||||||||||
| IM086 | Core | -35,408.20 | -87,788.40 | 1,177.20 | -90 | 180 | 607.32 | |||||||||||||||||||
| IM086A | Core | -35,408.20 | -87,788.40 | 1,177.20 | -90 | 180 | 73.90 | |||||||||||||||||||
| IM086DEF1 | Core | -35,408.20 | -87,788.40 | 603.32 | -75 | 0 | 30.46 | |||||||||||||||||||
| IM087 | Core | -34,160.40 | -87,752.70 | 1,169.66 | -90 | 180 | 463.17 | |||||||||||||||||||
| IM087DEF1 | Core | -34,160.40 | -87,752.70 | 742.42 | -75 | 0 | 31.68 | |||||||||||||||||||
| IM088 | Core | -33,479.80 | -87,006.60 | 1,194.06 | -90 | 180 | 200.23 | |||||||||||||||||||
| IM089 | Core | -33,589.20 | -86,917.60 | 1,217.47 | -90 | 180 | 200.48 | |||||||||||||||||||
| IM090 | Core | -34,002.50 | -87,853.90 | 1,163.57 | -90 | 180 | 524.00 | |||||||||||||||||||
| IM090DEF1 | Core | -34,002.50 | -87,853.90 | 670.57 | -75 | 0 | 29.55 | |||||||||||||||||||
| IM091 | Core | -34,226.20 | -87,924.00 | 1,165.49 | -90 | 180 | 622.23 | |||||||||||||||||||
| IM091DEF1 | Core | -34,226.20 | -87,924.00 | 606.49 | -75 | 0 | 34.00 | |||||||||||||||||||
| IM092 | Core | -34,790.60 | -87,957.50 | 1,154.02 | -90 | 180 | 802.92 | |||||||||||||||||||
| IM092DEF1 | Core | -34,790.60 | -87,957.50 | 444.02 | -75 | 0 | 44.20 | |||||||||||||||||||
| IM093 | Core | -35,160.50 | -87,670.00 | 1,169.00 | -90 | 180 | 420.80 | |||||||||||||||||||
| IM093DEF1 | Core | -35,160.50 | -87,670.00 | 813.50 | -75 | 0 | 64.65 | |||||||||||||||||||
| Project No PS213686 | WSP |
| Redwing Mine | January 2025 |
| S-K 1300 Technical Report Summary | Page 29 |
| Bulawayo Mining Company Limited |
| Drill hole ID | Hole type | X-collar (mE) | Y-collar (mN) | Z-collar (mRL) | Dip (⁰) | Bearing (⁰) | Depth (m) | |||||||||||||||||||
| IM094 | Core | -35,515.30 | -87,542.50 | 1,170.40 | -90 | 180 | 419.89 | |||||||||||||||||||
| IM094DEF1 | Core | -35,515.30 | -87,542.50 | 812.90 | -75 | 0 | 30.37 | |||||||||||||||||||
| IM095 | Core | -35,671.60 | -87,473.30 | 1,169.00 | -90 | 180 | 437.11 | |||||||||||||||||||
| IM095DEF1 | Core | -35,671.60 | -87,473.30 | 790.45 | -75 | 0 | 31.05 | |||||||||||||||||||
| IM096 | Core | -35,740.70 | -87,915.50 | 1,152.55 | -45 | 0 | 310.00 | |||||||||||||||||||
| IM098 | Core | -34,038.90 | -88,150.70 | 1,147.60 | -45 | 29 | 133.85 | |||||||||||||||||||
| IM099 | Core | -34,484.40 | -87,998.20 | 1,161.40 | -45 | 29 | 369.35 | |||||||||||||||||||
| IM100 | Core | -34,885.60 | -87,998.00 | 1,159.64 | -45 | 12 | 501.70 | |||||||||||||||||||
| IM101 | Core | -35,413.90 | -88,000.00 | 1,146.50 | -45 | 21 | 500.15 | |||||||||||||||||||
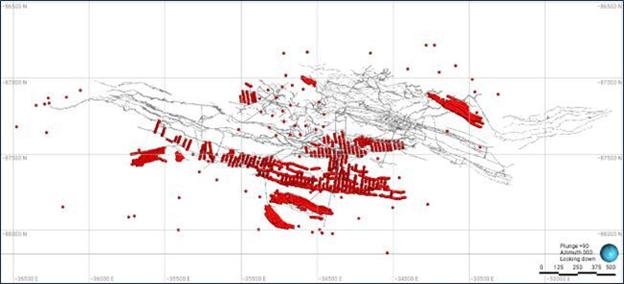
| Figure 7.1 | Plan view of all drill hole collars and existing mine development |
| 7.2 | Surface exploration |
The Redwing Exploration project was initiated on the premise that the felsite currently being mined underground had potential to be mined via opencast methods. Initial target generation was completed using computer-based models by extrapolation of the felsite orebody to the surface (RMC Zimbabwe 2025).
| 7.2.1 | Soil geochemical prospecting |
A soil geochemical grid was cut in over the redwing claims stretching from the most westerly Tsvingwe claims to as far east as the King daughter Claims with much of the open ground being north of the current workings and villages - Old West and Redwing. The initial grid was cut in at 200 m traverses x 25 m stations with infill gridding, at 100 m x 25 m, being cut in over the highly prospective ground stretching from the Iona Mine claims in the west, to King Daughter claims to the east. The western extension of the Tsvingwe claims was all covered by a 200 m x 25 m grid. Figure 7.2 shows the extent of the grids (RMC Zimbabwe 2025).
| Project No PS213686 | WSP |
| Redwing Mine | January 2025 |
| S-K 1300 Technical Report Summary | Page 30 |
| Bulawayo Mining Company Limited |
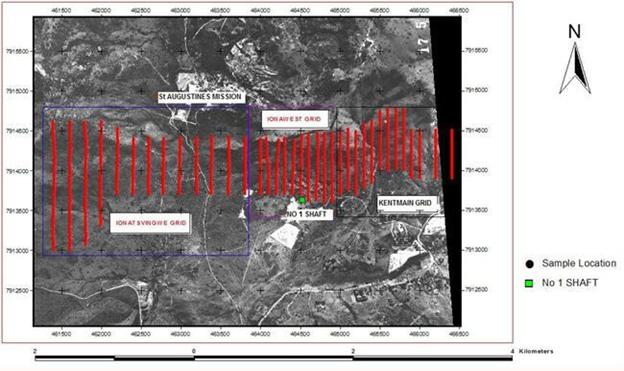
| Figure 7.2 | Redwing Project soil geochemical prospecting grids (RMC Zimbabwe 2025). |
| 7.2.2 | Trenching and pitting |
The initial trenching within the Redwing claims was wholly based on the anomalies generated from the soil geochemistry exercise with the rest being either strike extensions of significant intercepts or occasionally over prospective structures identified during mapping. A total of 1,473.70 m of trenching were dug. Table 7.2 shows some of the trenches for which significant intercepts were picked up and have subsequently been included as part of the drilling program for Redwing. Most of the trenches within the redwing claims were over felsite outcrops with the rest being across narrow shear quartz veins. Typical phenomenon was mineralisation of felsite in the footwall or hanging wall contacts with internal mineralisation being due to occasional tensional quartz veins that predominantly displayed pinch and swell structures.
Table 7.2 Significant trench intercepts within the Redwing Grid
| Trench | Easting (mE UTM) | Northing start (mN UTM) | Northing end (mN UTM) | Comment | Intercept value | |||||||||||
| 65349A | 465,349 | 7,913,949 | 7,913,950 | Felsite(fs) | 1 m @ 0.7 g/t | |||||||||||
| 65349A | 465,349 | 7,913,952 | 7,913,953 | strongly foliated (sf) metabasalt (mb) | 1 m @ 1.7 g/t | |||||||||||
| 65200A | 465,200 | 7,914,119 | 7,914,122 | very strongly foliated (vsf), pyritiferous(pyt) felsite | 3.7 m @ 1.9 g/t | |||||||||||
| 64855A | 464,855 | 7,913,875 | 7,913,879 | felsite | 4 m @ 1.05 g/t | |||||||||||
| 64855A | 464,855 | 7,913,881 | 7,913,897 | felsite | 16 m @ 1.44 g/t | |||||||||||
| 65230A | 465,230 | 7,914,116 | 7,914,117 | Felsite,vsf | 1 m @ 1.0 g/t | |||||||||||
| Project No PS213686 | WSP |
| Redwing Mine | January 2025 |
| S-K 1300 Technical Report Summary | Page 31 |
| Bulawayo Mining Company Limited |
| Trench | Easting (mE UTM) | Northing start (mN UTM) | Northing end (mN UTM) | Comment | Intercept value | |||||||||||
| 65155A | 465,155 | 7,914,120 | 7,914,121 | very strongly xoidized (vso), pytiferous felsite | 1 m @ 2.25 g/t | |||||||||||
| 65155A | 465,155 | 7,914,121 | 7,914,124 | pytf fs,vso,vsf+1.5m vertical | 3 m @ 2.5 g/t | |||||||||||
| 65291A | 465,291 | 7,914,135 | 7,914,139 | vsf pytiferous fs +qtz veinlets | 4 m @ 1.26 g/t | |||||||||||
| 65145A | 465,145 | 7,914,120 | 7,914,121 | Acs-fs contamination, hosting qtz vein ,lim rich | 1 m @ 2.07 g/t | |||||||||||
| 65145A | 465,145 | 7,914,122 | 7,914,123 | fs contamination+qtz veinlets in Acs-ts bands | 1 m @ 1.2 g/t | |||||||||||
| 65145A | 465,145 | 7,914,125 | 7,914,125 | pytiferous fs,vso+1m vertical | 1 m @ 0.5 g/t | |||||||||||
| 65085A | 465,085 | 7,914,148 | 7,914,150 | bleached fs,strongly fractured+1m vertical | 2.5 m @ 15.3 g/t | |||||||||||
| 65127A | 465,127 | 7,914,012 | 7,914,013 | vso felsic rock hosting 10-30cm shear qtz vein | 1 m @ 1.16 g/t | |||||||||||
| 65165A | 465,165 | 7,914,126 | 7,914,128 | vsf pytiferous felsite | 2 m @ 1.25 g/t | |||||||||||
| 65124A | 465,124 | 7,914,010 | 7,914,011 | vsf mb hosting 10-30cm fault qtz vein | 1 m @ 7.05 g/t | |||||||||||
| 65210A | 465,210 | 7,914,112 | 7,914,115 | pyritiferous fs,vso&foliated with 1-5 cm qtz vein | 3.5 m @ 2.59 g/t | |||||||||||
| 65221A | 465,221 | 7,914,116 | 7,914,118 | vsf pyritiferous fs | 3.5 m @ 1.81 g/t | |||||||||||
| 65291A | 465,291 | 7,914,137 | 7,914,139 | vsf pyritiferous fs with qtz veinlets | 3.3 m @ 1.8 g/t | |||||||||||
| 65311A | 465,311 | 7,914,133 | 7,914,137 | vsf pyrt felsite | 4 m @ 1.34 g/t | |||||||||||
| 65324A | 465,324 | 7,914,132 | 7,914,132 | vso felsite | 3.5 m @ 1.36 g/t | |||||||||||
| 65336A | 465,336 | 7,914,130 | 7,914,131 | vsf fs with 1-3cm qtz vein and veinlets | 1.5 m @ 3.42 g/t | |||||||||||
| 66488B | 466,488 | 7,914,098 | 7,914,098 | pyrtiferous quartz reef (Kings Daughter) | 0.2 m @ 22 g/t | |||||||||||
| Project No PS213686 | WSP |
| Redwing Mine | January 2025 |
| S-K 1300 Technical Report Summary | Page 32 |
| Bulawayo Mining Company Limited |
| Trench | Easting (mE UTM) | Northing start (mN UTM) | Northing end (mN UTM) | Comment | Intercept value | |||||||||||
| 66468A | 466,468 | 7,914,083 | 7,914,087 | quartz veined sheared actinolite schist | 4 m @ 1.9 g/t | |||||||||||
| 66511A | 466,511 | 7,914,070 | 7,914,076 | quartz veined sheared actinolite schist | 6 m @ 2.4 g/t | |||||||||||
| 66523A | 466,523 | 7,914,068 | 7,914,071 | quartz veined sheared actinolite schist | 3 m @ 2.43 g/t | |||||||||||
| 66532A | 466,532 | 7,914,065 | 7,914,066 | quartz veined sheared actinolite schist | 1 m @ 3.5 g/t | |||||||||||
| 63896A | 463,896 | 7,913,902 | 7,913,903 | mb-ts contact | 1 m @ 16.96 g/t | |||||||||||
| 65286A | 465,286 | 7,913,967 | 7,913,968 | quartz veined mb | 1 m @ 38.06 | |||||||||||
| 65286A | 465,286 | 7,913,970 | 7,913,971 | very strongly foliated (vsf) mb | 1 m @ 5.27 g/t | |||||||||||
| 65286A | 465,286 | 7,913,990 | 7,913,991 | very strongly foliated (vsf) mb | 1 m @ 3.09 g/t | |||||||||||
| 65286A | 465,286 | 7,913,997 | 7,913,998 | very strongly foliated (vsf) mb | 1 m @ 14.73 g/t | |||||||||||
| 64600C | 464,600 | 7,914,129 | 7,914,130 | quartz veined sheared actinolite schist | 1 m @ 14.73 g/t | |||||||||||
| 65124A | 465,124 | 7,914,010 | 7,194,011 | mb with 30cm quartz vein | 1 m @ 7.05 g/t | |||||||||||
| 63813A | 463,813 | 7,913,937 | 7,913,938 | quartz veined sheared actinolite schist | 1 m @ 11.6 g/t | |||||||||||
| 66488A | 466,488 | 7,914,083 | 7,914,084 | quartz veined sheared actinolite schist | 1 m @ 1.86 g/t | |||||||||||
| 66488B | 466,488 | 7,914,103 | 7,914,104 | quartz veined sheared actinolite schist | 1 m @ 2.4 g/t | |||||||||||
| 66488B | 466,488 | 7,914,106 | 7,914,107 | quartz veined sheared actinolite schist | 1 m @ 11.4 g/t | |||||||||||
| 7.3 | QP’s opinion |
The QP considers the data collected, including the method of collection and storage to be appropriate for the preparation of geological models and Mineral Resources estimates, and that the data has been considered during resource classification.
| Project No PS213686 | WSP |
| Redwing Mine | January 2025 |
| S-K 1300 Technical Report Summary | Page 33 |
| Bulawayo Mining Company Limited |
| 8 | Sample preparation, analyses, and security |
| 8.1 | Sampling techniques |
The following types of samples are used at the RGM for Mineral Resources estimation (KDM 2018):
| 8.1.1 | Core sampling |
For underground evaluation and exploration drill holes, full core is sampled, while for surface exploration drill holes, mineralised zones only are split in half using a core splitter, with half the core being sent for assay and the other half kept for future reference (KDM 2018).
Current practise is that half core and pulp from exploration holes is stored and only discarded after mining through the areas (KDM 2018).
| 8.1.2 | Channel sampling |
Channel samples used in the resource evaluation process are taken using a pneumatic diamond-saw. A 10 millimetre (mm) deep/30 mm wide channel is cut into the roof of a drive or sidewall of a cross-cut. Sample is collected from the channel using a hammer and cold chisel. Channels are cut at 2 m intervals. The typical sample length is 1 m; however, this may be smaller to allow for variations in geology, apparent mineralisation or excavation dimensions (KDM 2018).
| 8.1.3 | Grab sampling |
Grab samples are mainly taken from active boxes and draw-points for production monitoring grade control. For each shift a composite sample per box or draw point is taken for assaying (KDM 2018).
| 8.1.4 | Drive face and stope-bench sampling |
Drive face and stope-bench samples are taken at the discretion of the Geologist using chisel and hammer method or a pneumatic diamond-saw. These samples are used for mining and grade control purposes (KDM 2018).
| 8.1.5 | Sample security |
Samples are taken and transported to surface by a designated sampler. Upon arrival on surface at the shaft, the sampler is escorted by Security until the samples are submitted at the Assay Laboratory (KDM 2018).
| 8.2 | Dry bulk density determination |
Dry bulk density (BD) determinations were conducted in-house by the RGM assay laboratory technicians on samples collected from underground development material. Sample material was obtained from sources in both the Felsite and MSZ. The exercise initially commenced in 1997, to validate the historical figure of 2.70 tonnes per cubic metre (t/m3) that was in use. Confirmatory re-runs were completed in 2001 and 2017, producing similar results (KDM 2018).
| 8.3 | Sample preparation, analysis and procedures |
The bulk of the samples collected during production and exploration activities are analysed at the RGM on-site assay laboratory. These samples include channel, drill core, drive or stope face and box grabs and processing plant samples (KDM 2018).
| Project No PS213686 | WSP |
| Redwing Mine | January 2025 |
| S-K 1300 Technical Report Summary | Page 34 |
| Bulawayo Mining Company Limited |
Approximately 6,000 samples were assayed per month up to the end of December 2007. This was reduced to 2,000 samples during the period January 2008 to March 2008 as a result of reduced underground operations due to flooding. From October 2012 to September 2013, due to a reduced level of mining activities, the on-site assay laboratory processed an average of 1,110 solid samples and 2,160 solution samples per month. The RGM resumed underground operations in the first quarter of 2015 and from April to December 2015, the on-site assay laboratory processed an average of 1,530 solid samples per month. Up until the time the RGM was placed on C&M on 1 April 2019, the number of samples processed per month averaged approximately 3,114 solid samples and 2,293 solution samples (KDM 2018).
Dried samples are crushed to -5 mm in a Boyd Crusher, riffle split to 500 g and pulverised in a ring-mill/ vertical spindle pulveriser to 100% -150 micrometres (µm). From the pulverised sample, a 25 g (50 g charge for diamond drill core, channel and plant metal accounting samples) charge is fire assayed with gravimetric finish. Solution and carbon samples are treated using atomic absorption spectroscopy (AAS) [KDM 2018].
Internal standards are introduced at a rate of two in every 16 samples assayed. The mine also runs a repeat assay register that is kept in the Geology Department for the purpose of monitoring laboratory performance. Drill core and mill feed samples are routinely assayed in duplicate. Exploration core samples are sent to external commercial laboratories for assaying. Repeat samples are taken only on mineralised intersections (KDM 2018).
The mine maintains a record of all samples taken for assaying. Samples collected from underground have their details kept in field logbooks, from which information is transferred to daily return and assay laboratory report sheets. Depending on use, upon receipt, assays are plotted on assay plans, captured into the mine Vulcan™ Isis database or dispatched to end-users for decision making (KDM 2018).
A similar procedure is followed for diamond drill core samples. Records are kept in logbooks, log-sheets, the mine Vulcan™ Isis database and assay sheets. The on-site assay laboratory also maintains records of all samples processed (KDM 2018).
| 8.4 | Quality Assurance Quality Control |
Quality Assurance and Quality Control (QAQC) procedures used at the RGM (KDM 2018) are as described below.
| 8.4.1 | Drill core |
| — | Core derived from surface exploration activities is logged and spit into two halves using a core splitter prior to sampling. Underground core (both exploration and evaluation) is logged and sampled without being split. |
| — | Standard and duplicate samples are inserted at a rate of 10%, whilst blank samples are inserted at a rate of 20%. |
| — | An accredited laboratory is used for analysis of surface exploration diamond drill core samples. A separate laboratory is used as an umpire laboratory, analysing pulp duplicate samples. The on-site assay laboratory is used for analysis of drill core derived from underground exploration and evaluation drilling. |
| — | Reference material is tested for compliance to set standards, typically ± 2 standard deviations (SD) from the designated mean value. |
| — | Assay batches that are rejected are subject to either re-assay or discarded with appropriate qualifications, e.g., contamination, ticket mix-up, and transcription errors etc. |
| 8.4.2 | Channel and grab samples |
| — | House standards, duplicate samples and blank samples are used for QAQC to monitor the day to day running of the mining operation. These samples are inserted at a rate of 20%. |
| — | Reference material is tested for compliance to set standards, typically ± 2 SD from the designated mean value. |
| — | Assay batches that are rejected are subject to either re-assay or discarded with appropriate qualifications, e.g., contamination, ticket mix-up and transcription errors etc. |
| Project No PS213686 | WSP |
| Redwing Mine | January 2025 |
| S-K 1300 Technical Report Summary | Page 35 |
| Bulawayo Mining Company Limited |
| — | The on-site assay laboratory has its own duplicate and standard samples that the Chief Assayer uses to monitor laboratory performance. For every batch of 16 samples, one high-grade standard and one low-grade standard sample are utilised. |
| 8.4.3 | Certified Reference Material |
WSP was not supplied with any data relating to the Certified Reference Material (CRM) samples used at the RGM. or historical performance of QAQC samples used.
| 8.4.4 | Blanks |
Blanks are inserted at a rate of 20% for drill core, channel samples, and grab samples.
| 8.4.5 | Duplicates |
An accredited laboratory is used for analysis of surface exploration diamond drill core samples. A separate laboratory is used as an umpire laboratory, analysing pulp duplicate samples. The on-site assay laboratory is used for analysis of drill core derived from underground exploration and evaluation drilling.
The on-site assay laboratory has its own duplicate and standard samples that the Chief Assayer uses to monitor laboratory performance of Channel and Grab Samples. For every batch of 16 samples, one high-grade standard and one low-grade standard sample are utilised.
| 8.5 | QP’s opinion on adequacy |
The QP considers the QAQC, and security protocols used at the Property to be appropriate in regard to the data used in the preparation of Mineral Resources estimates, and that the data has been considered during resource classification.
| Project No PS213686 | WSP |
| Redwing Mine | January 2025 |
| S-K 1300 Technical Report Summary | Page 36 |
| Bulawayo Mining Company Limited |
| 9 | Data verification |
| 9.1 | Mineral Resources data verification |
| 9.1.1 | Data verification conducted by RMC Zimbabwe |
Data validation conducted by RMC Zimbabwe was done so using Microsoft Excel, inbuilt Vulcan™ software validation tools, physical checks, and correction of any erroneous input data to ensure completeness, and integrity of captured data. Transcription errors were checked, identified, and corrected through direct comparison of captured data with data sources such as assay plans, and diamond drill core log sheets. Drill hole collar locations and elevations were inspected, verified and corrected in Vulcan™. RMC Zimbabwe staff also conducted visual validation of the block models developed (KDM 2018).
| 9.1.2 | Data verification conducted by WSP |
The QP has validated the following geological and Mineral Resources estimation data:
| — | Drill hole collar locations. |
| — | Drill hole downhole survey. |
| — | Sampling techniques. |
| — | Development wireframes. |
| — | Resource wireframes. |
| — | Block models. |
| — | Mineral Resource tonnages and grades. |
Some errors were identified in drill hole locations, survey, validity of the wireframes, and cases of missing blocks within resource wireframes.
Resource classification was performed manually by external consultants which could not be independently verified by the QP.
| 9.1.3 | Limitations on exploration and Mineral Resources data verification |
The QP was not directly involved in the exploration drilling, and sampling programs that formed the basis for collecting the data used in the geological modelling and Mineral Resources estimates for the Property, and was unable to observe drilling, sampling, and sample preparation methods at the RGM during the personal inspection (Section 2.4).
The QP is not aware of any other limitations on nor failure to conduct appropriate data verification.
The QP has validated the data presented in Section 9.1, including collar survey, down hole geological data and observations, sampling, analytical, and other test data underlying the information or opinions contained in the written disclosure presented in this TRS. The QP has presented information relating to uncertainty in the estimates of Inferred, Indicated, and Measured Mineral Resources (Section 11.5), and opinions on factors likely to influence the prospect of economic extraction. A comprehensive list of Mineral Resources interpretations and conclusions, and Mineral Resources recommendations have also been presented in Sections 22.1 and 23.1 respectively.
Notwithstanding these matters, the QP considers the data used is acceptable for the purposes of geological modelling and Mineral Resources estimation.
| Project No PS213686 | WSP |
| Redwing Mine | January 2025 |
| S-K 1300 Technical Report Summary | Page 37 |
| Bulawayo Mining Company Limited |
| 9.2 | Mining and Mineral Reserves data verification |
Using the data provided by RGM, the following has been conducted as spot checks:
| — | Six stopes with the highest declared reserves have been selected for spot checks. Tonnage and grade were estimated using Deswik mining software to interrogate block models using supplied Mineral Resource wireframes. Mineral Reserve wireframes are not prepared. Dilution was applied manually using Microsoft Excel software, with independent checks also undertaken to match the reported dilution. |
| — | The QP considers the data suitable for the purposes of preparing the mine design, mine schedule, and Mineral Reserves estimate. |
| 9.3 | Geotechnical data verification |
No written procedures outlining the processes of geotechnical logging, data importing, QA/QC and validation have been provided to WSP. Geotechnical data is limited to the Rock Engineering Review for Redwing undertaken by SRKSA, this report along with two of the reports reviewed by SRKSA (Hogan 1991 and Kersten n.d.) were made available to WSP for confirmation.
Geotechnical data is collected during core logging and underground mapping (KDM 2018, SRKSA 2016).
At the request of BMC Limited, SRK Consulting (South Africa) (Pty) Ltd (SRKSA) undertook a review of rock mechanics work done by various consultants previously. A total of eight rock engineering reports by different consultants were made available to SRK consulting for the purpose of this review. The sparse data suggests a low confidence in the design calculations (SRKSA 2016).
Table 9.1 summarises the material properties that were obtained by SRKSA from the previous reports.
| Table 9.1 | Summary of laboratory results (SRKSA (2016)) |
| Sector | Rock type | Quantity | UCS average (MPa) | Modulus | Source | Comment | ||||||
| Unknown | Felsite | 14 | 190 | Not done | Budavari (1981) | Orebody | ||||||
| Unknown | Unknown | Unknown | 200 | 58 GPa | Unknown | No reference | ||||||
| Unknown | Unknown | Unknown | 195 | 58 GPa | Hogan (1991) | No reference | ||||||
| 14 Level | Diorite | Unknown | 215 | 58 GPa | Kersten (n.d.) | Hangingwall | ||||||
| Unknown | Unknown | 5 | 190.6 | Not done | Bell. P (1989) | No reference | ||||||
| Unknown | Unknown | 5 | 61.7 | Not done | Bell. P (1989) | No reference |
Key findings from SRKSA (2016) are detailed in Section 13.2.1.
In the opinion of the QP, the geotechnical data used to inform design parameters is of adequate quality for the Property and its material types and for the purposes used in this TRS.
| Project No PS213686 | WSP |
| Redwing Mine | January 2025 |
| S-K 1300 Technical Report Summary | Page 38 |
| Bulawayo Mining Company Limited |
| 9.4 | Hydrogeology and hydrology data verification |
No specific hydrological or hydrogeological studies have been undertaken for the RGM. The following is a general characterisation of the RGM area.
The RGM is located within the Odzi Sub-Catchment of the Save Catchment. Figure 9.1 shows the various Zimbabwe catchments, and Figure 9.2 shows the sub-catchments of the Save catchment (Waterkings 2012).
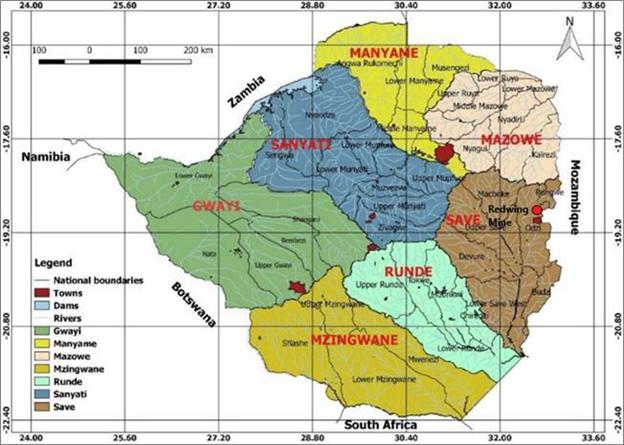
| Figure 9.1 | Catchment boundaries of Zimbabwe (BMC Limited) |
| Project No PS213686 | WSP |
| Redwing Mine | January 2025 |
| S-K 1300 Technical Report Summary | Page 39 |
| Bulawayo Mining Company Limited |
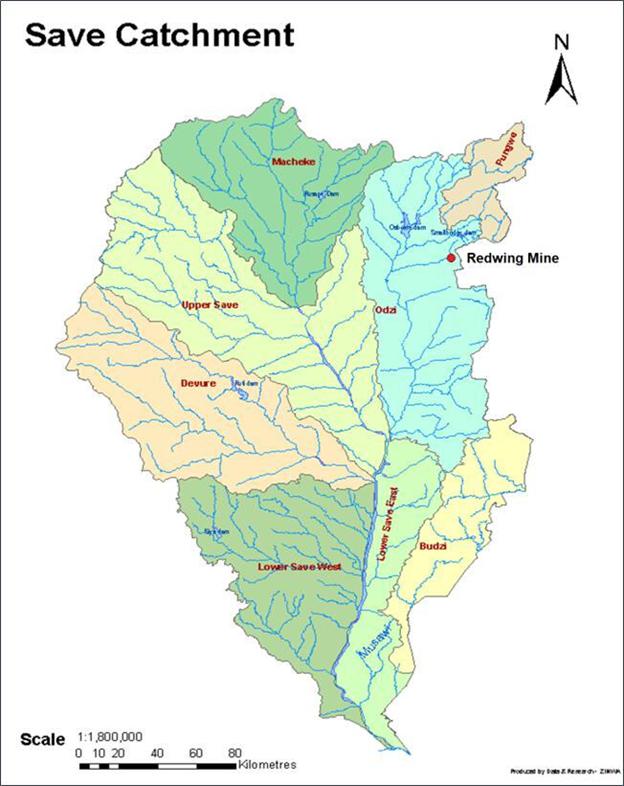
| Figure 9.2 | Sub-catchment boundaries of Save Zimbabwe (BMC Limited) |
| Project No PS213686 | WSP |
| Redwing Mine | January 2025 |
| S-K 1300 Technical Report Summary | Page 40 |
| Bulawayo Mining Company Limited |
| 9.4.1 | Hydrology |
The RGM is located within the hydrological sub-zone EO3 of the Odzi sub-catchment of the Save catchment. The area around the RGM experiences a Mean Annual Run-off (MAR) of 191 mm and a Coefficient of Variation (CV) of 70%, thus the chances of experiencing the recorded MAR are slim. The hydrology of the RGM is controlled by the Mutare River which drains to the west into Odzi River, the major river in the hydrological sub-zone. The area experiences an average annual rainfall of 2,000 mm. Maximum temperatures average 20°C and evaporation is 1,200 mm per annum. These climatic conditions ensure a perennial flow of these two major rivers and their tributaries (Waterkings 2012).
| 9.4.2 | Hydrogeology |
The significant hydrogeological systems around the RGM are greenstones and granitic gneissose rocks. Formation of groundwater in these systems is determined by the development of secondary structures such as fractures, faults and weathering and shearing within the greenstones. These systems have a low to moderate ground water potential. Shallow ground water is vulnerable to contamination from improperly built facilities and application of fertilisers, herbicides, pesticides, oils, chemicals and any run-off. Water sources built downstream of sanitation facilities are at most risk of contamination (Waterkings 2012).
| — | General groundwater potential: low to moderate. |
| — | Abstraction facilities: boreholes, deep and shallow wells. |
| — | General water strike range: 15 to 60 m. |
| — | Borehole depth: 40 to 80 m. |
| — | Deep well depth: 10 to 20 m. |
| — | Shallow well depth: <10 m along river channels and low laying areas. |
| — | Water level range: 5 to 30 m. |
| — | General average yield: 0.02–2.0 litres per second (l/s). |
| — | General water quality: Good for human consumption, crops and livestock consumption (Waterkings 2012). |
In the opinion of the QP, the data used to inform the groundwater models is of adequate quality.
In the opinion of the QP, this data is adequate for use in the mine design and mine schedules, and for the purposes used in this TRS.
| 9.5 | Processing and recovery methods data verification |
The process plant remains on C&M. Process historical data and performance are provided under Section 14.
In the opinion of the QP, the processing and recovery methods data used to inform product predictions are adequate for the purposes used for this TRS.
| Project No PS213686 | WSP |
| Redwing Mine | January 2025 |
| S-K 1300 Technical Report Summary | Page 41 |
| Bulawayo Mining Company Limited |
| 10 | Mineral processing and metallurgical testing |
| 10.1 | Nature and extent of mineral processing and metallurgical testing |
| 10.1.1 | Mineral processing |
RMG has a long history of mining and processing extending back to discovery in 1889 (Section 5) that provides a guide to metallurgical performance and gold recovery. Most recently Lonrho operated the mine from 1980 to 2002 when it was acquired by Metallon. The mine was then operated until it flooded in 2008, following which tailing sands were processed until 2013. The mine was then dewatered and recommenced production in November 2015. Declining production at lower than forecast grades resulted in uneconomic operation and a decision to place in the mine on C&M 1 April 2019. The process route for the mothballed plant entails treatment in stages comprising crushing, milling, gravity separation, flotation, Merril-Crowe Process, CIP, and elution. The plant recent production record since 1981 is presented in Figure 10.1 and indicates average recovery of 90% at an average feed grade of 3.15 g/t for the period 1981–2023 and average recovery of 86% at a lower average feed grade of 2.83 g/t for the period 2013–2018.
On recommencement of process operations with refurbished or replacement plant, recoveries in the range 86–90% could be expected.
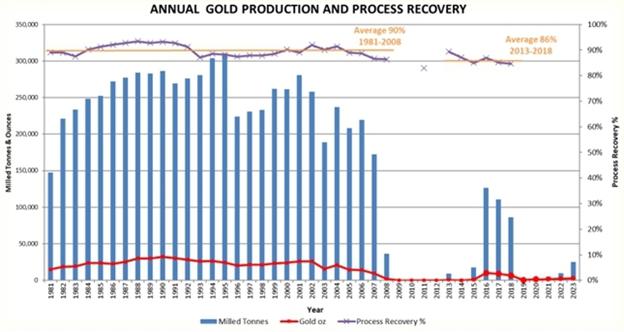
| Figure 10.1 | Process plant production and recovery 1981–2023 |
| Project No PS213686 | WSP |
| Redwing Mine | January 2025 |
| S-K 1300 Technical Report Summary | Page 42 |
| Bulawayo Mining Company Limited |
| 10.1.2 | Process testwork |
The only documented account of metallurgical testwork supplied by RMG was undertaken by Peacocke, Simpson & Associates who carried out test work on a bulk ore sample of the Redwing mill feed in October 1994. The average head assay of the sample was 1.93 g/t Au and the test work built back to a grade of 2.19 g/t Au. Knelson centrifugal concentration recovered 85.2% of the gold and out of this 53.19% could be considered as free gold with the remainder being associated with sulfides. A peak flotation recovery of 86% was achieved for a grade of 57.1 g/t Au. Evidence suggests a prolonged relatively gentle flotation pull best suits the mineral flotation kinetics. Losses to flotation tailings appear to be attributable to overground sulfides at 15 μm and unliberated sulfides grains which would require even finer grinding still. The “ultimate” grade achievable for a bulk sulfide was 117 g/t Au.
The testwork program also concluded that:
| — | Gravity recovery via a Knelson concentrator is optimal for a 70% passing 75 um grind size. |
| — | 71% of the gold in the flotation tailings is either expose or loosely bound in a sulphide matrix. A further 16% corresponds to gold well occluded in a sulphide matrix and 5% appears to correspond to very fine dissemination or a thorough occlusion. |
| — | The residual value in the tailings is due to a combination of ultra ground sulphides and unliberated sulphides. |
It is not clear from this work whether grind size has been optimised for an alternative CIP/CIL process route.
| 10.2 | Metallurgical sampling representativity |
From the range of testwork conducted by Peacock et al (1994) and the extended period operation of the plant, the QP is satisfied that the sampling and outcomes are representative of the various types and styles of mineralisation and the mineral deposit as a whole.
| — | Mill Sample-Grind Curve Generation: |
| — | A composite sample was subjected to grindability in a standard mill measuring percent passing of 75- μm vs grind time. |
| — | Mill Feed-Gravity Concentration: |
| — | Test work to investigate the recovery of Au via gravity concentration by grounding sample to 70% passing 75 μm. Free gold was observed. |
| — | Test work to investigate the recovery of Au via gravity concentration by grounding sample to 100% passing 75 μm. Free gold was also observed. |
| — | Mill Feed-Single Stage Flotation Test Grade/Recovery Relationship: |
| — | Test work to investigate the recovery of Au by flotation. Batched were cursed to 100% passing 3.13 mm and ground to 70% passing 75 μm. Four batch was also conducted from light pulling to heaviest pulling of concentrate. |
| — | Flotation Tailings-Diagnostic Leaching: |
| — | Test work to determine extraction of gold at various stages prior to and after acid washing, regrinding etc., and attempt to diagnose the physical and chemical nature of fold lock-up. |
| — | Mill Feed-Rougher/Cleaner Flotation Test: |
| — | Test work to investigate the recovery of Au cleaner flotation. |
| — | Final Concentrates-Gravity Concentration: |
| — | Test work to investigate the recovery of Au via gravity concentration. |
| Project No PS213686 | WSP |
| Redwing Mine | January 2025 |
| S-K 1300 Technical Report Summary | Page 43 |
| Bulawayo Mining Company Limited |
| 10.3 | Details of analytical or testing laboratories |
Sample analysis for underground ore mining and processing was completed at the onsite laboratory located at Redwing (refer to Section 10.1).
The Metallurgical Test work was carried out by Peacocke, Simpson & Associates (PVT) Ltd.
| 10.4 | Recovery Estimates |
The QP considers that the old underground ore process plant delivers recoveries that have historically averaged 86–90% as a guide to potential future process recovery.
No deleterious elements have been highlighted for underground sourced ore.
A finer grind size above 70% passing 75 µm may not necessarily improve recoveries for the mothballed flotation/Merril Crowe/CIL style plant as evidenced by the testwork. This testwork also indicated total sulfides content of <0.5%, mostly comprising pyrite accompanied by some galena, pyrrhotite, a few grains of chalcopyrite and molybdenite (one grain positively identified); some CuO was also observed (CN consumer); enclosure of free gold (~10 μm) in a gangue particle; more than 50% of the sulfides grains enclosed or attached to gangue particles; and with an average grain is ~15 μm. This suggests liberation and leach kinetics could be examined further to optimise recovery.
Further testwork for a CIP/CIL process route may be required to test the potential to optimise recoveries at finer grind sizes. Addressing process circuit operating efficiencies by plant refurbishment and/or replacement may also improve recoveries.
| 10.5 | QP’s opinion on adequacy of the data collected |
The QP considers that the historical operation of the flotation/Merrill-Crowe/CIL process route provides a guide to anticipated recoveries at rated throughputs. The intention to escalate production rates for any restart of operations will necessitate a review of both the process route and the best option for capital upgrade of the plant.
Recommencement of mining and process operations will require:
| — | A process feasibility study prior to significant refurbishment, upgrade and/or replacement of the existing plant. |
| — | Additional metallurgical testwork to assess alternate processing options to optimise recovery, throughput and cost. |
| Project No PS213686 | WSP |
| Redwing Mine | January 2025 |
| S-K 1300 Technical Report Summary | Page 44 |
| Bulawayo Mining Company Limited |
| 11 | Mineral Resource estimates |
| 11.1 | Key assumptions, parameters, and methods |
| 11.1.1 | Care and maintenance |
There has been no mining or exploration conducted since the mine was placed on C&M in April 2019. In the interim, the mine has flooded to approximately 50 m below surface. Therefore, in the QP’s opinion the 2018 assumptions regarding definition of the Mineral Resource base remain current.
| 11.1.2 | Resource database |
Data captured in Vulcan™ includes (KDM 2018):
| — | Survey data (pegs, drives, stopes, and raises). |
| — | Assay values, sample lengths and co-ordinates (channel and drill samples). |
| — | Orebody outlines digitised from assay entries. |
Various methods are used to capture data in Vulcan™. The major techniques used are digitising, American Standard Code for Information Interchange (ASCII) import, and direct capture onto datasheets.
| 11.1.3 | Geological interpretation |
The felsite orebody is a well-defined lithological unit that can be followed without difficulty. Mineralisation is confined to the felsite and linked to quartz stringers/veinlets, with sulphides present in varying concentrations (KDM 2018).
The MSZ orebodies (narrow reefs) are relatively narrow, and as such, well defined in terms of their geological boundaries. The ore shoots are delineated by assay cut-offs. These can be followed with a reasonable level of confidence (KDM 2018).
| 11.1.3.1 | Geological modelling – Vulcan™ |
Orebody boundaries are clearly defined, and the mineralisation envelope is defined by assay cut-offs. Narrow orebodies with little or no data between levels are digitised directly from assay plans into Vulcan™. Orebody outlines are constructed using plan sections defined by diamond drill hole intersects. These outlines (strings) are then modelled to create a three-dimensional (3D) orebody wireframe (triangulation). From exploration drilling, orebody models (triangulations) are first developed from cross-section envelopes defined by assay cut-offs. Models are then refined using plan sections guided by the triangulation developed on cross-sections. Plan sections are then modelled to produce final orebody wireframe (KDM 2018).
| 11.1.4 | Data preparation |
For the derivation of larger sample support, and to provide equal weighting to all samples, combined channel and diamond drill core assay data is composited to 1 m sample lengths for the Felsite orebody. For the MSZ, compositing was completed using geology and run length compositing (KDM 2018).
| 11.1.5 | Exploratory data analysis |
To account for the local variation in the distribution of assay information in respective mine sections, the mine is divided into portions to allow for the effective treatment of available information. Not all data from the historical sections of the mine were captured as part of this exercise, however; data from relatively new working areas was. RMC Zimbabwe plans to eventually capture all data, to provide a complete picture of the mine (KDM 2018).
The major sources of data used for Mineral Resource estimation were channel, and diamond drill core samples. Samples from the MSZ were top cut to a maximum value of 20 grams per tonne (g/t) Au, while samples from the Felsite were top-cut to 10 g/t Au. Top-cut values were derived from values at the 95th percentile of the respective sample populations. No re-estimation of tonnage and grade of the Mineral Resource blocks and pillars in the historical sections of the RGM was completed (KDM 2018).
| Project No PS213686 | WSP |
| Redwing Mine | January 2025 |
| S-K 1300 Technical Report Summary | Page 45 |
| Bulawayo Mining Company Limited |
| 11.1.5.1 | Geostatistical analysis |
Semivariograms in the direction of strike were prepared and used to derive estimation parameters (KDM 2018). A summary is presented in Table 11.1.
Table 11.1 Variography summary (KDM 2018)
| Section | ||||||||||||||||||||||||||||||||||||
| Kriging Parameters | Felsite | 14V Central | 10V 355 Area | 10V East | 16V East | Kent | Village North | 4L Simbi 175 | 3L Karen 027 | |||||||||||||||||||||||||||
| Number of Structures | 1 | 1 | 1 | 1 | 1 | 1 | 1 | 1 | 1 | |||||||||||||||||||||||||||
| Type of Structure | Spherical | Spherical | Spherical | Spherical | Spherical | Spherical | Spherical | Spherical | Spherical | |||||||||||||||||||||||||||
| Nugget | 1.38 | 1.27 | 0.35 | 1.00 | 0.5 | 2.00 | 1.56 | 1.35 | 1.08 | |||||||||||||||||||||||||||
| Sill Differential | 0.88 | 2.65 | 3.26 | 1.87 | 2.10 | 1.30 | 2.15 | 2.35 | 1.77 | |||||||||||||||||||||||||||
| 11.1.6 | Dry bulk density |
BD determinations were conducted in-house by the RGM assay laboratory technicians on samples collected from underground development material. Sample material was obtained from sources in both the MSZ and Felsite. The exercise initially commenced in 1997, to validate the historical figure of 2.70 t/m3 that was in use. Confirmatory re-runs were completed in 2001 and 2017, producing similar results (KDM 2018).
While the current value is considered valid and adequate, RMC Zimbabwe’s ultimate aim is to create a running database that, in addition to being a basis for the derivation of the accepted BD determination, enables some empirical monitoring of trends with orebody, lithology, or other spatial variations (KDM 2018).
| 11.1.7 | Block models |
Block models were developed parallel to the general strike of the orebody. A total of nine block models were developed.
Table 11.2 presents the block dimension schemes used for 30 June 2018 block models.
Table 11.2 Block dimension schemes for the 30 June 2018 block models (KDM 2018)
| Section | ||||||||||||||||||||||||||||||||||||
| Block Details | Felsite | 14V Central | 10V 355 Area | 10V East | 16V East | Kent | Village North | 4L Simbi 175 | 3L Karen 027 | |||||||||||||||||||||||||||
| Parent Block Dimensions | ||||||||||||||||||||||||||||||||||||
| X Block Size (m) | 10 | 7 | 8 | 8 | 7 | 5 | 5 | 5 | 5 | |||||||||||||||||||||||||||
| Y Block Size (m) | 10 | 1 | 1 | 1 | 1 | 5 | 5 | 3 | 3 | |||||||||||||||||||||||||||
| Z Block Size (m) | 10 | 7 | 8 | 8 | 7 | 5 | 5 | 10 | 15 | |||||||||||||||||||||||||||
| Sub-block Dimensions | ||||||||||||||||||||||||||||||||||||
| X Size (m) | 1 | 1 | 1 | 1 | 1 | 1 | 1 | 2.5 | 2.5 | |||||||||||||||||||||||||||
| Y Size (m) | 1 | 0.5 | 0.5 | 0.5 | 0.5 | 1 | 1 | 1.5 | 1.5 | |||||||||||||||||||||||||||
| Z Size (m) | 1 | 1 | 1 | 1 | 1 | 1 | 1 | 5 | 5 | |||||||||||||||||||||||||||
| Project No PS213686 | WSP |
| Redwing Mine | January 2025 |
| S-K 1300 Technical Report Summary | Page 46 |
| Bulawayo Mining Company Limited |
| 11.1.8 | Grade interpolation parameters |
Table 11.3 presents the kriging parameters generated from variographic analysis.
| Table 11.3 | Kriging parameters generated from variographic analysis (KDM 2018) |
| Section | ||||||||||||||||||||||||||||||||||||
| Kriging Parameter | Felsite | 14V Central | 10V 355 Area | 10V East | 16V East | Kent | Village North | 4L Simbi 175 | 3L Karen 027 | |||||||||||||||||||||||||||
| Number of Structures | 1 | 1 | 1 | 1 | 1 | 1 | 1 | 1 | 1 | |||||||||||||||||||||||||||
| Type of Structure | Spherical | Spherical | Spherical | Spherical | Spherical | Spherical | Spherical | Spherical | Spherical | |||||||||||||||||||||||||||
| Nugget | 1.38 | 1.27 | 0.35 | 1.00 | 0.5 | 2.00 | 1.56 | 1.35 | 1.08 | |||||||||||||||||||||||||||
| Sill Differential | 0.88 | 2.65 | 3.26 | 1.87 | 2.10 | 1.30 | 2.15 | 2.35 | 1.77 | |||||||||||||||||||||||||||
| Ellipsoid Range | ||||||||||||||||||||||||||||||||||||
| Major Radius (m) | 14 | 12 | 9 | 7 | 5 | 6.9 | 9.99 | 11.5 | 18 | |||||||||||||||||||||||||||
| Semi-major Radius (m) | 8 | 1 | 1 | 1 | 1 | 1.0 | 1.33 | 4 | 8 | |||||||||||||||||||||||||||
| Minor Radius (m) | 15 | 12 | 9 | 8 | 5 | 5.0 | 5.26 | 0.9 | 0.9 | |||||||||||||||||||||||||||
| Rotation about the Z-axis (bearing) [°] | 99 | 102 | 145 | 108 | 96 | 71 | 107 | 310 | 300 | |||||||||||||||||||||||||||
| Rotation about the Y-axis (plunge) [°] | 0 | 0 | 0 | 0 | 0 | -1.14 | 0 | -11 | 0 | |||||||||||||||||||||||||||
| 11.1.9 | Grade estimation |
Ordinary Kriging (OK), using the developed semi-variogram parameters was used to assign individual block grades. Mining blocks, pillars and remnants had their tonnages and grades reported as defined by the constraining triangulations, and other specific sub-divisions or demarcations of the orebody. For those sections with only sparse information, Inverse Distance Squared (ID2) estimation using variographic parameters from adjoining sections was adopted (KDM 2018).
| 11.1.10 | Model validation |
| 11.1.10.1 | Visual comparisons conducted by RMC Zimbabwe |
A visual comparison between estimated block grades, and original drill hole assay data was conducted in Vulcan™. In addition, sections were cut along and across strike to check the block model fit, and general continuity of the estimates within the pre-defined constraining envelope (the orebody wireframes) [KDM 2018].
| Project No PS213686 | WSP |
| Redwing Mine | January 2025 |
| S-K 1300 Technical Report Summary | Page 47 |
| Bulawayo Mining Company Limited |
| 11.1.10.2 | Visual comparisons conducted by WSP |
No figures of the visual comparisons were presented in KDM 2018. WSP conducted visual comparisons in Vulcan. A section, looking east, comparing the 40L 020 Bund block model grades and the drill hole assay results is presented in Figure 11.1.
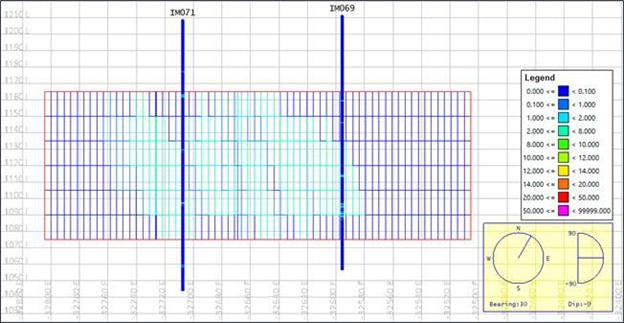
| Figure 11.1 | 40L 020 Bund block grade and drill hole comparison |
| 11.2 | Mineral Resources classification |
Classification of blocks into relevant groupings was completed following standard procedures as defined and recommended in the SAMREC (2016). The stoping pay-limit defines the lower grade cut-off that is used in the process (KDM 2018).
The COG defined for Mineral Resource blocks was 1.60 g/t Au for the MSZ, and 1.30 g/t Au for the Felsite (KDM 2018). WSP has not re-classified the mineral resource blocks.
RMC Zimbabwe undertook Mineral Resource classification for Measured, Indicated, and Inferred Mineral Resources as presented in Sections 11.2.1, to 11.2.3.
| 11.2.1 | Measured Mineral Resources |
Measured Mineral Resource blocks required close-spaced drilling from levels and block raises at 5 to 8 m intervals for Felsite, and 4 m for MSZ (where the reef is wider than development dimensions). The MSZ is otherwise channel sampled at 2 m intervals only along the drives, and in raises (KDM 2018).
The following classification criteria were applied to each mineralisation style (KDM 2018):
| 11.2.1.1 | MSZ |
| — | Developed on four sides (two drives and two connecting raises) |
| — | Developments ends adequately sampled |
| Project No PS213686 | WSP |
| Redwing Mine | January 2025 |
| S-K 1300 Technical Report Summary | Page 48 |
| Bulawayo Mining Company Limited |
| — | Sampling by diamond saw conducted along drives at 2 m intervals |
| — | Core sampled on nominal 1 m sample lengths, depending on geology and apparent mineralisation |
| — | Sub-drives that are 25 m apart sampled and raises connecting sub-levels sampled |
| — | Where shear zone is wider than development dimensions, diamond drilling (profiling) to beyond the limits of the orebody, completed at 4 m stations |
| — | Blocks bound by interpolation between development and drill core sample assay results |
| — | Tape and compass survey of drill hole collar position and direction |
| — | COG of 1.60 g/t Au (30% below the 2018 MRMR pay limit) |
| — | No allowance made for geological or pillar losses. |
| 11.2.1.2 | Felsite |
| — | Developed on at least three sides |
| — | Development ends adequately sampled |
| — | Raises mined at 25 m centres perpendicular to the strike, following hanging-wall contact of the orebody |
| — | Diamond drill stations at 5 to 8 m intervals along raises and contour drives connecting the raises, and up and/or down-dip drill holes drilled perpendicular to the Felsite body beyond the lithological contacts |
| — | Core sampled on nominal 1 m sample lengths, depending on geology and apparent mineralisation |
| — | Channel samples cut across the Felsite-width exposed in the raises and drives, in combination with drill holes, resulting in a complete sampled section across the orebody |
| — | Blocks bound by interpolation between development and drill core sample assay results |
| — | Tape and compass survey of drill hole collar position and direction |
| — | COG of 1.30 g/t Au (30% below the 2018 MRMR pay limit) |
| — | No allowance made for geological or pillar losses. |
| 11.2.2 | Indicated Mineral Resources |
Indicated Mineral Resource blocks required wide-spaced core drilling on a nominal grid pattern with mineralised zone strike limits defined by projected geological boundaries, where no drill information is available.
The following classification criteria were applied to each mineralisation style (KDM 2018):
| 11.2.2.1 | MSZ |
| — | Developed and sampled on at least one development drive and falls within projected geological boundaries of a mineralised zone, with limits extending to no more than 20 m up and down-dip of the developed end |
| — | Extensions to existing blocks or to blocks being mined or mined out, where geological continuity is confirmed are also considered to be sufficient |
| — | Polygonal estimation method on drill hole intersections spaced not more than 50 m apart |
| Project No PS213686 | WSP |
| Redwing Mine | January 2025 |
| S-K 1300 Technical Report Summary | Page 49 |
| Bulawayo Mining Company Limited |
| — | Surveying of drill holes limited to collar only |
| — | Block boundaries not more than 25 m beyond the pierce point on strike and dip, but within projected geological boundaries |
| — | COG of 1.60 g/t Au (30% below the 2018 MRMR pay limit) |
| — | No allowance made for geological or pillar losses. |
| 11.2.2.2 | Felsite |
| — | Developed and sampled on at least one development drive and falls within projected geological boundaries of a mineralised zone, with limits extending to no more than 50 m up and down-dip of the developed end |
| — | Extensions to existing blocks or to blocks being mined or mined out, where geological continuity is confirmed are also considered to be sufficient |
| — | Polygonal estimation method on drill hole intersections spaced not more than 100 m apart |
| — | Surveying of drill holes limited to collar only |
| — | Block boundaries not more than 50 m beyond the pierce point on strike and dip, but within projected geological boundaries |
| — | Vertical and inclined drill holes drilled at a nominal 100 m spacing along strike |
| — | COG of 1.30 g/t Au (30% below the 2018 MRMR pay limit) |
| — | No allowance made for geological or pillar losses. |
| 11.2.3 | Inferred Mineral Resources |
Indicated Mineral Resource blocks constituted drill core intersection or projection beyond an Indicated Mineral Resource block, where continuity is assumed but not verified.
The following classification criteria were applied to each mineralisation style (KDM 2018):
| 11.2.3.1 | MSZ |
| — | Polygonal estimation method on drill hole intersections spaced not more than 100 m apart |
| — | Projections on dip or strike in areas adjacent to an Indicated Mineral Resource block but falling within defined geological boundaries |
| — | Block grade based on drill hole intersections or projection from adjacent blocks falling within defined geological boundaries. |
| 11.2.3.2 | Felsite |
| — | Polygonal estimation method on drill hole intersections spaced not more than 100 m apart |
| — | Projections on dip or strike in areas adjacent to an Indicated Mineral Resource block but falling within defined geological boundaries |
| — | Block grade based on drill hole intersections or projection from adjacent blocks falling within defined geological boundaries. |
| 11.3 | Cut-off grade, price, and justification |
A new COG for 2023 was calculated based on the three-year trailing average gold price at December 2023 (with a gold price multiplier of 30%), applicable mill recovery, and revised operating and sustaining capital costs.
| Project No PS213686 | WSP |
| Redwing Mine | January 2025 |
| S-K 1300 Technical Report Summary | Page 50 |
| Bulawayo Mining Company Limited |
Table 11.4 presents the parameters applied for definition of the 31 December 2023 Mineral Resource on an in-situ basis.
Table 11.4 31 December 2023 COG estimation parameters
| Run of Mine (ROM) | ||||||||
| Parameter | Felsite | MSZ | Combined | Comment | ||||
| COG (g/t Au) | 1.06 | 1.53 | 1.26 | Estimated based on the Au +30% price, applicable mill recovery, operating and sustaining capital costs. | ||||
| Residues (g/t Au) | 0.40 | 0.40 | 0.40 | Average process recovery of 90 % based on the average MI Mineral Resource grade of 3.83 g/t | ||||
| Direct Operating Cost (C1) [US$/t] | 49.32/t | 85.28/t | 64.64/t | 2023 value terms | ||||
| Indirect Operating Cost (US$/t) | 7.39/t | 7.39/t | 7.39/t | Long term average at December 2023 | ||||
| Sustaining Capital Cost (US$/t) | 10.53/t | 10.53/t | 10.53/t | Long term average at December 2023 | ||||
| Exchange Rate | N/A | |||||||
| Tonnage (t) | 9,032 | 6,701 | 15,733 | Estimated throughput for fixed and variable cost components | ||||
| Assay Plan Factor (APF) [%] | 82.9 | 82.9 | 82.9 | N/A | ||||
| Block Factor (BF) [%] | 100 | 100 | 100 | N/A | ||||
| Au Price (US$/oz) | 1,800 | Pricing based on the 3-year trailing average Au price | ||||||
| Au Price +30% (US$/oz) | 2,340 | 30% uplift on the 3-year trailing average Au price | ||||||
Notes: Applied COGs are based on a marginal cost analysis assuming direct operating costs only.
11.3.1 Tonnage-grade factors
The pay limit estimation parameters presented in Table 11.4 are explained as follows:
11.3.1.1 Assay plan factor
An APF of 82.9% was estimated based on 3 year trailing monthly average estimates for the period through to August 2018 when the operation was placed on care and maintenance. This factor is the equivalent of the Mine Call Factor (MCF) and refers to the gold content and not grade as such and is defined as the relationship between gold accounted for (bullion plus residue at the Plant) versus gold “called for” by the mine’s measuring and evaluation methods. This factor was used in the pay limit calculation and was applied to the grade only (Golder 2021).
APF = Mineral content accounted for from ore treated (recovery + residue) x 100% / Mineral content called for based on current sampling
WSP review called into question the reliability of data supporting APF estimates for Redwing given poor production performance due to power outage, equipment and consumables restrictions for the period 2015-18, such that a 100% factor was ultimately assumed for definition of COGs and Mineral Resources.
11.3.1.2 Block factor
The Block Factor (BF) is defined as the ratio, expressed as a percentage, where the specific mineral content of the ore broken from a Mineral Reserve block as indicated by current sampling results is compared to the estimated Mineral Reserve block content (Golder 2021). A BF of 100% was assumed due to the lack of reliable data for the last three years.
BF = Current sampling contents x 100% / Estimated block contents
11.3.1.3 Block call factor
The Block Call Factor (BCF) was calculated from the APF and BF. This factor refers to gold content and not grade and is defined as the total specific mineral content of the ore broken from a Mineral Reserve block as indicated by the current sampling results adjusted by the APF versus the estimated Mineral Reserve block content (gold content called for). This factor was applied to the grade only (Golder 2021).
BCF = BF x APF x 100% (by block)
| Project No PS213686 | WSP |
| Redwing Mine | January 2025 |
| S-K 1300 Technical Report Summary | Page 51 |
| Bulawayo Mining Company Limited |
11.3.1.4 Mine Call Factor
A Mine Call Factor (MCF) of 82.9% was calculated for Redwing mine as an average for all mining blocks blocks based on 3 year trailing monthly average data excluding +10% outliers and non-production months, whereby:
MCF = BF x APF x 100% (all blocks)
On review, WSP adopted an MCF of 100% due to data unreliability.
11.3.1.5 Extraction ratio
An Extraction Ratio (ER) of 95% was applied for the MSZ and 85% for felsite mineralisation to account for ore locked up in pillars and for ore losses in the stopes (broken but no recovered) (Golder 2021).
11.3.1.6 Dilution
A dilution factor has been applied generally based on the orebody dip where wider, steeper orebodies are accorded a lower level of dilution, applied by reef as follows:
| — | 10% at 0.0 g/t Au: for Felsite orebodies. |
| — | 15% at 0.0 g/t Au: for steeply dipping Rezende, Karen, 175 Simbi, 4 Level 345 Area, and Village North reef. |
| — | 20% at 0.0 g/t Au: for narrow reefs on Bromley, Doorstep, Kent, and Tyler sections. |
11.3.2 Cut-off Grade
The COG is calculated using the following formula:
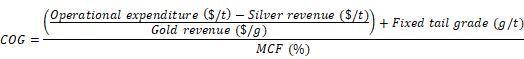
WSP inspected recent reconciliation factors for Redwing where a BF was not estimated (assumed 100%) and where the APF was significantly impacted by poor recent year operational performance (2015-18). Therefore, for the purpose of definition of Mineral Resources, WSP took the decision to leave the MCF for Redwing at 100% rather than 83%. This was also influenced by inspection of the historical process recovery that indicated an average 90% compared to a fixed tail adopted in the COG calculation, equivalent to 72% - 79% recovery. It should also be noted that the MCF is influenced by the mining method, selectivity and efficiency of mining. WSP took the view that any future planned extraction of the resource will deliver better planned outcomes.
| 11.4 | Mineral Resources statement |
The basis of the Property’s Mineral Resources estimate and how it is generated are summarised below. The Mineral Resources estimate for the Property is reported herein in accordance with the requirements detailed in S-K 1300. For estimating the Mineral Resources, the following definition of Mineral Resource as set forth in S-K 1300 is applied:
“Mineral resource is a concentration or occurrence of material of economic interest in or on the Earth’s crust in such form, grade or quality, and quantity that there are reasonable prospects for economic extraction. A mineral resource is a reasonable estimate of mineralisation, taking into account relevant factors such as cut-off grade, likely mining dimensions, location or continuity, that, with the assumed and justifiable technical and economic conditions, is likely to, in whole or in part, become economically extractable. It is not merely an inventory of all mineralisation drilled or sampled.”
| Project No PS213686 | WSP |
| Redwing Mine | January 2025 |
| S-K 1300 Technical Report Summary | Page 52 |
| Bulawayo Mining Company Limited |
A new COG for 2023 was calculated, as detailed in Section 11.3.
The Mineral Resources estimates (exclusive of Mineral Reserves) for the Property are presented in Table 11.5 and Table 11.6.
The effective date of the Mineral Resources estimates is 31 December 2023.
The underground Mineral Resource comprises:
| — | 9.65 Mt at 3.83 g/t Au, for approximately 1,188 koz of gold (underground Measured and Indicated Mineral Resources). |
| — | 15.83 Mt at 2.61 g/t Au, for approximately 1,328 koz of gold (underground Inferred Mineral Resources). |
Table 11.5 presents the underground Measured and Indicated Mineral Resources (exclusive of Mineral Reserves) reported as at 31 December 2023 on an in-situ basis.
| Table 11.5 | RGM underground Mineral Resource estimate as of 31 December 2023 |
| Category | Tonnage (Mt) | Au Grade (g/t) | Au Metal (koz) | |||||||||
| Underground | ||||||||||||
| Measured Resources | 1.45 | 2.92 | 136 | |||||||||
| Indicated Resources | 8.20 | 3.99 | 1,052 | |||||||||
| Grand Total | 9.65 | 3.83 | 1,188 | |||||||||
Notes: Mt = million tonnes; Au = gold; g/t = grams per tonne; koz = thousand ounces.
Table 11.6 presents the underground Inferred Mineral Resources reported as at 31 December 2023 on an in-situ basis.
| Table 11.6 | RGM underground Inferred Mineral Resource estimate as of 31 December 2023 |
| Category | Tonnage (Mt) | Au Grade (g/t) | Au Metal (koz) | |||||||||
| Underground | ||||||||||||
| Inferred Resources | 15.83 | 2.61 | 1,328 | |||||||||
| Grand Total | 15.83 | 2.61 | 1,328 | |||||||||
Notes: Mt = million tonnes; Au = gold; g/t = grams per tonne; koz = thousand ounces.
It should be noted that the underground Mineral Resources estimate for the Property is reported exclusive of Mineral Reserves. The Property does not have a current Mineral Reserve. For more details the reader is referred to Section 5.6.
It should be noted that the sands (tailings) Mineral Resources estimate for the Property is not included as part of the Mineral Resources for the Property, as the RGM does not currently possess a processing facility capable of processing the sands (tailings) material.
The Mineral Resources presented in this Section are not Mineral Reserves, and do not reflect demonstrated economic viability. The reported Inferred Mineral Resources are considered too speculative geologically to have the economic considerations applied to them that would enable them to be categorised as Mineral Reserves. There is no certainty that all or any part of this Mineral Resource will be converted into Mineral Reserve.
All figures are rounded to reflect the relative accuracy of the estimates and totals may not add correctly.
| Project No PS213686 | WSP |
| Redwing Mine | January 2025 |
| S-K 1300 Technical Report Summary | Page 53 |
| Bulawayo Mining Company Limited |
Based on the geological results presented in this TRS, supported by the assumptions made by RMC Zimbabwe (presented in Section 11.3), it is the QP’s opinion that the Mineral Resources have RPEE.
Further exploration, and technical studies are required to confirm the economic feasibility of the Property, and to allow the estimation and reporting of a Mineral Reserve.
| 11.5 | Uncertainty in the estimates of Inferred, Indicated, and Measured Mineral Resources |
The QP is satisfied that the stated Mineral Resources classification reflects the appropriate level of confidence and considers those factors relevant to the deposit. The application of resource categories appropriately considers the relevant factors used in the classification process.
Some examples of specific factors that can influence the risk and uncertainty of the Mineral Resources estimates that are considered in the resource classification include:
| — | Interpretation of the mineralisation boundary. |
| — | Drill hole spacing and adequacy in defining geology, mineralisation, structure, and grade. |
| — | Quality of samples, assays, and geological information. |
| — | The Mineral Resource estimation has only been subjected to visual validation. Standard industry practice is to conduct both visual and statistical validation. |
| — | The COG used for Mineral Resource classification (1.30 g/t Au for Felsite ore, and 1.60 g/t Au for MSZ ore) seem reasonable on face value, however; the methodology used for determination of these values has not been clearly reported by RMC Zimbabwe and requires further explanation. |
| — | The nominal estimates for ER are presumably based on historical experience. WSP recommends maintaining a detailed stope file, and accounting for ER (and APF, BF, BCF) on a stope-by-stope basis. This approach may provide a more targeted application based on stoping area, method, orebody disposition and ground conditions. |
| — | WSP recommends reviewing on an individual stope performance basis to test and vary the relatively nominal assumptions. This could include modelling of dilution skins and using block model grades. |
| — | The Mineral Resources estimates have been estimated to two decimal places for gold grade, and to the nearest tonne for tonnage, but have been reported to one decimal place for gold grade, to the neatest ounce for metal content, and to the nearest thousand tonnes for tonnage when reported in summary tables in the Mineral Resources Mineral Reserves (MRMR) technical report (KDM 2018). |
| — | The Mineral Resource estimation has only been subjected to visual validation by RMC Zimbabwe staff. Standard industry practice is to conduct both visual, and statistical validation. |
The Mineral Resources have addressed RPEE, and have considered a mining, metallurgical, and environmental factors.
Mineral Resources confidence is also assessed via independent reviews and internal peer reviews conducted at key stages of the Mineral Resources estimation process.
The Mineral Resources presented are not Mineral Reserves, and do not reflect demonstrated economic viability. The level of geological uncertainty associated with the reported Inferred Mineral Resources is considered too speculative to apply relevant economic, and technical factors to have the economic considerations applied that would enable these to be categorised as Mineral Reserves. There is no certainty that all or any part of the Inferred Mineral Resources will be converted into Mineral Reserves. All figures are rounded to reflect the relative accuracy of the estimates and totals may not sum exactly as a consequence.
| Project No PS213686 | WSP |
| Redwing Mine | January 2025 |
| S-K 1300 Technical Report Summary | Page 54 |
| Bulawayo Mining Company Limited |
| 11.6 | QP’s opinion on factors likely to influence the prospect of economic extraction |
The main factors likely to influence the prospect of economic extraction include:
| — | Orebody definition. |
| — | Assigned dry bulk density. |
| — | Unconstrained estimate. |
| — | Commodity pricing. |
| — | Interpretations of fault geometries. |
| — | Underground geotechnical conditions. |
| — | Dilution considerations. |
| — | Underground dewatering requirements. |
The estimate of Mineral Resources may be materially affected by environmental, permitting, legal, title, socio-political, marketing, or other relevant issues including risks set forth in this TRS.
In the QP’s opinion, all of these factors are adequately considered for the Mineral Resources reported. Based on the body of technical studies completed across the Property, it is the QP’s opinion that the Mineral Resources have RPEE.
In the QP’s opinion, all issues relating to all relevant technical and economic factors likely to influence the prospects for economic extraction, can be resolved with the recommendations for further work outlined in Section 23.1.
| 12 | Mineral Reserves estimates |
Not applicable since this TRS is an Initial Assessment and no Mineral Reserves have been estimated.
Any future estimation of Mineral Reserves and potential recommencement of operations will require the support of an additional drilling and resource definition campaign and at least a pre-feasibility to feasibility level of evaluation.
| Project No PS213686 | WSP |
| Redwing Mine | January 2025 |
| S-K 1300 Technical Report Summary | Page 55 |
| Bulawayo Mining Company Limited |
| 13 | Mining methods |
This section is included to inform an Initial Assessment for the estimation of Mineral Resources.
| 13.1 | Introduction |
Three mining methods are applied at RGM depending on the nature of the orebody and the rock mechanics considerations. The geometry of each stoping block in terms of dip and width and the nature of the mineralisation largely determines the mining method:
| — | Up-Dip Room and Pillar: For stoping of the wide and shallow dipping (+35°) felsite. |
| — | Long Hole Open Stope: Used for the steeply dipping Rezende and Village North reefs (+70° and 65°) respectively. As conditions warrant, used in combination with the underhand mining method. |
| — | Underhand Mining Method: Used for the narrow, steeply dipping Bromley and Kent reefs. |
The mine formerly operated as a rail mine serviced by vertical and underlay (inclined shafts). Level development headings are of relatively small dimension of approximately 2 mW x 2 mH installed on approximately 100 foot (30 m) intervals. The mine is pneumatic powered with rail haulage via lead acid battery powered locomotives hauling rail cars to a shaft where it is hoisted to surface. Mining is conducted using conventional drilling and blasting techniques using handheld jackhammer machines. Minimal support is used, and explosives are manually initiated. Larger long hole stoping and underhand benching has employed larger pneumatic drill rigs secured by bar and arm.
There is no backfill used for stope support apart from opportunistic disposal of development waste.
Further options for mechanising the method to improve productivity could be considered, including alternate decline access and extraction.
| 13.2 | Parameters relative to the design and schedule |
| 13.2.1 | Geotechnical |
SRK conducted a geotechnical and rock engineering review at RGM in 2004.The key findings were listed:
| — | It is recommended to enhanced regular geological mapping of primary development and interrogation of borehole information to obtain better understanding of the rock mass conditions and potential response in mining. |
| — | 20 m maximum stope span be adopted in Felsite and Mineralised Quartz Shear Zone orebody. |
| — | 35 m mining spans be adopted in the Felsite orebody |
| — | Further work should be done to determine the most applicable mining method thru workshop of various mining methods with discussion of their advantages and disadvantages. |
An updated study was conducted still by SRK in 2016 revealing the following key findings:
| — | Previous assessments indicated the rock mass quality ranged from good to fair. However, SRK’s on-site evaluation found varying rock quality, ranging from good to poor. Shallow depth areas are particularly susceptible to deterioration due to weathering and water presence. |
| — | Tunnels generally do not require support for stability, except at intersections with geological features like faults and reef junctions, where support is necessary to maintain stability. |
| — | Stope stability assessments highlighted the need for roof support specifically in areas containing Felsite and Mineralised Quartz reefs. |
| Project No PS213686 | WSP |
| Redwing Mine | January 2025 |
| S-K 1300 Technical Report Summary | Page 56 |
| Bulawayo Mining Company Limited |
The current stope design is acceptable and can be applied at shallow depths. The mining layout comprises the following dimensions:
| — | Rib pillar width of 5 m for the Felsite ore body, |
| — | Sill pillar width of 10 m for the Felsite ore body, |
| — | Rib pillar width of 3 m for the mineralised quartz shear zone, |
| — | Sill pillar width of 10 m for the Mineralised quartz shear zone, |
| — | Dip span of 100 m between sill pillars for both ore bodies, |
| — | Strike span 20 m between rib pillars for both ore bodies. |
Earlier studies relating to pillar design:
| — | Budavari S. July 1991. Some rock mechanics problems experienced at Rezende Mine. University of Witwaterrsrand. Prepared for Independence Mining (PVT) Limited. |
| — | Un-named. November 1991. Rock mechanics investigation: Old West and Redwing Mines. Report No. RW7. |
| 13.2.2 | Hydrogeological |
Based on historical data, Redwing Mine is categorised as relatively wet, necessitating a robust dewatering system to manage both drilling water and groundwater. It is expected that the existing dewatering infrastructure, designed to handle flooded areas, will suffice to address future natural water inflows and drilling water. Most of the water during increased production levels will stem from drilling activities and groundwater from underground aquifers.
Supplementary to stage pumps, submersible spindle pumps will be utilised to drain the shaft bottom, diverting excess water to higher-level sumps. Much of the planned underground mine infrastructure for the proposed production increase is currently submerged, highlighting the critical need for dewatering down to the 18th level. It is estimated that this dewatering process will span approximately 2 years to remove 3.6 million cubic meters of water. This program entails procuring additional dewatering pumps to supplement the existing ones. The dewatering phase will facilitate further exploration of upper-level resources and pave the way for the commencement of production in the upper levels within a 24-month timeframe.
The mine was flooded to the 7 level prior to closure in 2019, and this means that 71% of the resource is currently unavailable due to flooding. The declared resources indicate that the majority lie below 6 level and thus giving only 29% lying above 6 level. The water is currently being pumped at 10,000 cubic metres per month and thus giving a gain of 0.2 m per month.
The mine is currently flooded to approximately 50 m below surface and will require a significant program of mine dewatering to recover access to workings.
| 13.3 | Production parameters |
| 13.3.1 | Production rates |
Production rates for the purpose of an initial assessment have been drawn from a history of previous operation and the QP’s assessment of what is technically achievable. This has considered production ramping up from an average production rate of 30 kt per annum to 1,200 kt per annum.
| 13.3.2 | Expected mine life |
Using the production rate mentioned above, the initial assessment has considered a potential mine life of 18 years.
| Project No PS213686 | WSP |
| Redwing Mine | January 2025 |
| S-K 1300 Technical Report Summary | Page 57 |
| Bulawayo Mining Company Limited |
| 13.3.3 | Mining model |
RGM is in the process of changing from manual reserve estimation techniques to CAD methods using block models. The manual method involves using average stope widths diluted from the minimum mining width multiplied by the plan area of stoping to determine stope volumes and tonnages. Grades are determined by taking a weighted average of local stope and development grades and mineralisation widths and diluting this out to the average stope width. This method is being replaced by the introduction of resource block modelling techniques, interrogated using mineralisation and stope design wireframes.
RGM applies a standard minimum stope width of 90 cm for the purpose of defining stope envelopes for estimating the Mineral Reserve; however, it is evident that the mining width accepted in practice can be considerably wider than the minimum as evidenced by the escalation in BF (hoist versus break) compared to APF (reconciled mill feed versus hoist) (Table 13.1).
| Table 13.1 | Block call factors 2012–2018 (RGM Operations Reports) |
| Au (g) | BCF | |||||||||||||||||||
| Year | Depleted | Broken | BF (%) | APF (%) | APF x BF (%) | |||||||||||||||
| 2012 | 0 | 0 | 0.0 | 0.0 | 0.0 | |||||||||||||||
| 2013 | 0 | 0 | 0.0 | 0.0 | 0.0 | |||||||||||||||
| 2014 | 2,599 | 4,565 | 175.6 | 92.4 | 162.2 | |||||||||||||||
| 2015 | 3,286 | 7,396 | 225.1 | 86.6 | 194.9 | |||||||||||||||
| 2016 | 92,684 | 139,208 | 150.2 | 93.9 | 141.0 | |||||||||||||||
| 2017 | 289,318 | 520,860 | 180.0 | 89.3 | 160.8 | |||||||||||||||
| 2018 | 129,721 | 288,108 | 222.1 | 58.9 | 130.8 | |||||||||||||||
| TOTAL | 517,607 | 960,137 | 185.5 | 82.5 | 153.1 | |||||||||||||||
While there is always a balance to be struck between sufficient width to optimise productivity and minimum width to optimise for low dilution, the object being to optimise metal delivery at minimum cost, WSP recommends reviewing the approach based on the most recent data.
| 13.3.4 | Mining dilution and recovery factors |
A dilution factor has been applied generally based on the orebody dip where wider, steeper orebodies are accorded a lower level of dilution, applied by reef as follows:
| — | 10% at 0.0 g/t Au: for Felsite orebodies. |
| — | 15% at 0.0 g/t Au: for steeply dipping Rezende, Karen, 175 Simbi, 4 Level 345 Area, and Village North reef. |
| — | 20% at 0.0 g/t Au: for narrow reefs on Bromley, Doorstep, Kent and Tyler sections. |
WSP again recommends reviewing on an individual stope performance basis to test and vary the relatively nominal assumptions. This could include modelling of dilution skins and using block model grades.
Further grade factors are applied as a block call factor on grade from reconciliation on a six monthly basis, while global mining recovery factors are applied as an extraction ratio in the following fashion:
Assay Plan Factor (APF):
An APF of 82.9% was applied using FY2015 to June 2018 production performance:
APF = Mineral content accounted for from
ore worked (recovery + residue) x 100%
Mineral content called for based on current sampling
| Project No PS213686 | WSP |
| Redwing Mine | January 2025 |
| S-K 1300 Technical Report Summary | Page 58 |
| Bulawayo Mining Company Limited |
Block Factor (BF):
RGM advise that a BF of 100% was accepted for use in defining the Mineral Resource but that this was not applied for conversion of Mineral Resource to Mineral Reserve. Calculated according to:
BF = Current sampling contents x 100%
Estimated block contents
Further explanation is required to substantiate the use of a BF of 100% when the average estimate for 2014-2018 is 185.5%.
Block Call Factor (BCF)
This is simply a call factor calculated by multiplying APF by BF and was assumed at 100% for conversion of the Mineral Resource to Mineral Reserve. Again, it is not clear nor adequately explained as to why this factor effectively excludes both the APF and BF for the purpose of conversion of resources to reserves. Inspection of block model estimation listings indicate that an APF of 83% and BF of 100% was applied in practice.
Extraction Ratio (ER)
An extraction ratio of 95% was applied for the MSZ and 85% for felsite mineralisation to account for ore locked up in pillars and for ore losses in the stopes (broken but no recovered).
These nominal estimates are presumably based on historical experience. WSP recommends maintaining a detailed stope file and accounting for ER (and APF, BF, BCF) on a stope-by-stope basis. This approach may provide a more targeted application based on stoping area, method, orebody disposition and ground conditions.
| 13.4 | Mining fleet, machinery, and personnel requirements |
The current labour complement at RGM stands at 263 employees for the Care and Maintenance operations working 8 hours per day on two weeks on, two weeks off roster. Dayshift operations comprise Security (55), Process (40), Engineering (17), Mining (Pit Safety, 11), Safety & Environment (3) and Management & Survey (3).
A conceptual plan to recommence operations envisages a total labour workforce of 727, increasing to 872 as production ramps up from 150 ktpa to 1,285 ktpa. Three 8 hour shifts per day are planned.
A current capital equipment list detailing mining and process plant was not provided.
| 13.5 | Scheduling results |
This TRS is an initial assessment for the purpose of estimating Mineral Resources for which mining schedules supported by at least a pre-feasibility or feasibility study have not been prepared.
| Project No PS213686 | WSP |
| Redwing Mine | January 2025 |
| S-K 1300 Technical Report Summary | Page 59 |
| Bulawayo Mining Company Limited |
| 13.6 | Mining unit dimensions |
The mining layout comprises the following dimensions applied at shallow depths:
| — | Rib pillar width of 5 m for the Felsite orebody. |
| — | Sill pillar width of 10 m for the Felsite orebody. |
| — | Rib pillar width of 3 m for the mineralised quartz shear zone. |
| — | Sill pillar width of 10 m for the Mineralised quartz shear zone. |
| — | Dip span of 100 m between sill pillars for both orebodies. |
| — | Strike span 20 m between rib pillars for both orebodies. |
Table 13.2 presents the preliminary mining design parameters.
| Table 13.2 | Preliminary mining design parameters |
| Item | Description | Parameter | ||||
| Dimensions | Mining Width/Height | 2.0 m | ||||
| Room width (Function of Ground Conditions to be confirmed by geotechnical studies) | 7.0 m | Standard | ||||
| 15.0 m | Full Panel |
| 13.7 | Mine layout |
The RGM infrastructure comprises underground workings with headgear hoisting facilities, a processing plant, workshops, on-site assay laboratory and TSF. The general mine layout of the mine is presented in Figure 13.1.
Redwing Shaft is a rectangular shaft with dimensions of 5.0 m x 1.8 m and is used solely for ore hoisting. The shaft is equipped with two 4 t skips and a double drum winder. The temporary loading station for the skips is on the 6 Level.
Old West No2 Shaft, located to the east of the Redwing Shaft is the Old West No.2 Shaft, which is proposed in Virimai (2018) to be up graded to a hoisting shaft to compliment the tonnage going through the Redwing Shaft. The shaft currently extends to the 10 Level and has dimensions of 4.0 m x 1.75 m. The Old West No.2 Shaft is a three-compartment shaft. For the proposed five-year strategy, the shaft will need to be equipped with a double drum winder with two x 2 t skips hoisting from the 10 Level to surface. On surface, ore can be transported by trucks to the processing plant stockpile (Virimai 2018).
| Project No PS213686 | WSP |
| Redwing Mine | January 2025 |
| S-K 1300 Technical Report Summary | Page 60 |
| Bulawayo Mining Company Limited |
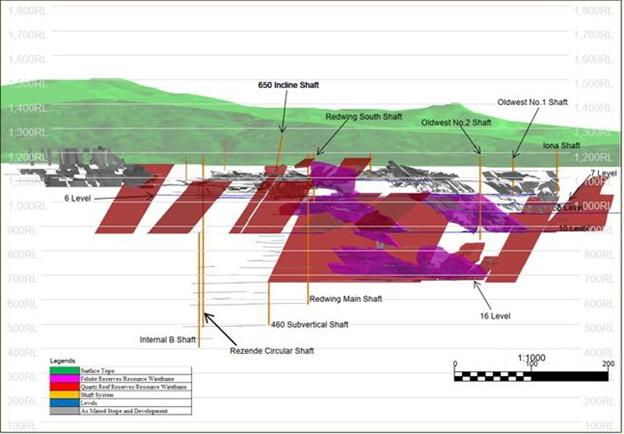
| Figure 13.1 | RGM mine layout looking south |
| 14 | Processing and recovery methods |
This section is included to inform an Initial Assessment for the estimation of Mineral Resources.
| 14.1 | Processing methodologies and flowsheets |
Ore processing involves treatment in stages comprising crushing, milling, gravity separation, flotation, Merril-Crowe Process, CIP, and elution. Gold-silver precipitates are smelted to produce buttons, which are then remelted and cast into bullion ingots. Monthly tailings deposition to the TSF is around 25 thousand tonnes per month (ktpm), which is nearing capacity (2019). Figure 14.1 presents the RGM processing flowsheet.
Virimai (2018) outlines a five-year strategy for RGM, aiming to ramp up production to 200 ktpm within two years upon resuming mining operations. This figure was chosen to achieve a Life of Mine (LOM) of around 10 years.
| Project No PS213686 | WSP |
| Redwing Mine | January 2025 |
| S-K 1300 Technical Report Summary | Page 61 |
| Bulawayo Mining Company Limited |
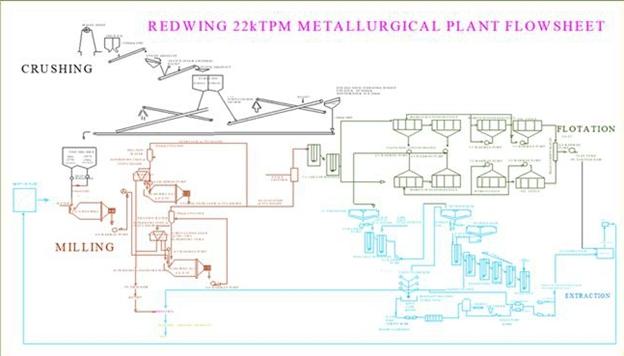
| Figure 14.1 | RGM processing flowsheet (Virimai, 2018) |
| 14.2 | Processing plant throughput and characteristics |
Crushing, milling, gravity, and flotation concentration processes, followed by cyanide hydrometallurgical operations and smelting are employed at the RGM to recover gold, with silver as a by-product. The processing plant has a capacity of up to 22 ktpm. Residue grades have typically been between 0.21 g/t Au (100% felsite ore) and 0.40 g/t Au (100% mineralised shear zone ore) [KDM 2018].
| Project No PS213686 | WSP |
| Redwing Mine | January 2025 |
| S-K 1300 Technical Report Summary | Page 62 |
| Bulawayo Mining Company Limited |
| 14.3 | Primary and secondary crushing |
| 14.3.1 | Primary crushing |
Minus 200 mm (run of mine) ore is reduced to minus 65 mm through a single stage open circuit crushing process employing one 14’’x 24’’ single toggle jaw crusher. The product is screened into minus 40 mm and plus 40 mm size fractions before secondary crushing.
| 14.3.2 | Secondary crushing |
A 41/4 short head Symons crusher operates close circuit with 5’ x 12’ and 4’ x 10’ DD screens respectively to produce a minus 14mm product for primary milling.
| 14.4 | Downhill conveying |
Two conveyors run from fine ore storage bins over Ramsey Series 30 belt weightometers to a belt feeding an 8’ x 12’ rod mill. The primary mill feeds two 6’6’’ x 20’ regrind mills operating in parallel.
| 14.5 | Product sampling |
Mill Feed sample for accounting purposes is collected from the Rod-mill feed conveyor at 15-minute intervals. Currently the rod mill is down, and belt cut sampling is done for plant mill feed grade. A sample is cut every 30 minutes, and a composite sample created every 4 hours. The composite sample is the sent to the assay laboratory for analysis.
| 14.6 | Product stockyard |
No data relevant to this section.
| 14.7 | Offshore tertiary crushing and screening |
No data relevant to this section.
| 14.8 | Energy and water process materials requirements |
| 14.8.1 | Mine power supply |
Power at RGM is sourced from the Zimbabwe Electricity Transmission and Distribution Company (ZETDC) via a 33 kV network encompassing five substations: Redwing, Rezende, Old West, Old West Plant, and Cyanide. The voltage is stepped down to 2.2 kV, 550V, or 380V for distribution. While power supply is generally reliable, it may experience fluctuations during the rainy season. The Redwing substation, serving as the primary source, transforms incoming power from 33 kV to 2.2 kV and 550 V. Two transformers, 3 MVA and 2 MVA, cater to the processing, compressors, and underground machinery. Additionally, two 500 kVA transformers power various facilities, including the crushing plant, milling, flotation plant, and administrative offices.
| Project No PS213686 | WSP |
| Redwing Mine | January 2025 |
| S-K 1300 Technical Report Summary | Page 63 |
| Bulawayo Mining Company Limited |
| 14.8.2 | Mine water management system |
Dewatering requirements for the underground mine are significant and utilised for process requirements in addition to recirculation from the TSF.
Underground water is pumped out of the mine by way of two shafts, namely the Redwing Main Shaft and the Rezende Shaft. A total of 11,200 m3 of water can be pumped per day, depending on availability of power. The Rezende Franklin pump delivers 150 m3/hour at a head of 200 m. The targeted volume per day is 12,000 m3. The current dewatering system consists of four pumps, two Franklin pumps, one Ritz pump and one WKLn 125 pump. The two Franklin pumps pump directly to the surface, whilst the Ritz pump stage pumps to a dam, which the WKLn 125 pump then pumps to surface (RGM Operations Reports).
| 14.9 | QP’s opinion |
The existing process plant for underground ore is in poor condition and utilises old process technology and equipment. It will require re-evaluation of the merits of upgrade or replacement prior to restart of operations.
The mine appears to lack a capital equipment inventory for the C&M operation which will require reconciliation as part of valuation and future feasibility assessment.
| 15 | Infrastructure |
This section is included to inform an Initial Assessment for the estimation of Mineral Resources.
| 15.1 | Rail access |
No rail access to the RGM.
| 15.2 | Port access |
No port access to the RGM.
| 15.3 | Roads |
The mine is linked to major commercial centres by a well-established network of primary asphalt roads and is accessible from the surrounding communities through secondary gravel roads. See Figure 3.1 and Figure 3.2.
| 15.4 | Camp |
Housing/camp mentioned in Section 15.7.
| 15.5 | Tailings |
Tailings pulp from the plant consists of run-of-mine and sands streams, along with CIP feed thickener overflows. This pulp undergoes dewatering in a tailings thickener to approximately 48–50% solids before being pumped via a system of three identical pumping banks to a disposal site (Dam 5) located 2 km away. CIP plant tailings are pumped overland to the tailings dam, with return water collected for reuse. Cyanide and soluble arsenic levels are monitored, with neutralization chemicals available for emergencies. Thickener overflow supplements water at the reclamation site, while Dam 5 penstock water is recycled for plant use.
| Project No PS213686 | WSP |
| Redwing Mine | January 2025 |
| S-K 1300 Technical Report Summary | Page 64 |
| Bulawayo Mining Company Limited |
| 15.6 | Potable water and wastewater |
RGM treats its own portable water and rations it to households, with availability from 06:00 to 16:00 and 17:00 to 06:00 for efficiency, not due to inadequacy. Housing units are provided with communal toilets in one-roomed sections of High-Density Villages (HDV) and individual toilets and bathrooms in other areas of HDV and Low-Density Villages (LDV).
Water for mining and processing is pumped from underground, while domestic water comes from Mountain Home Dam via a canal to the RGM water treatment plant. Water from the Mutare River is diverted to the treatment plant, settled in two 212 m3 tanks with aluminium sulphate, filtered through three sand filter tanks, chlorinated, and stored in a 212 m3 fresh water holding tank before distribution. Temporary treatment is undertaken in Tanks 1, 2, and 3 during maintenance.
Water is distributed through 6-inch and 4-inch lines to various areas including the RGM village, clinic, workshops, administration offices, compressors, and LDV houses. A separate 4-inch line serves Liverpool HDV before branching into a 3-inch line for Rezende houses. The processing capacity is 95 m3/hour.
| 15.7 | Accommodation and offices |
RGM acknowledges the importance of providing decent housing, in line with United Nations recognition of housing as a human need and right. Currently, the mine employs 263 workers and maintains a total of 1,143 housing units. These units vary in size and include single-roomed, 3-roomed, 4-roomed, and 6-roomed units in the High-Density Village, as well as 3-bedroom and 4-bedroom houses in the Low-Density Village. Additionally, the mine offers guest houses on-site and houses in the Low-Density area of Mutare to accommodate middle management employees.
| 15.8 | Non process infrastructure |
No data relevant to this section.
| 15.9 | Information and communications technology (ICT) systems |
Site inspection revealed that phone and internet services are available onsite.
| 15.10 | Other support facilities and utilities |
The project area is fenced and manned security provisions are in place.
First aid and ambulance are available on site.
| Project No PS213686 | WSP |
| Redwing Mine | January 2025 |
| S-K 1300 Technical Report Summary | Page 65 |
| Bulawayo Mining Company Limited |
| 16 | Market studies |
This section is included to inform an Initial Assessment for the estimation of Mineral Resources.
| 16.1 | Nature and material terms of agency relationships |
RGM is 100% owned by BMC Limited, with no agency relationships applicable.
| 16.2 | Results of relevant market studies |
No recent formal market studies have been completed. Gold and silver are sold according to open market prices as mandated by the Zimbabwean government. Analysis is based on historical pricing using a 3-year trailing average, combined with industry forecasts for exchange rate and inflation.
| 16.3 | Commodity price projections |
Pricing assumptions for gold and silver are based on historical spot pricing in an open market for precious metals, government mandated terms for payment, foreign exchange, and inflation recent history.
Trailing three-year average daily gold and silver prices that may be used as the basis for the gold price assumed for pay limit (cut-off grade) and revenue assumptions, as provided in Figure 16.1. At end December 2023, this averaged US$1 848/oz for gold and US$21/oz for silver. Silver in doré is not a material contributor to pay limit revenue estimation. As of May 2024, gold was expected to trade at US$2,410/oz. by the end of June 2024, according to Trading Economics global macro models and analysts’ expectations. Looking forward, it is estimated to trade at US$2,484/oz by the end of June 2025.
A gold price assumption of US$1 850/oz is reasonable and supportable for planning purposes, given spot pricing of US$2,330/oz (May 2024) and the 3-year trailing average price of US$1,848/oz (end December 2023, World Gold Council). A silver price assumption of US$21/oz is also reasonable given the spot price for silver is currently US$24.47/oz whilst the 3-year trailing average price is US$23.56/oz, indicating room to increase assumed pricing. Silver represents approximately 10-15% of doré and 0.2% of value and therefore is not material to revenue.
| Project No PS213686 | WSP |
| Redwing Mine | January 2025 |
| S-K 1300 Technical Report Summary | Page 66 |
| Bulawayo Mining Company Limited |
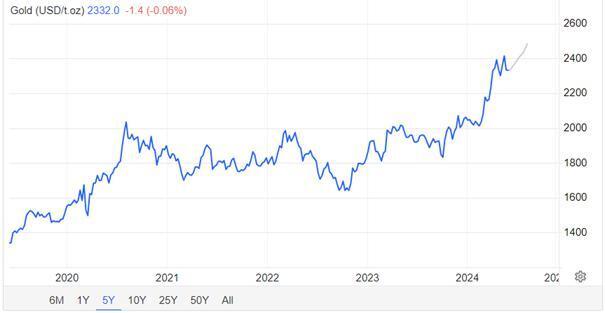
Figure 16.1 Historical (blue) gold spot price and forecast (grey) in US$/oz (Trading Economics 30 May 2024)
Gold proceeds are paid 75% in USD and 25% in local currency with effect from February 2023 (previously 60% USD and 40% in local currency). Sale of gold under these terms has been mandated by the Zimbabwean Government since the start of 2020. The impact of Government controls on gold and silver sales with respect to foreign currency retentions must be considered for the LOM plan. The local ZiG currency was only introduced 5 April 2024, is gold-backed and supported by strict monetary policy controls.
The local currency component of revenue has been employed for in country expenses, however, this value is subject to high inflation (57.5%, April 2024, Table 16.1) and exchange rate risk (Figure 16.2). Under these circumstances prompt expenditure of local currency on local expenses is warranted.
| Table 16.1 | Zimbabwean inflation rate and economic indicators (Trading Economics, 30 May 2024) |
| Indicator | Last | Previous | Highest | Lowest | Units | Date | ||||||||||||||
| Currency | 13.3 | 13.28 | 13.82 | 0 | May-24 | |||||||||||||||
| Stock Market | 102 | 100 | 2962052 | 1.13 | Points | May-24 | ||||||||||||||
| GDP Annual Growth Rate | 4.5 | 6.5 | 22.57 | -17.2 | percent | Dec-23 | ||||||||||||||
| Unemployment Rate | 9.1 | 9.3 | 10.8 | 4.4 | percent | Dec-23 | ||||||||||||||
| Inflation Rate | 57.5 | 55.3 | 786 | -7.5 | percent | Apr-24 | ||||||||||||||
| Interest Rate | 20 | 20 | 200 | 15 | percent | Apr-24 | ||||||||||||||
| Balance of Trade | -184 | -81.4 | 293 | -3958 | USD Million | Mar-24 | ||||||||||||||
| Current Account | 305 | 348 | 920 | -2750 | USD Million | Dec-22 | ||||||||||||||
| Current Account to GDP | 1 | 2.9 | 4.1 | -19.3 | percent of GDP | Dec-22 | ||||||||||||||
| Government Debt to GDP | 92.6 | 66.9 | 248 | 48.44 | percent of GDP | Dec-22 | ||||||||||||||
| Government Budget | -0.9 | -1.7 | 1.3 | -11.2 | percent of GDP | Dec-22 | ||||||||||||||
| Corporate Tax Rate | 24.72 | 24.72 | 30.9 | 24 | percent | Dec-23 | ||||||||||||||
| Personal Income Tax Rate | 41.2 | 41.2 | 51.5 | 36.05 | percent | Dec-23 | ||||||||||||||
| Project No PS213686 | WSP |
| Redwing Mine | January 2025 |
| S-K 1300 Technical Report Summary | Page 67 |
| Bulawayo Mining Company Limited |
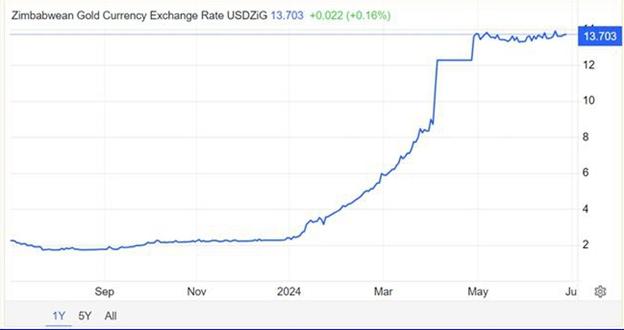
| Figure 16.2 | Zimbabwean gold currency exchange rate ZiG/USD (Trading Economics, 1 July 2024) |
Discounting current gold spot pricing of approximately US$2,350/oz to account for high inflation of 57.5% (April 2024) yields an estimated real value of US$1,936/oz while discounting for exchange rate movements in 2024 (USD:ZiG 2.34 to 13.304) yields an estimated real value of US$1,853/oz. The 12-month forecast price of US$2,484/oz yields discounted values of US$2,061/oz to US$1,971/oz respectively.
This evaluation indicates that a gold pricing assumption of US$1,850/oz for mine planning COG assessment purposes and cashflow modelling is reasonable, provided that inflation and related exchange rate movements for the local currency can be constrained to, or reduced from, current levels and local currency disposed of promptly to cover local costs.
| 16.4 | Mining and processing |
Future mining and processing at RGM are proposed to be conducted on an owner operator basis, consistent with previous practice.
Contract artisanal mining arrangements in place under the previous business administrator have been rescinded and are not material to future plans.
| 16.5 | Product transport and handling |
A gold and silver doré is produced for sale to the Zimbabwean government nominated agent, Fidelity. Gold generally averages 87% by weight. The product is transported by a private professional security company. Fawcetts Security, via armoured car to airport, then airlifted to Harare. Then transported by armoured car to Fidelity, a government owned refining facility via the Motapa Investment Fund (sovereign fund). Gold and silver is valued at spot pricing under the RTGS system on receipt of the doré with Fidelity stipulating allowances for refining charges (US$0.65/oz Au) and government royalty (5%).
| 16.6 | Hedging arrangements |
No hedging arrangements are currently in place.
| 16.7 | Forward sales contracts |
No forward sales contracts are currently in place.
| 16.8 | Contracts with affiliated parties |
No contracts with affiliated parties are currently in place with respect to gold sales.
| Project No PS213686 | WSP |
| Redwing Mine | January 2025 |
| S-K 1300 Technical Report Summary | Page 68 |
| Bulawayo Mining Company Limited |
| 17 | Environmental studies, permitting, and plans, negotiations, or agreements with local individuals or groups |
| 17.1 | Introduction |
The company ownership is per the company structure shared by the company. The Redwing Mining Lease covers approximately 1,254 ha of land.
| 17.2 | Project context |
RGM is located 20 km north-northeast of the city of Mutare in Manicaland Province, in the Mutare Mining District of Zimbabwe (grid reference – 658140). It is about 265 km southeast of the capital city, Harare. The location is at an altitude of about 1,200 amsl.
| 17.3 | Project permitting |
The following permits/licenses were provided to WSP for review:
| — | Environmental Impact Assessment Certificate Surface Mining and Milling – Expired 9 February 2023 |
| — | Environmental Impact Assessment (EIA) Certificate (Redwing Mine Surface Exploration) – Expired 1 August 2018. |
| — | EIA Certificate (Redwing Mine General Waste Landfill) – Expired 1 August 2018. |
| — | EIA Certificate (Redwing Mine Penhalonga EMP) – Expired 1 August 2018. |
| — | EIA Certificate (Redwing Mine General Waste Landfill) – Expired 29 January 2020. |
| — | EIA Certificate (Redwing Mine EMP) – Expired 29 January 2020. |
| — | EIA Certificate (Redwing Mine General Waste) – Expired 29 January 2020. |
| — | EIA Certificate (Surface Mine Exploration) – Expired 29 January 2020. |
| — | Licence for Storage of Explosives – Expired 30 June 2022 |
| — | Licence to Purchase, Acquire and Possess Explosives – Expired 30 June 2022. |
As at 31 December 2023, no certificates and licenses were current. It should be noted that the RGM was placed on C&M on 1 April 2019. All expired permits/licenses will need to be renewed before resumption of operations.
| Project No PS213686 | WSP |
| Redwing Mine | January 2025 |
| S-K 1300 Technical Report Summary | Page 69 |
| Bulawayo Mining Company Limited |
| 17.4 | Environmental and social impact assessment |
| 17.4.1 | Biodiversity and natural resources |
The dominant tree species in the area is Brachystegia spiciformis, a medium to large tree that covers extensive areas with marked dominance at the top. It thrives in a wide range of soils, even on slopes, although some bare patches suggest limitations in root depth. Julbernardia globiflora, a sub-dominant species, occupies the extreme west, which is drier and leeward. This region also hosts the lower-risk species, S. longipedunculata. While no formal survey was conducted, observed mammals in the Redwing vicinity and its environs include cattle, bucks, baboons, monkeys, hares, various small rodents, and snakes.
| 17.4.2 | Managing impacts on water |
The Water Act provides for the development and utilisation of water resources of Zimbabwe, grants of permits for the use of water, control of use of water when water is in short supply, protection of the environment and the prevention and control of water pollution and for the matters incidental to or connected with the foregoing
| 17.4.3 | Acid and metalliferous drainage (AMD) |
No acid and metalliferous drainage (AMD) data provided.
The use of mercury for local extraction of gravity won gold by artisanal miners may need to be considered.
| 17.4.4 | Erosion and protection of soils |
The properties of soils in RGM claims are largely influenced by the underlying parent material and intense weathering and leaching due to high rainfall. These conditions lead to deep soil profiles exceeding 3 to 4 metres, but erosion can cause shallower depths of less than one metre in some areas. The soils are highly acidic, have low cation exchange capacity, extremely low phosphate content, and high levels of free extractable iron due to intense weathering.
| 17.4.5 | Noise and vibration |
Generation of noise from compressed air will be controlled by ensuring planned maintenance schedule is being done and regular inspections will be undertaken. While noise will be regulated under 90dB in compliance with the Mines and Minerals Act Section 192.
| 17.4.6 | Air quality |
Underground Air pollution will be controlled by ensuring proper ventilation procedure is being followed by improving and monitoring ventilation system which included fans and other factors. Fumes will be minimised and contains as well as proper PPE will be provided.
Surface air emissions will be controlled by ensuring planned maintenance schedule is to be conducted to all vehicles.
| 17.4.7 | Local climate impacts |
No information regarding local climate impact was provided.
| 17.4.8 | Greenhouse gas emissions |
No Greenhouse gas emissions data provided.
| 17.4.9 | Resources use and non-mineral waste |
No resources use and non-mineral waste information.
| Project No PS213686 | WSP |
| Redwing Mine | January 2025 |
| S-K 1300 Technical Report Summary | Page 70 |
| Bulawayo Mining Company Limited |
| 17.5 | Project standards |
No project standards provided for review.
The QP assumes that similar quality assurance standards as adopted by BMC at How Mine will be implemented for future operation, including:
| — | Quality Management Systems: | ZWS ISO 9001-2015 |
| — | Environmental Management: | ZWS ISO 1401-2015 |
| — | Mining and Quarying: | IAF Code 2. |
| 17.6 | Stakeholder engagement |
| 17.6.1 | Stakeholder engagement plan |
No stakeholder engagement plan provided for review.
| 17.6.2 | Consultation |
No data relevant to this section.
| 17.7 | Cultural, economic, and social conditions |
| 17.7.1 | Cultural heritage |
The cultural landscape of RGM is intricate and diverse, reflecting its history dating back to the pre-independence era. Workers migrated from neighbouring countries for better opportunities, resulting in a blend of nationalities and ethnic groups such as Tonga, Manyika, Nyanja, Chewa, and Zezuru, each with its own cultural practices. Additionally, a variety of Christian denominations and African Independent Apostolic churches contribute to the cultural tapestry, including Roman Catholic, Methodist, Seventh Day Adventist, Johane Masowe, Johannes Marange, Zion, ZCC, and Pentecostal movements like UFI, ZAOGA, and AFM. These religious groups play a significant role in shaping the social and ethical dynamics of RGM.
| 17.7.2 | Local landscape |
No information regarding local landscape provided.
| 17.7.3 | Contributing to the national and local economy |
The mine operations are poised to contribute significantly to the national economy through various channels. Primarily, incomes earned by mine workers will stimulate domestic spending, ensuring continuous circulation of money within Zimbabwe. Additionally, mineral exports will generate capital through taxes. A comprehensive project appraisal indicates favourable returns for shareholders, management, employees, contractors, and the community. Profitability forecasts demonstrate the potential value addition, especially once the open pit mining operation commences ore production. Moreover, the mine has the capacity to address any environmental and social impacts effectively, underscoring its commitment to sustainability.
| 17.7.4 | Establishing a social management framework |
No information regarding this topic was provided.
| 17.7.5 | Impacts on land use and access |
Current LOM plan for the base case.
| Project No PS213686 | WSP |
| Redwing Mine | January 2025 |
| S-K 1300 Technical Report Summary | Page 71 |
| Bulawayo Mining Company Limited |
| 17.7.6 | Protecting community health and safety |
RGM has a local clinic which caters for the micro-health problems of the mine workers as well as the surrounding community. The clinic also runs a maternity section. To enhance quality provision of health, there is a medical doctor who visits the mine on a weekly basis and the clinic has permanent and highly qualified nurses and support personnel.
Medical surveillance and checkups are done regularly to determine the health of workers and ensure their wellbeing. Because of its proximity to the city of Mutare serious health issues can be hastily transferred to Mutare Provincial General Hospital. It is also vital to note that the mine is proactive in terms of disease prevention, for instance, its waste management policies prevent spread of diseases by vectors such as house flies and cockroaches.
| 17.7.7 | Protecting the workforce |
RGM will comply with relevant Zimbabwean legislation as a minimum.
| 17.7.8 | Commitment to local procurement and hiring |
RGM emphasises equal employment opportunities, refraining from discrimination based on religion, gender, or race. Prioritising local employment fosters mutually beneficial relationships between the mine and residents of Mutasa district and the high-density village. This strategy eliminates the need for transportation and accommodation logistics while ensuring employees enjoy the comfort of working near their families. Such proximity aids in addressing societal challenges like HIV and AIDS. As one of the primary employers in Manicaland Province, with a workforce of 261, RGM significantly contributes to both regional and national economies.
| 17.8 | Mine closure |
Mine closure plans, including remediation and reclamation plans have recently been updated by Enmin Consulting (Private) Limited (Enmin) in June 2024, including a detailed outline of closure requirements and costs.
The Redwing mine is currently on care and maintenance, with planned recommencement of underground mining and processing operations subject to the outcome of a planned prefeasibility study. Consequently, the mine closure plan and remediation works are on hold.
| 17.8.1 | Plan |
The mine closure plan envisages that at the conclusion of mining and processing, the land will be rehabilitated. A mine closure plan has been developed that contemplates site closure that will restore the land to its best future use. Closure planning is an iterative process, and ongoing technical studies as well as consultation with local stakeholders will feed into future refinements of the current closure concepts, prepared on a regular basis by RGM’s selected external consultant. The implementation and success of the plan will be monitored until the site achieves an environmentally and socially acceptable and sustainable state.
The conceptual mine closure plan indicates that closure will be required after completion of mining, although this timeline may vary as a function of conversion of additional Mineral Resources to Mineral Reserves as part of an annual update. Studies are ongoing to determine the potential for further extraction. On exhaustion of reserves, the underground mine will be closed and the ore handling and processing facilities will be decommissioned. This will entail dismantling, demolition and removal of equipment and buildings, reshaping and re contouring of land surfaces and rehabilitation of occupied areas. Dewatering of the underground mine will cease upon completion of mining and allowed to fill with water. As far as practical, the land occupied by the mine and its infrastructure will be returned to its former land use. The mine, plant area and waste emplacements and other works will be made safe for the community including the placement of barriers to discourage people from entering the mined out workings. A public education program on safety issues associated with the mine and any excavated areas will be conducted. A passive water management system will be implemented so that adequate protection for surrounding water resources can be provided without ongoing active management by RGM.
The closure phase will also require the management of social issues including retrenchment of the workforce and managing the implications of loss of local employment and business. To mitigate the social impacts commonly associated with mine closure, the Mine Closure Plan includes components related to social and community impacts. The plan will be developed in consultation with relevant authorities, the workforce and local communities.
| Project No PS213686 | WSP |
| Redwing Mine | January 2025 |
| S-K 1300 Technical Report Summary | Page 72 |
| Bulawayo Mining Company Limited |
| 17.8.2 | Cost |
Mine and social closure costs have recently been updated in June 2024 by Enmin. These costs comprise allowances for environmental rehabilitation, social closure and equipment salvage. The total cost is estimated at US$7.9 M assuming a Planned Closure scenario in accordance with the LOM plan, inclusive of a 12.6% contingency (Table 17.1), while this increases to US$11.3 M assuming an Unplanned closure scenario. Equipment Salvage cost has not been included in the closure liability as this will form part of the RGM cost. Social liability costs will only be borne during Unplanned Closure of the mine. For planned closure, the mine will have the opportunity to give sufficient notice to its employees on the closure of the mine, thus avoiding this additional cost. The Planned Closure cost estimate is adopted for cashflow model evaluation.
| Table 17.1 | RGM present closure obligation (Enmin 2024) |
| Cost (US$) | ||||||||||
| Item No. | Activity | Planned Closure | Unplanned Closure | |||||||
| 1 | Environmental Liability | 6,592,123 | 6,592,123 | |||||||
| 2 | Social Liability | 2,798,877 | ||||||||
| 3 | Equipment Salvage | 100,579 | ||||||||
| Sub-total | 6,592,123 | 9,491,578 | ||||||||
| Administrative and Supervision costs @6% | 395,527 | 569,495 | ||||||||
| 12.6% Contingency | 882,874 | 1,199,240 | ||||||||
| Total Mine Closure Costs | 7,870,524 | 11,260,313 | ||||||||
| 17.9 | Translating the ESIA into environmental and social management |
No data relevant to this section.
| Project No PS213686 | WSP |
| Redwing Mine | January 2025 |
| S-K 1300 Technical Report Summary | Page 73 |
| Bulawayo Mining Company Limited |
| 17.10 | QP’s opinion |
Whilst the mine is currently on C&M, environmental, miscellaneous operational and quality assurance permits, and certification should be renewed in preparation for recommencement of operations.
In the QP’s experience, mine closure costs can be a source of significant variability, generally on the downside. Bond liability requirements are generally a guide that reflects the government liability in the event of company default but do not always reflect the full cost of rehabilitation for the company. It is not unusual to find mine closure more than double the cost of legal compliance estimates.
| 18 | Capital and operating costs |
Not applicable since this TRS is an Initial Assessment and no Mineral Reserves have been estimated.
Any future estimation of Mineral Reserves and potential recommencement of operations will require the support of an additional drilling and resource definition campaign and at least a pre-feasibility to feasibility level of evaluation.
| 19 | Economic analysis |
Not applicable since this TRS is an Initial Assessment and no Mineral Reserves have been estimated.
Any future estimation of Mineral Reserves and potential recommencement of operations will require the support of an additional drilling and resource definition campaign and at least a pre-feasibility to feasibility level of evaluation.
| Project No PS213686 | WSP |
| Redwing Mine | January 2025 |
| S-K 1300 Technical Report Summary | Page 74 |
| Bulawayo Mining Company Limited |
| 20 | Adjacent properties |
Claims within the immediate and surrounding RGM area were consolidated in 2015 to form ML 34 (Section 3.2).
Table 20.1 presents a summary of claims in close proximity to ML 34. These claims are all located within the MGB. These claims cover historical and recent mine workings of various sizes that are of geological and economic interest (KDM 2018).
All claims are held by RMC Zimbabwe, with the exception of Toronto, Monarch, and Champion which have recently been sold by (BCM Limited).
| Table 20.1 | Summary of adjacent claims (Virimai 2022) |
| Claim | Approximate Area (m2) | Year Acquired | Geological Appraisal | ||||||
| RMC Zimbabwe Held Claims | |||||||||
| Hen 4 & 5 | 436,000 | 1974 | Narrow, EW trending quartz reef extending west of Iona section – a contiguous surface expression running along the ridge. No subsurface, drill-hole information available. | ||||||
| Arran | 1,455,000 | 1975 | Narrow quartz-pyrite reef in talcose schist. Highly variable grades. | ||||||
| Bulldog | 1,980,000 | 1978 | Narrow quartz-pyrite reef running sub parallel to the granite-greenstone contact. | ||||||
| Peplow 5 | 261,800 | 1980 | Narrow quartz reef trending EW. | ||||||
| Caliph | 138,000 | 1978 | Narrow quartz veins in sheared schist. Located NE of Redwing and E of Mutare R waterfall in heavily forested hills belonging to Border Timbers. | ||||||
| Nina | 162,000 | 1980 | Located NE of Redwing and E of Mutare R waterfall in heavily forested hills belonging to Border Timbers. | ||||||
| Other Claims | |||||||||
| Toronto | 5,165,000 | 1973 | Closed, flooded narrow quartz reef mine on the NW foot of the Cecil Kopje in the Toronto Residential suburb. Small old dump on site. | ||||||
| Monarch | 605,000 | 1987 | Numerous narrow quartz reefs trending EW & BIF on the Mozambican border – old workings. No recent exploration work records available. | ||||||
| Champion | 2,262,680 | 1987 | Acquired from Anglo-American, no meaningful results from underground drilling, mine closed, sealed & flooded. Reportedly a discontinuous reef with highly erratic values. Old, poorly evaluated dump on site. | ||||||
No data or other information from these historical adjacent properties were used in the preparation of this TRS.
| 21 | Other relevant data and information |
WSP is not aware of any other relevant data or information other than that disclosed in this TRS, that materially affects the information included in this TRS and that all material assumptions and parameters underpinning Mineral Resources and Mineral Reserves estimates continue to apply and have not materially changed.
| Project No PS213686 | WSP |
| Redwing Mine | January 2025 |
| S-K 1300 Technical Report Summary | Page 75 |
| Bulawayo Mining Company Limited |
| 22 | Interpretation and conclusions |
| 22.1 | Mineral Resources interpretations and conclusions |
Based on the information presented in this TRS, the QP’s key conclusions are as follows:
| — | The level of understanding in terms of regional geology, local geology and the nature and controls on mineralisation is high and provides a solid foundation for geological modelling, Mineral Resource estimation and mining geology. |
| — | Location of samples for surface and level-infill drilling are un-reliable due to errors with collar location and downhole survey. |
| — | Mineral Resource estimates are currently transitioning from paper-based estimates to digital estimates. |
| — | Mineral Resource estimates were completed on an unconstrained basis. |
| — | Estimates utilised all available samples i.e., channel, sludge, diamond drill core etc. |
| — | Dry BD of 2.7 t/m3 assigned for all domains. |
| — | Validation of the Mineral Resource estimates has not been reported. Standard industry practice is to conduct both visual and statistical validation of estimates and present the findings of this work in the Mineral Resource report to give the reader an appreciation of the robustness of the estimates. |
| — | Estimation within modelled mineralisation domains (constrained estimate) would likely result in an increase in contained metal. |
| — | Gold price increase have not been reflected in the reporting Au cut-off grade. A lower reporting cut-off grade may lead to an increase in contained metal. |
| — | The on-site assay laboratory is well-equipped and maintained and is considered suitable for the work that it is used for. |
| — | The drilling, sampling, assay and QAQC techniques used for both exploration and resource definition are consistent with standard industry practice and are considered appropriate for the purposes of geological modelling and Mineral Resource estimation. More detailed information on core recovery is however required. |
| — | Data and database management requires further work. |
| — | The COG used for Mineral Resource estimation seem reasonable on face value, however, the methodology used for determination of these values has not been reported and requires further explanation. |
| — | The method used for high-grade cutting is deemed appropriate and consistent with industry practice. |
| — | Validation of the Mineral Resource estimates has not been reported. Standard industry practice is to conduct both visual and statistical validation of estimates and present the findings of this work in the Mineral Resource report to give the reader an appreciation of the robustness of the estimates. |
| — | Mineral Resource estimates used a combination of paper-based estimation methods and digital estimation |
| — | The MRMR technical report developed by RMC Zimbabwe covers a number of areas in sufficient detail, however; a number of areas require more detail to give the reader a more thorough understanding of the work that has been conducted, the results of the work and any inherent risks to the Mineral Resource estimate. |
| — | Mining, processing, and market modifying factors, study assumptions and parameters are used to establish RPEE for the reporting of Mineral Resources. No significant risks exist that could impact the reliability and/or confidence of Mineral Resources estimates. |
| 22.2 | Mineral Reserves interpretations and conclusions |
Not applicable since this TRS is an Initial Assessment and no Mineral Reserves have been estimated.
| Project No PS213686 | WSP |
| Redwing Mine | January 2025 |
| S-K 1300 Technical Report Summary | Page 76 |
| Bulawayo Mining Company Limited |
| 23 | Recommendations |
Based on the results presented in this TRS, and consistent with BMC Limited’s long standing operating practices, ongoing technical work will be performed on the Property as part of studies to improve confidence, decrease risk, and enable the conversion of Mineral Resources to Mineral Reserves. The following items are recommended to sustain Mineral Resources and Mineral Reserves:
| 23.1 | Mineral Resources recommendations |
| — | Data and database management is an area that requires further work. The RGM would benefit from the introduction of a corporate database, with inbuilt validation routines and reporting functionality, to assist with what is a large quantity of geological information. |
| — | Review lithology, structural and mineralisation modelling practices. |
| — | Data analysis is conducted; however, it is recommended that for future Mineral Resource estimates, deposit wide Exploratory Data Analysis (EDA) is undertaken prior to estimation, to ensure data is fit for purpose for geological modelling and Mineral Resource estimation. |
| — | It is recommended that a succinct geological modelling and Mineral Resource estimation process flow is developed and followed for future Mineral Resource estimates. |
| — | It is recommended that Mineral Resource estimation is constrained to modelled mineralisation domain wireframes, using the Au Cut-off Grade (COG) chosen by the QP at the time of estimation and reporting. |
| — | All paper-based estimation techniques should be converted to computer-based (digital) as soon as possible. |
| — | A comparison between BD values determined from underground grab samples, and drill core should be undertaken to ensure that the mean values used for Mineral Resource estimation are appropriate, and that bias is not being incorporated into the Mineral Resource estimate. |
| — | Validation of the Mineral Resource estimates produced, or at least the documentation of validation work undertaken is an area that requires further work. Standard industry practice is to conduct both visual and statistical validation of estimates and present the findings of this work in the Mineral Resource report, to give the reader an appreciation of the robustness of the estimates. |
| — | RPEE have been considered, and the parameters used are considered reasonable. |
| — | Review Mineral Resource classification methodology and block assignment. |
| — | The Mineral Resource report developed covers a number of areas in sufficient detail; however, some areas require more detail to give the reader a more thorough understanding of the work that has been conducted, the results of the work and any inherent risks to the Mineral Resource estimate. |
| — | Mineral Resource reconciliation practices should be reviewed, and a system implemented that provides a measure of Mineral Resource estimate performance. Planned versus actual resource tonnages and grades should be developed and updated each time a Mineral Resource estimate is completed. It is recommended that mined development and production be reconciled monthly, and stope close-out reports be developed for each completed stope. |
| — | A Mineral Resource update, according to industry best practice, should be completed prior to re-establishment of commercial production. |
| — | An underground drilling program, collared from footwall drives, aimed at increasing confidence in the existing resource should be undertaken. |
| — | Subsequent to future MRM updates, a stope optimisation exercise is recommended. Stope optimisation allows for the rapid development of valid stope shapes according to specified criteria. |
| 23.2 | Mineral Reserves recommendations |
Not applicable since this TRS is an Initial Assessment and no Mineral Reserves have been estimated.
| Project No PS213686 | WSP |
| Redwing Mine | January 2025 |
| S-K 1300 Technical Report Summary | Page 77 |
| Bulawayo Mining Company Limited |
| 24 | References |
BMC (Bulawayo Mining Company (Private) Limited) (2023). How Mine, Mineral Reserves and Mineral Resources (MRMR) Estimates, 31 December 2023, Report on file at Metallon Management (Private) Limited, Harare, Zimbabwe.
Budavari S. July 1991. Some rock mechanics problems experienced at Rezende Mine. University of Witwaterrsrand. Prepared for Independence Mining (PVT) Limited.
Golder Associates Pty Ltd (Golder) 2021, Competent Person’s Report for the Redwing Mine, Zimbabwe, Prepared for Metallon Corporation Limited (UK), United Kingdom, Submitted August 2021, 75 pp.
KDM (The King’s Daughter Mining Company (Private) Limited) 2018, Mineral Resources and Mineral Reserves Estimates June 2018, Report on file at Metallon Management Services Ltd., Harare, Zimbabwe.
Meteoblue 2019, Climate Mazowe, Available at:
https://www.meteoblue.com/en/weather/historyclimate/climatemodelled/mazowe_zimbabwe_886384
MGZ (Metallon Gold Zimbabwe (Pvt) Ltd) 2019. Redwing Mine Environmental Management Plan, Report on file at RMC Zimbabwe, Penhalonga, Zimbabwe, 69 pp.
Prendergast, MD 2004, The Bulawayan Supergroup: a late Archaean passive margin-related large igneous province in the Zimbabwe craton, Journal of the Geological Society, vol.161, pp. 431-445.
Peacock, Simpson & Associates (PVT) Ltd 1995, Extractive Metallurgical Testwork on the Redwing Mine Mill Feed, Report No. 41/168/95, Submitted January 1995
RBZ (Reserve Bank of Zimbabwe) 2024, The 2024 Monetary Policy Statement at a Glance, 5 April 202413pp.
RMC Zimbabwe 2025, Memo: Redwing Mine Exploration Final Report, 31 pp.
SRK (SRK Consulting (UK) Ltd) 2012, A Competent Persons’ Report on the Mineral Assets of Metallon Gold Zimbabwe (Private) Limited, Republic of Zimbabwe, Prepared for Metallon Gold Zimbabwe (Private) Limited, Republic of Zimbabwe, Submitted November 2012, 79 pp.
SRKSA (SRK Consulting (South Africa) (Pty) Ltd) 2016, Rock Engineering Review for Redwing Mine, Prepared for Metallon Gold Zimbabwe (Private) Limited, Republic of Zimbabwe, Report Number 493792/1, Submitted February 2016, 62 pp.
Un-named. November 1991. Rock mechanics investigation: Old West and Redwing Mines. Report No. RW7.
Virimai Projects (Virimai) 2022, Redwing Gold Mine Restart High Level Assessment, Prepared for Redwing Mining Company (Private) Limited, Republic of Zimbabwe, Submitted November 2022, 72 pp.
Waterkings Environment Consultancy (Waterkings) 2012, Redwing Gold Mine – General Waste Landfill EIA Report, Submitted April 2012, 126 pp.
| Project No PS213686 | WSP |
| Redwing Mine | January 2025 |
| S-K 1300 Technical Report Summary | Page 78 |
| Bulawayo Mining Company Limited |
| 25 | Reliance on information provided by the Registrant |
Except for the purposes legislated under Canadian/USA securities law, any use of this report by any third party is at that party’s sole risk.
The QPs have wholly relied upon the Registrant for the following:
| — | Macroeconomic trends, data and assumptions, and interest rates (Sections 18 and 19). |
| — | Marketing information and plans within the control of the Registrant (Sections 16, 18, and 19). |
| — | Legal matters outside the expertise of the QPs, such as statutory and regulatory interpretations affecting the mine plan (Sections 3, 13, 15, and 17). |
| — | Environmental matters outside the expertise of the QPs (Section 17). |
| — | Accommodations the Registrant commits or plans to provide to local individuals or groups in connection with its mine plan (Section 17). |
| — | Governmental factors outside the expertise of the QPs (Section 17). |
The QPs consider it reasonable to rely upon the Registrant for the above information, based on the QPs’ past and ongoing interactions with the subject-matter experts in these areas employed or engaged by the Registrant, as well as the Registrant’s considerable experience mining at the Property. Further, the QPs have taken all appropriate steps, in their professional opinion, to ensure that the above information provided by the Registrant is accurate in all material respects and have no reason to believe that any material facts have been withheld or misstated.
| Project No PS213686 | WSP |
| Redwing Mine | January 2025 |
| S-K 1300 Technical Report Summary | Page 79 |
| Bulawayo Mining Company Limited |

| Project No PS213686 | WSP |
| Redwing Mine | January 2025 |
| S-K 1300 Technical Report Summary | Page 80 |
| Bulawayo Mining Company Limited |
This Report is provided by WSP Australia Pty Limited (WSP) for Bulawayo Mining Company Ltd (Client) in response to specific instructions from the Client and in accordance with WSP’s proposal dated 29 May 2024 and agreement with the Client dated 30 May 2024 (Agreement).
Permitted purpose
This Report is provided by WSP for the purpose described in the Agreement and no responsibility is accepted by WSP for the use of the Report in whole or in part, for any other purpose (Permitted Purpose).
Qualifications and assumptions
The services undertaken by WSP in preparing this Report were limited to those specifically detailed in the Report and are subject to the scope, qualifications, assumptions and limitations set out in the Report or otherwise communicated to the Client.
Except as otherwise stated in the Report and to the extent that statements, opinions, facts, conclusion and / or recommendations in the Report (Conclusions) are based in whole or in part on information provided by the Client and other parties identified in the report (Information), those Conclusions are based on assumptions by WSP of the reliability, adequacy, accuracy and completeness of the Information and have not been verified. WSP accepts no responsibility for the Information.
WSP has prepared the Report without regard to any special interest of any person other than the Client when undertaking the services described in the Agreement or in preparing the Report.
Use and reliance
This Report should be read in its entirety and must not be copied, distributed or referred to in part only. The Report must not be reproduced without the written approval of WSP. WSP will not be responsible for interpretations or conclusions drawn by the reader. This Report (or sections of the Report) should not be used as part of a specification for a project or for incorporation into any other document without the prior agreement of WSP.
WSP is not (and will not be) obliged to provide an update of this Report to include any event, circumstance, revised Information or any matter coming to WSP’s attention after the date of this Report. Data reported and Conclusions drawn are based solely on information made available to WSP at the time of preparing the Report. The passage of time; unexpected variations in ground conditions; manifestations of latent conditions; or the impact of future events (including (without limitation) changes in policy, legislation, guidelines, scientific knowledge; and changes in interpretation of policy by statutory authorities); may require further investigation or subsequent re-evaluation of the Conclusions.
This Report can only be relied upon for the Permitted Purpose and may not be relied upon for any other purpose. The Report does not purport to recommend or induce a decision to make (or not make) any purchase, disposal, investment, divestment, financial commitment or otherwise. It is the responsibility of the Client to accept (if the Client so chooses) any Conclusions contained within the Report and implement them in an appropriate, suitable and timely manner.
In the absence of express written consent of WSP, no responsibility is accepted by WSP for the use of the Report in whole or in part by any party other than the Client for any purpose whatsoever. Without the express written consent of WSP, any use which a third party makes of this Report or any reliance on (or decisions to be made) based on this Report is at the sole risk of those third parties without recourse to WSP. Third parties should make their own enquiries and obtain independent advice in relation to any matter dealt with or Conclusions expressed in the Report.
Disclaimer
This report contains the expressions of professional opinions of the Authors based on (i) information available at the time of preparation, (ii) data supplied by RMC [and others], and (iii) the assumptions, conditions, and qualifications set forth in this report. The quality of information, conclusions, and estimates contained herein are consistent with the stated levels of accuracy as well as the circumstances and constraints under which the mandate was performed.
| Project No PS213686 | WSP |
| Redwing Mine | January 2025 |
| S-K 1300 Technical Report Summary | Page 81 |
| Bulawayo Mining Company Limited |