Exhibit 96.1
Namib Minerals
How Mine
S-K 1300 Technical Report Summary
March 2026


How Mine
S-K 1300 Technical Report Summary
Namib Minerals
WSP Australia Pty Limited
Level 3, 51-55 Bolton St
Newcastle NSW 2300
PO Box 1162
Newcastle NSW 2300
Tel: +61 2 4929 8300
Fax: +61 2 4929 8382
wsp.com
| Effective Date: | 31 December 2025 |
| Signature Date | 31 March 2026 |
This document may contain confidential and legally privileged information, neither of which are intended to be waived, and must be used only for its intended purpose. Any unauthorised copying, dissemination or use in any form or by any means other than by the addressee, is strictly prohibited. If you have received this document in error or by any means other than as authorised addressee, please notify us immediately and we will arrange for its return to us.
PS229049-WSP-PER-MNG-TRS-001-How Mine TRS-
|
March 2026 |
Table of contents
| 1 | Executive summary | 1 |
| 1.1 | Property description and ownership | 1 |
| 1.2 | Geology and mineralisation | 1 |
| 1.3 | Exploration | 1 |
| 1.4 | Mineral Resources estimates | 2 |
| 1.5 | Mineral Reserves estimates | 3 |
| 1.6 | Capital and operating costs | 4 |
| 1.7 | Economic evaluation | 5 |
| 1.8 | Permitting requirements | 5 |
| 1.9 | QP’s conclusions and recommendations | 5 |
| 1.9.1 | Mineral Resources | 5 |
| 1.9.2 | Mineral Reserves | 6 |
| 2 | Introduction | 8 |
| 2.1 | Registrant information | 8 |
| 2.2 | Terms of reference and purpose | 9 |
| 2.3 | Sources of information | 13 |
| 2.4 | Personal inspection | 13 |
| 2.5 | Previously filed Technical Report Summaries | 13 |
| 2.6 | WSP declaration | 13 |
| 2.7 | Statement of Independence | 14 |
| 3 | Property description | 15 |
| 3.1 | Property location | 15 |
| 3.2 | Title and mineral rights | 15 |
| 3.3 | Encumbrances | 16 |
| 3.4 | Risks to access, title or right to perform work | 16 |
| 3.5 | Agreements and royalties | 17 |
| 4 | Accessibility, climate, local resources, infrastructure, and physiography | 17 |
| 4.1 | Topography, elevation, and vegetation | 17 |
| 4.2 | Access and proximity to population centres | 18 |
| 4.3 | Climate | 18 |
i
| 4.4 | Local resources and existing infrastructure | 19 |
| 4.4.1 | Power supply | 19 |
| 4.4.2 | Water supply | 19 |
| 4.4.3 | Personnel | 19 |
| 4.4.4 | Suppliers | 19 |
| 5 | History | 20 |
| 5.1 | Exploration and ownership history | 20 |
| 5.2 | Production history | 20 |
| 5.3 | Production reconciliation | 22 |
| 5.4 | Aggregate fiscal year production | 23 |
| 5.5 | Exploration and development by previous owners or operators | 23 |
| 6 | Geological setting, mineralisation, and deposit | 24 |
| 6.1 | Regional geology | 24 |
| 6.2 | Structural setting | 25 |
| 6.3 | Local and Property geology | 25 |
| 6.4 | Deposit type and geology | 27 |
| 6.5 | Mineralisation | 27 |
| 7 | Exploration | 29 |
| 7.1 | Diamond drilling | 29 |
| 7.1.1 | Exploration drilling 2025 | 30 |
| 7.1.2 | Exploration drilling 2012-2023 | 36 |
| 7.2 | Sludge drilling | 38 |
| 7.3 | QP’s opinion | 38 |
| 8 | Sample preparation, analyses, and security | 39 |
| 8.1 | Sampling techniques | 39 |
| 8.1.1 | Core sampling | 39 |
| 8.1.2 | Channel sampling | 39 |
| 8.1.3 | Sample security | 39 |
| 8.2 | Dry bulk density determination | 39 |
| 8.3 | Sample preparation, analysis, and procedures | 39 |
ii
| 8.4 | Quality Assurance Quality Control | 40 |
| 8.4.1 | Channel sampling | 40 |
| 8.4.2 | Core sampling | 40 |
| 8.4.3 | 2025 QAQC results | 40 |
| 8.5 | Bulk density | 42 |
| 8.6 | QP’s opinion on adequacy | 42 |
| 9 | Data verification | 43 |
| 9.1 | Mineral Resources data verification | 43 |
| 9.1.1 | Data verification conducted by BMC Zimbabwe | 43 |
| 9.1.2 | Data verification conducted by WSP | 43 |
| 9.1.3 | Limitations on Mineral Resources data verification | 43 |
| 9.2 | Mining and Mineral Reserves data verification | 43 |
| 9.3 | Geotechnical data verification | 44 |
| 9.4 | Hydrology and hydrogeology data verification | 44 |
| 9.4.1 | Hydrology | 46 |
| 9.4.2 | Hydrogeology | 46 |
| 9.5 | Processing and recovery methods data verification | 47 |
| 10 | Mineral processing and metallurgical | 48 |
| 10.1 | Nature and extent of mineral processing and metallurgical testing | 48 |
| 10.1.1 | Nature of Mineral Processing Operations | 48 |
| 10.1.2 | Extent of Metallurgical Testing | 48 |
| 10.2 | Spatial representativity of metallurgical sampling | 49 |
| 10.3 | Details of analytical or testing laboratories | 49 |
| 10.4 | Predictions and assumptions in mineral processing | 49 |
| 11 | Mineral Resource estimate | 50 |
| 11.1 | Resource database | 50 |
| 11.2 | Geological interpretation | 50 |
| 11.2.1 | Mineralisation Modelling | 51 |
| 11.3 | Data preparation | 56 |
| 11.3.1 | Hole Types | 56 |
| 11.3.2 | Collar Review | 58 |
| 11.3.3 | Downhole Survey Review | 59 |
| 11.3.4 | Assay Review | 60 |
| 11.3.5 | Compositing | 60 |
| 11.3.6 | Comparison Statistics | 61 |
iii
| 11.4 | Exploratory data analysis | 62 |
| 11.4.1 | High-grade treatment | 62 |
| 11.5 | Variography | 63 |
| 11.6 | Dry bulk density | 64 |
| 11.7 | Block models | 64 |
| 11.8 | Grade estimation | 65 |
| 11.9 | Model validation | 65 |
| 11.9.1 | Visual Validation | 66 |
| 11.9.2 | Global Comparisons | 66 |
| 11.9.3 | Swath Plots | 67 |
| 11.9.4 | Tailings Dam Block Model Review | 69 |
| 11.9.5 | Tailings Dam Block Model Validation | 70 |
| 11.10 | Mineral Resources classification | 75 |
| 11.11 | Cut-off grade, price, and justification | 77 |
| 11.12 | Reasonable prospects for eventual economic extraction | 78 |
| 11.13 | Mineral Resources statement | 80 |
| 11.14 | Uncertainty in the estimates of Inferred, Indicated, and Measured Mineral Resources | 81 |
| 11.15 | QP’s opinion on factors likely to influence the prospect of economic extraction | 82 |
| 12 | Mineral Reserve Estimate | 83 |
| 12.1 | Key inputs, assumptions, parameters, and methods | 83 |
| 12.2 | Cut-off grade estimate | 84 |
| 12.3 | Metallurgical and processing recoveries | 85 |
| 12.4 | Modifying factors | 85 |
| 12.5 | Mineral Reserve classification | 86 |
| 12.5.1 | Proved Mineral Reserves | 86 |
| 12.5.2 | Probable Mineral Reserves | 87 |
| 12.6 | Mineral Reserve estimate | 87 |
| 12.6.1 | Mineral Reserve statement | 87 |
| 12.6.2 | Life of mine strategic plan | 88 |
| 12.7 | QP’s opinion on risk factors that may materially affect the Mineral Reserve estimates | 89 |
iv
| 13 | Mining methods | 90 |
| 13.1 | Introduction | 90 |
| 13.2 | Parameters relevant to the design and schedule | 92 |
| 13.2.1 | Geotechnical | 92 |
| 13.2.2 | Hydrogeological | 93 |
| 13.3 | Production parameters | 93 |
| 13.3.1 | Production rates | 93 |
| 13.3.2 | Expected mine life | 93 |
| 13.3.3 | Mining model | 94 |
| 13.4 | Mining fleet, machinery, and personnel requirements | 98 |
| 13.4.1 | Mining fleet and machinery | 98 |
| 13.4.2 | Personnel | 99 |
| 13.5 | Scheduling process | 99 |
| 13.6 | Mining schedule | 99 |
| 14 | Processing and recovery methods | 103 |
| 14.1 | Processing methodologies and flowsheets | 103 |
| 14.2 | Processing plant throughput and characteristics | 103 |
| 14.2.1 | Run of Mine crushing plant | 103 |
| 14.2.2 | Grinding and gravity concentration plant | 104 |
| 14.2.3 | Run of Mine CIP plant | 104 |
| 14.2.4 | Elution plant | 104 |
| 14.2.5 | Clean-up and smelting | 104 |
| 14.3 | Product sampling | 104 |
| 14.3.1 | Mill feed | 104 |
| 14.3.2 | Feed tonnage | 105 |
| 14.3.3 | Residues | 105 |
| 14.4 | Metallurgical recovery | 106 |
| 14.5 | Product stockyard | 106 |
| 14.6 | Energy and water process materials requirements | 107 |
| 14.6.1 | Mine power plant | 107 |
| 14.6.2 | Mine water management system | 107 |
| 14.7 | QP’s opinion | 107 |
| 15 | Infrastructure | 108 |
| 15.1 | Rail access | 108 |
| 15.2 | Port access | 109 |
| 15.3 | Roads | 109 |
| 15.4 | Camp | 109 |
v
| 15.5 | Tailings | 109 |
| 15.6 | Potable water and wastewater | 109 |
| 15.7 | Accommodation and offices | 110 |
| 15.8 | Non-process infrastructure | 110 |
| 15.9 | Information and communications technology systems | 110 |
| 15.10 | Other support facilities and utilities | 110 |
| 16 | Market studies | 110 |
| 16.1 | Nature and material terms of agency relationships | 110 |
| 16.2 | Results of relevant market studies | 111 |
| 16.3 | Commodity price projections | 111 |
| 16.4 | Mining and processing | 113 |
| 16.5 | Product transport and handling | 113 |
| 16.6 | Hedging arrangements | 113 |
| 16.7 | Forward sales contracts | 113 |
| 16.8 | Contracts with affiliated parties | 113 |
| 17 | Environmental studies, permitting and plans, negotiations, or agreements with local individuals or groups | 114 |
| 17.1 | Introduction | 114 |
| 17.2 | Environmental management and corporate responsibility | 114 |
| 17.3 | Property context | 115 |
| 17.4 | Property permitting | 116 |
| 17.5 | Environmental and Social Impact Assessment | 117 |
| 17.5.1 | Biodiversity and natural resources | 117 |
| 17.5.2 | Managing impacts on water | 117 |
| 17.5.3 | Acid and metalliferous drainage | 117 |
| 17.5.4 | Erosion and protection of soils | 117 |
| 17.5.5 | Noise and vibration | 117 |
| 17.5.6 | Air quality | 118 |
| 17.5.7 | Local climate impacts | 118 |
| 17.5.8 | Greenhouse gas emissions | 118 |
| 17.5.9 | Resources use and non-mineral waste | 118 |
| 17.5.10 | Regulatory accreditation | 118 |
vi
| 17.6 | Property standards | 119 |
| 17.7 | Waste and tailings disposal plans | 119 |
| 17.7.1 | Waste disposal | 119 |
| 17.7.2 | Tailings disposal | 119 |
| 17.8 | Site monitoring | 121 |
| 17.9 | Water management | 122 |
| 17.10 | Stakeholder engagement | 122 |
| 17.10.1 | Stakeholder engagement plan | 122 |
| 17.10.2 | Consultation | 122 |
| 17.11 | Cultural, economic, and social conditions | 122 |
| 17.11.1 | Cultural heritage | 122 |
| 17.11.2 | Contributing to the national and local economy | 123 |
| 17.11.3 | Establishing a social management framework | 123 |
| 17.11.4 | Stakeholder engagement | 123 |
| 17.11.5 | Impacts on land use and access | 123 |
| 17.11.6 | Protecting community health and safety | 123 |
| 17.11.7 | Protecting the workforce | 123 |
| 17.11.8 | Commitment to local procurement and hiring | 123 |
| 17.12 | Mine closure | 125 |
| 17.13 | Translating the ESIA into environmental and social management | 126 |
| 17.14 | QP’s opinion | 126 |
| 17.14.1 | Legal | 126 |
| 17.14.2 | Social and environment | 126 |
| 18 | Capital and operating costs | 126 |
| 18.1 | Capital costs | 127 |
| 18.1.1 | Growth and sustaining capital | 127 |
| 18.1.2 | Mine closure costs | 128 |
| 18.2 | Operating costs | 128 |
| 18.3 | Contingency | 129 |
| 19 | Economic analysis | 130 |
| 19.1 | Summary | 130 |
| 19.2 | Methodology | 130 |
| 19.2.1 | Modelling approach | 130 |
| 19.2.2 | Sources of assumptions | 131 |
| 19.2.3 | Financial | 131 |
| 19.2.4 | Pricing and revenue | 131 |
| 19.2.5 | Taxes and royalties | 132 |
vii
| 19.0 | Capital costs | 132 |
| 19.1 | Operating costs | 132 |
| 19.2 | Cash flow | 132 |
| 19.3 | Economic evaluation and sensitivity analysis | 134 |
| 20 | Adjacent properties | 135 |
| 21 | Other relevant data and information | 135 |
| 22 | Interpretation and conclusions | 135 |
| 22.1 | Mineral Resources interpretations and conclusions | 135 |
| 22.2 | Mineral Reserves interpretations and conclusions | 136 |
| 23 | Recommendations | 138 |
| 23.1 | Mineral Resources recommendations | 138 |
| 23.2 | Mineral Reserves recommendations | 138 |
| 24 | References | 139 |
| 25 | Reliance on information provided by the Registrant | 141 |
| 26 | Date and Signature Page | 141 |
List of tables
| Table 1-1 | HGM underground Measured and Indicated Mineral Resources estimate as at 31 December 2025, exclusive of Mineral Reserves. | 2 |
| Table 1-2 | HGM underground Inferred Mineral Resource estimate as at 31 December 2025 | 3 |
| Table 1-3 | HGM sands (tailings) Inferred Mineral Resource estimate as at 31 December 2025 | 3 |
| Table 1.4 | presents the HGM Mineral Reserves estimate as at 31 December 2025.Table 1-4 Mineral Reserves estimate as at 31 December 2025 | 4 |
| Table 2-1 | List of acronyms and abbreviations used in this TRS | 9 |
| Table 4-1 | Mean temperatures in Bulawayo (World Meteorological Organization) | 18 |
| Table 5-1 | MRMR summary comparison end December 2024 to end December 2025 | 22 |
| Table 5-2 | Aggregate calendar year production ending December 2021–2025 | 23 |
viii
| Table 8-1 | Summary of density samples taken between 2007 and 2016. | 42 |
| Table 11-1 | Summary of drill types included in the How database and used in the Mineral resource estimate | 56 |
| Table 11-2 | Survey intervals ignored due to spurious azimuth readings | 59 |
| Table 11-3 | Comparison of raw and composited sample statistics (Au g/t) | 61 |
| Table 11-4 | Top cut statistics per domain for Au | 62 |
| Table 11-5 | Summary of variogram parameters by domain | 63 |
| Table 11-6 | How Block Model Parameters | 64 |
| Table 11-7 | Model Variables | 64 |
| Table 11-8 | How Estimation Parameters - Au | 65 |
| Table 11-9 | Global grade validation for all domains | 66 |
| Table 11-10 | Comparison between the input samples and the model estimated blocks within each dam wireframe | 74 |
| Table 11-11 | BECOG Calculation | 77 |
| Table 11-12 | MCOG Calculation | 77 |
| Table 11-13 | December 2025 Mineral Resource conversion parameters | 78 |
| Table 11-14 | Stope optimisation parameters for How Mineral Resource | 79 |
| Table 11-15 | How Gold Project, Mineral Resource Estimate, exclusive of Mineral Reserves – 31 December 2025 | 80 |
| Table 11-16 | HGM underground Measured and Indicated Mineral Resources estimate as at 31 December 2025 | 80 |
| Table 11-17 | HGM underground Inferred Mineral Resources estimate as at 31 December 2023 | 81 |
| Table 11-18 | HGM sands (tailings) Inferred Mineral Resources estimate as at 31 December 2025 | 81 |
| Table 12-1 | Estimation parameters | 83 |
| Table 12-2 | BECOG Calculation | 84 |
| Table 12-3 | MCOG Calculation | 84 |
| Table 12-4 | Additional key parameters | 85 |
| Table 12-5 | Mineral Reserves estimate as at 31 December 2025 | 88 |
| Table 12-6 | Inferred Mineral Resources included in the life of mine plan as at 31 December 2025 | 88 |
| Table 13-1 | HGM shaft collars and depths | 92 |
| Table 13-2 | MSO parameters | 94 |
| Table 13-3 | CY2025 MRE (Proven and Probable only) | 100 |
| Table 13-4 | HGM mine strategic life of mine plan (Proven, Probable and Inferred) | 102 |
| Table 14-1 | Mill feed sampling specifications | 105 |
| Table 14-2 | Feed tonnage sampling specifications | 105 |
| Table 14-3 | Residues sampling specifications | 105 |
| Table 14-4 | Historical metallurgical recovery data | 106 |
ix
| Table 16-1 | Zimbabwean inflation rate and economic indicators (Trading Economics, 13 February 2026) | 112 |
| Table 18-1 | Mineral Reserves summary capital expenditure for FY 2026-2029 | 128 |
| Table 18-2 | HGM present closure obligation (Enmin 2025) | 128 |
| Table 18-3 | HGM Mineral Reserves LOM OPEX | 129 |
| Table 19-1 | HGM Mineral Reserve cashflow modelling assumptions | 131 |
| Table 19-2 | HGM cashflow analysis prior to depreciation, financing, and tax – Mineral Reserves (Proved and Probable only) | 133 |
List of figures
| Figure 2.1 | Namib Minerals corporate | 8 |
| Figure 3.1 | Property location map | 15 |
| Figure 3.2 | HGM ML 28 boundary | 16 |
| Figure 4.1 | Climate statistics for Bulawayo, Zimbabwe (Meteoblue 2026) | 19 |
| Figure 5.1 | HGM total gold production 1941–2025 | 21 |
| Figure 6.1 | Regional geology of Zimbabwe showing location of Greenstone Belts (Prendergast 2004) | 24 |
| Figure 6.2 | Regional geology of the HGM area (BMC Limited) | 25 |
| Figure 6.3 | Local geology of the HGM area (BMC 2023b) | 26 |
| Figure 6.4 | Simplified stratigraphic columns for the Umzingwane, Avalon, and Kensington formations (BMC Limited) | 26 |
| Figure 6.5 | Typical cross-section of ore zones within tuff (Edelrod 2024) | 28 |
| Figure 7.1 | Long Section view, looking East of all HGM diamond drill hole collars, traces and existing mine development | 30 |
| Figure 7.2 | Plan view of 2025 drill hole collars (left) and traces (right), with existing mine development shown in grey | 30 |
| Figure 7.3 | 13L (2025) drilling plan | 31 |
| Figure 7.4 | 17L (2025) drilling plan - 17L20m (left) and 17Lev (right) | 32 |
| Figure 7.5 | 18L (2025) drilling plan | 33 |
| Figure 7.6 | 30L (2025) drilling plan. Plan view (left) and section view (right) | 34 |
| Figure 7.7 | 32L (2025) drilling plan - 32L20m (top left), 32L10m (top right), and 32Lev (bottom) | 35 |
| Figure 7.8 | 30L (2021–2023) drilling plan | 36 |
| Figure 7.9 | 24L (2015–2016) drilling plan | 37 |
| Figure 7.10 | 26L (2012–2013) drilling plan | 37 |
| Figure 8.1 | 2025 Standard performance – high-grade standard | 41 |
| Figure 8.2 | 2025 Standard performance – low-grade standard | 41 |
| Figure 8.3 | January 2026 Inter-laboratory Check Sample Results | 42 |
| Figure 9.1 | Catchment boundaries of Zimbabwe (BMC Limited) | 45 |
| Figure 9.2 | Sub-catchment boundaries of Mzingwane, Zimbabwe (BMC Limited) | 46 |
x
| Figure 11.1 | Long section view looking East showing existing development in grey and Namib’s planned MRE wireframes in orange. | 50 |
| Figure 11.2 | (left) log probability plot of Au assays at How, (right) log probability plot of waste interval lengths at How | 51 |
| Figure 11.3 | Plan view +/- 13m at 155mRL showing the intervals selected in the low-grade wireframe in pink with external segments in blue. The resulting low-grade wireframes outline is in orange. | 52 |
| Figure 11.4 | North facing section view +/- 13m at 5725mN | 52 |
| Figure 11.5 | (Left) Log probability plot of Au assays within the low-grade wireframe at How. (Right) Log probability plot of waste interval lengths within the low-grade wireframe at How. | 53 |
| Figure 11.6 | Plan view at 285mRL showing the medium grade domain (red) inside the low-grade domain (orange). Structural trend shown in blue. | 54 |
| Figure 11.7 | (Left) Histogram of Au grades within the medium grade domain at How. (Right) log probability plot of Au grades within the medium grade domain at How. | 55 |
| Figure 11.8 | Plan view at 420mRL showing the Low-grade wireframe outline in orange with the Medium-grade wireframe in red and the internal High-grade wireframes in purple. | 55 |
| Figure 11.9 | Long section view showing collar locations of different drill types | 56 |
| Figure 11.10 | Plan view at 300mRL showing channel samples in the development drive (light blue collars) with diamond drilling (collars in dark blue) | 57 |
| Figure 11.11 | Long section looking East showing distance of the collar points to the development drive. | 58 |
| Figure 11.12 | Long section view looking East showing dog-leg severity in diamond drill holes | 59 |
| Figure 11.13 | Histogram of raw assay length within mineralised domains | 61 |
| Figure 11.14 | Correlograms for low-grade domain | 63 |
| Figure 11.15 | Correlograms for medium-grade domain | 63 |
| Figure 11.16 | Correlograms for high-grade domain | 63 |
| Figure 11.17 | Cross section at -5625mN +/- 15m showing the block model and composites both coloured by Au | 66 |
| Figure 11.18 | Swath Plot for HG mineralisation (Top left – X, Top right – Y, Bottom – Z) | 67 |
| Figure 11.19 | Swath Plot for MG mineralisation (Top left – X, Top right – Y, Bottom – Z) | 68 |
| Figure 11.20 | Swath Plot for LG mineralisation (Top left – X, Top right – Y, Bottom – Z) | 69 |
| Figure 11.21 | Plan view of the block model at Dam 3, showing estimated grades and composited data at the 1261 m levels (±1 m). Topography is shown in brown. | 70 |
xi
| Figure 11.22 | NE–SW cross-section (±5 m) looking northwest at Dam 3, comparing Au composite grades with the block model Au_IDW grades. Topography is shown in brown. | 71 |
| Figure 11.23 | NE–SW cross-section (±5 m) looking northwest at Dam 3, comparing Au composite grades with the block model Au_IDW grades. Topography is shown in brown. | 71 |
| Figure 11.24 | NW–SE long-section (±5 m) looking northeast at Dam 3, comparing Au composite grades with the block model Au_IDW grades. Topography is shown in brown. | 72 |
| Figure 11.25 | Plan view of the block model at Dam 4, showing estimated grades and composited data at the 1,271 m levels (±1 m). Topography is shown in brown. | 72 |
| Figure 11.26 | NE–SW cross-section (±5 m) looking northwest at Dam 4, comparing Au composite grades with the block model Au_IDW grades. Topography is shown in brown. | 73 |
| Figure 11.27 | NE–SW cross-section (±5 m) looking northwest at Dam 4, comparing Au composite grades with the block model Au_IDW grades. Topography is shown in brown. | 73 |
| Figure 11.28 | NW–SE long-section (±5 m) looking northeast at Dam 4, comparing Au composite grades with the block model Au_IDW grades. Topography is shown in brown. | 73 |
| Figure 11.29 | Swath Plot for Dam 3 (Top left – X, Top right – Y, Bottom – Z) | 74 |
| Figure 11.30 | Swath Plot for Dam 4 (Top left – X, Top right – Y, Bottom – Z) | 75 |
| Figure 11.31 | Long section view looking East showing Measured (green) and Indicated (pink) blocks and diamond drill hole traces in white. Material outside of these areas but within the orange estimation domain are classified Inferred. | 76 |
| Figure 11.32 | Long section view looking East showing RPEEE stopes in blue with existing stopped out areas in white | 79 |
| Figure 13.1 | Figure showing general mining method (Mining – blasthole stoping, ore extraction, drilling | Britannica) | 90 |
| Figure 13.2 | HGM underground mining infrastructure end 2025 | 91 |
| Figure 13.3 | Updated CY2025 MRE MSO inventory looking east | 95 |
| Figure 13.4 | Previous CY2024 MRE stoping inventory looking east | 96 |
| Figure 13.5 | Updated lateral and vertical development looking east | 97 |
| Figure 13.6 | CY2025 MRE updated mine design looking east | 98 |
| Figure 13.7 | DTS mining schedule | 100 |
| Figure 13.8 | Total ore tonnes and average gold grade (g/t) - Proven and Probable only | 101 |
| Figure 14.1 | HGM processing flowsheet (KDM 2018) | 103 |
| Figure 15.1 | NRZ rail network schematic (NRZ 2024c) | 108 |
| Figure 16.1 | Historical (blue) gold spot price US$/oz (World Gold Council Feb 26) | 111 |
| Figure 16.2 | Zimbabwean gold currency exchange rate ZiG/USD (Trading Economics, 24 February 2026) | 112 |
| Figure 17.1 | BMC Zimbabwe ML and other claims | 116 |
| Figure 17.2 | Site layout for TSF Dam 5 and proposed Dam 6 | 119 |
| Figure 17.3 | TSF Dam 5 location from satellite imagery | 120 |
| Figure 17.4 | Tailings storage facility Dam 5 cross section and plan schematic of construction, December 2023 | 121 |
| Figure 19.1 | Mineral Reserves only project NPV and sensitivity analysis | 132 |
List of appendices
Appendix A Limitations statement
xii
| 1 | Executive summary |
| 1.1 | Property description and ownership |
The How Gold Mine (HGM) [or the Property] is located in the Matabeleland South Province, Zimbabwe, approximately 30 kilometres (km) southeast of the city of Bulawayo (latitude 20°18’S and longitude 28°46‘E), in the Bulawayo Mining District of Zimbabwe.
The HGM is situated within the Mining Lease (ML) 28 tenement, which has a surface area of 2,408 hectares (ha) [Figure 3.2].
HGM is wholly owned and operated through Namib Minerals, which acquired Bulawayo Mining Company Limited (BMC)—the long-standing operator of the mine—in 2024 from Metallon Corporation. Following this transaction, Namib Minerals holds 100% indirect ownership of HGM, while BMC continues to function as the on-site operator under the new corporate structure.
The Property is accessible via a sealed road from Bulawayo, approximately 30 kilometres (km) west-northwest, which is in fair condition. Access to the mine site and ore is authorised by the applicable mining legislation, and BMC Zimbabwe’s title and mining rights. Mining exploration and exploitation works conducted, or to be conducted on site are authorised in accordance with the applicable legislation, and BMC Zimbabwe’s title and mining rights.
| 1.2 | Geology and mineralisation |
The HGM is located in the Umzingwane Formation of the Bulawayo Greenstone Belt (BGB). The lithological units characteristic of the Umzingwane Formation includes clastic metasediments, fine-grained tuffaceous rocks, banded shales and siltstones, ferruginous cherts or Banded Iron Formation (BIF), and rhyodacites and andesitic lavas. This assemblage has been subjected to metamorphism of lower greenschist facies.
The local geology around HGM consists of a sequence of talc-chlorite schist, laminated black shale, silicate facies BIF, tuffaceous units, and siltstone from southwest to northeast with the occurrence of felsic porphyry intrusions and mafic dykes.
Mineralisation at the HGM is thought to have been formed by hydrothermal solutions migrating along structurally controlled channels, predominantly caused by an extensional duplex, with its long axis parallel to the direction of extension.
The deposit shows significant hydrothermal alteration, commonly with associated sulphide mineralisation. Strong carbonation, silicification, and in extreme cases propylitisation occur together with sulphides. Pyrite is the dominant sulphide, with significantly less chalcopyrite and occasional pyrrhotite present, becoming more abundant at depth. Chalcocite and arsenopyrite have also been reported. Ore microscopy has shown that gold is associated with a late generation of pyrite and chalcocite.
Mineralisation generally strikes to the north, and dips steeply at approximately 80 degrees (°) to the west, with a steep northerly plunge.
| 1.3 | Exploration |
Exploration is based on detailed geological mapping that established the following sequence from southwest to northeast: talc-chlorite schist, laminated black shale, silicate facies BIF, tuffaceous units, and siltstone. The occurrence of felsic porphyry intrusions and mafic dykes was observed in historical quarries and underground at HGM.
Channel sampling, diamond drilling, and sludge drilling samples were used for the purposes of geological modelling and Mineral Resource estimation.
| Project No PS229049 | WSP |
| How Mine | March 2026 |
| S-K 1300 Technical Report Summary | Page 1 |
| Namib Minerals |
| 1.4 | Mineral Resources estimates |
This report is prepared as a Technical Report Summary (TRS) for the Property, in accordance with the United States Securities and Exchange Commission’s (SEC) Modernized Property Disclosure Requirements for Mining Registrants as described in Subpart 229.1300 of Regulation S K, Disclosure by Registrants Engaged in Mining Operations (S-K 1300) and Item 601(b)(96).
The Mineral Resources estimate has been defined, classified and reported according to the guiding principles and minimum requirements as set out in S-K 1300 requirements for the reporting of Mineral Resources.
The relevant Qualified Person (QP) is satisfied that there has been sufficient orebody knowledge work completed to support Reasonable Prospects for Economic Extraction (RPEE) at the Property from a Mineral Resource perspective.
In the QP’s opinion the assumptions for definition of the resource base are current.
For the purpose of demonstrating the capacity to exploit the resource and define Mineral Resources as required under S-K 1300, the QP utilised Datamine’s Mineable Shape Optimiser (MSO) software to define mineable envelopes (stopes) based on the current mining method stope definition parameters above the calculated marginal cut-off, as per accepted industry practice. The parameters used in the MSO process are detailed in Table 13-2 below. The marginal cut-off was calculated on updated macro-economic inputs and current costs data and is detailed in Section 11.11 of this report. A process recovery of 89%, detailed in Section 14.4, for gold was applied for cashflow modelling consistent with recent historical averages and fixed tail estimates. Further assumptions are provided under Section 11.11.
Table 1.1 presents the underground Measured and Indicated Mineral Resources (exclusive of Mineral Reserves) reported as at 31 December 2025.
Mineral Resources are reported on an in-situ basis, exclusive of Mineral Reserves, inside Mineable Stope Optimiser shapes generated at a cut-off grade of 0.6 g/t Au and is inclusive of material below 0.6 g./t Au within these shapes.
Table 1-1 HGM underground Measured and Indicated Mineral Resources estimate as at 31 December 2025, exclusive of Mineral Reserves.
| Category | Tonnage (Mt) | Au Grade (g/t) | Au Metal (koz) |
| Underground | |||
| Measured Resource | 13.7 | 1.32 | 583 |
| Indicated Resource | 10.2 | 1.41 | 463 |
| Grand Total | 23.9 | 1.36 | 1,046 |
Notes: Mt = Million tonnes; Au Grade g/t = gold grams per tonne; koz = thousand ounces.
Table 1.2 presents the underground Inferred Mineral Resource reported as at 31 December 2025. The Mineral Resource is reported within Mineable Stope Optimiser shapes generated at a cut-off grade of 0.6 g/t Au and is inclusive of material below 0.6 g./t Au within these shapes.
| Project No PS229049 | WSP |
| How Mine | March 2026 |
| S-K 1300 Technical Report Summary | Page 2 |
| Namib Minerals |
Table 1-2 HGM underground Inferred Mineral Resource estimate as at 31 December 2025
| Category | Tonnage (Mt) | Au Grade (g/t) | Au Metal (koz) |
| Underground | |||
| Inferred Resource | 31.0 | 2.18 | 2,176 |
| Grand Total | 31.0 | 2.18 | 2,176 |
Notes: Mt = Million tonnes; Au Grade g/t = gold grams per tonne; koz = thousand ounces.
Table 1.3 presents the sands (tailings) Inferred Mineral Resource reported as at 31 December 2025.
Table 1-3 HGM sands (tailings) Inferred Mineral Resource estimate as at 31 December 2025
| Category | Tonnage (Mt) | Au Grade (g/t) | Au Metal (koz) |
| Sands (Tailings) | |||
| Inferred Resource | 12.0 | 0.59 | 220 |
| Grand Total | 12.0 | 0.59 | 220 |
Notes: Mt = Million tonnes; Au Grade g/t = gold grams per tonne; koz = thousand ounces.
It should be noted that the underground and surface Mineral Resource estimate for the Property is reported exclusive of Mineral Reserves.
The Mineral Resources presented in this Section are not Mineral Reserves, and do not reflect demonstrated economic viability. The reported Inferred Mineral Resources are considered too speculative geologically to have the economic considerations applied to them that would enable them to be categorised as Mineral Reserves. There is no certainty that all or any part of this Mineral Resource will be converted into Mineral Reserve.
All figures are rounded to reflect the relative accuracy of the estimates and totals may not add correctly.
Based on the geological results presented in this TRS, it is the QP’s opinion that the Mineral Resources have Reasonable Prospects for Economic Extraction.
| 1.5 | Mineral Reserves estimates |
The Mineral Reserves have been defined, classified and reported according to the guiding principles and minimum requirements as set out in S-K 1300.
The QP is satisfied that there has been sufficient standard of evaluation to support estimation of a Mineral Reserve that has been demonstrated to be technically and economically viable.
WSP has applied an extractable mining recovery of 90% applied in conjunction with the Mine Call Factor (MCF). The MCF is the product of the Block Call Factor (BCF), and the Assay Plan Factor (APF). The APF for this estimate is applied to gold grade (102.1% of resource grade), reflecting both plan dilution and positive reconciliation as a 3-year trailing average excluding outliers (+10%) as at end December 2025. The BCF has been calculated to 98% utilising the same methodology giving a MCF of 100.1%. Mineral Reserves are reported on a plant feed basis, inclusive of dilution and ore loss modifying factors, assuming a gold metallurgical recovery of 89%.
The Mineral Reserve accounts for 3.6%, by tonnage, of the current Mineral Resource inclusive of the surface sands (tailings). The Mineral Reserve accounts for 44.5%, by tonnage, of the HGM 9-year strategic LOM plan inclusive of the surface sands (tailings).
The Mineral Reserve estimate is based on Proved and Probable material only, delineated by Datamine’s MSO software, that has been deemed to be economically viable through industry accepted mine planning practices. The economic basis for the Mineral Reserve is based on detailed financial modelling of the Mineral Reserve only mine plan.
| Project No PS229049 | WSP |
| How Mine | March 2026 |
| S-K 1300 Technical Report Summary | Page 3 |
| Namib Minerals |
Please note that the HGM strategic LOM plan is a combination of the Mineral Reserve only mine plan with the addition of Inferred material that has been assessed to be safely and economically extractable within the parameters of the current mine design.
Further Inferred material may be able to be added to the HGM strategic LOM plan once a strategic LOM is completed. Please note that such a study is outside the purview of the requirements to generate this report.
Table 1.4 presents the HGM Mineral Reserves estimate as at 31 December 2025.Table 1-4 Mineral Reserves estimate as at 31 December 2025
| Category | Tonnage (Mt) | Au Grade (g/t) | Au Metal (koz) | % Contribution |
| Underground | ||||
| Proved Reserve | 1.08 | 1.40 | 48 | 47% |
| Probable Reserve | 0.52 | 1.70 | 28 | 27% |
| Total Proved & Probable | 1.60 | 1.50 | 77 | 75% |
| Surface | ||||
| Probable Reserve | 0.89 | 0.89 | 26 | 25% |
| Grand Total | 2.49 | 1.29 | 103 | 100% |
Notes: UG = Underground, SF = Surface Stockpile Dam 3 and 4.
The estimates are rounded to reflect the order of accuracy, to the nearest ten thousand tonnes (10 kt) for tonnage, to two decimal places for grade, and to the nearest thousand ounces (koz) for contained gold. Estimates are prepared carrying relevant decimal place accuracy to derive subtotals and totals that are subsequently rounded. Minor rounding errors may occur as a result.
| 1.6 | Capital and operating costs |
Capital and operating cost estimates have been prepared by HGM to generate a 4-year Mineral Reserves only plan, plus 1 year for mine closure. WSP has analysed historical physical quantities, operating and capital costs of operation over the past 3 years 2023 – Q1 2026, and estimated an additional 5% contingency which has been applied to all operating and capital costs. Mine closure independently includes a contingency of 15.0%.
Capital costs total US$30.0 M comprising sustaining capital of US$27.6 M, growth capital of US$2.4. M (only in CY2025 for underground and process plant production upgrades) and mine closure of US$7.6 M (assuming a planned closure scenario). A mine closure cost estimate of US$8.1 M has been updated December 2025 in a review undertaken by Enmin Consulting (Private) Limited (Enmin).
Operating costs total US$123.5 M (averaging US$77.12/t processed) comprising direct operating C1 costs of US$108.5 M (US$67.81/t processed) and fixed overheads US$14.9 M (US$9.33/t processed).
Given the historical track record of operation of the HGM, and a 5% contingency allowance for both operating and capital costs, WSP views the cost estimates comply with the level of accuracy required by § 229.1302 (Item 1302 of Regulation S–K). The capital and operating cost estimate accuracy is assessed at +15% while a 5% contingency allowance on all costs is consistent with recent historical variability as a provision for any additional, unforeseen costs associated with unanticipated geologic circumstances, engineering conditions and unanticipated geopolitical conditions.
| Project No PS229049 | WSP |
| How Mine | March 2026 |
| S-K 1300 Technical Report Summary | Page 4 |
| Namib Minerals |
| 1.7 | Economic evaluation |
Key outcomes of the cashflow evaluation and sensitivity analysis on an after-tax basis, considering Mineral Reserves only are:
| — | A positive project NPV of US$22.1 M when Mineral Reserves only (PP) are considered over a 4-year LOM. |
| — | The project value is most sensitive to operating costs then gold price, but relatively less sensitive to capital cost. |
| — | The project value is relatively less sensitive to discount rate over a 11% – 20% range and gold price range from -25% (US$2,454/oz) and +25% (US$4,090/oz). |
| — | Project breakeven for the Mineral Reserve inventory is a 24% fall in gold price (US$2,640/oz) or a 37% increase in total costs. |
On this basis, the economic analysis is judged sufficiently robust to provide breakeven economics within a +10% level of accuracy and <15% contingency.
| 1.8 | Permitting requirements |
The ML is renewed on an annual basis with the Government of Zimbabwe. The area covered by ML 28 was surveyed and declared to be 2,408 ha. Isolated cases of illegal gold mining activities have been reported along some streams, and historical mine workings in the ML 28 area. Higher artisanal activity is concentrated along the Mzingwane River, on the southern margins of the ML 28 area. The ML is renewed annually, and the current certificate is valid to 17 August 2026.
| 1.9 | QP’s conclusions and recommendations |
| 1.9.1 | Mineral Resources |
Based on the information presented in this TRS, the QP’s key conclusions are as follows:
| — | The level of understanding of the regional geology, local geology and the nature and controls on mineralisation are high, and provide a solid foundation for geological modelling, Mineral Resource estimation, and mining and exploration geology. |
| — | The drilling, sampling, assay and Quality Assurance Quality Control (QAQC) techniques used for both exploration and resource estimation are consistent with standard industry practice and are considered appropriate for the purposes of geological modelling and Mineral Resource estimation. |
| — | The on-site assay laboratory is well-equipped, clean and maintained and is suitable for the work it is being utilised for. |
| — | The Mineral Resource estimate uses ordinary kriging which is considered appropriate for the mineralisation style. |
| — | Grade estimates were constrained to updated mineralisation wireframes during grade estimation and includes mineralisation defined using a lower cutoff of 0.36 g/t Au. |
| — | Quality Assurance Quality Control (QAQC) techniques used for both exploration and resource estimation are consistent with standard industry practice and are considered appropriate for the purposes of geological modelling and Mineral Resource estimation. |
| — | Grade estimates utilise all available samples, including channel, sludge and diamond drill core samples and incorporate level mapping where available. |
| — | Dry bulk density of 2.8 tonnes per cubic metre (t/m3) was assigned for all mineralised domains. |
| — | Statistical validation of the Mineral Resource estimate as well as visual validation has been completed and demonstrates a robust estimate which correlates well to the input data. |
| — | RPEE has been considered, and the parameters used are considered reasonable. The Mineral Resource estimate has been reported withing Mineable Stope Optimiser (MSO) shapes demonstrating reasonable prospects of economic extraction. |
| — | The Mineral Resource classification that has been applied is considered appropriate. |
| Project No PS229049 | WSP |
| How Mine | March 2026 |
| S-K 1300 Technical Report Summary | Page 5 |
| Namib Minerals |
Based on the information presented in this TRS, the QP’s key recommendations are as follows:
| — | Data and database management requires additional work to streamline the existing process and remove the current need for manual transcription of assay results and other data, and to ensure built in validation of data is completed. It is recommended that HGM invest in a corporate database with inbuilt validation routines and reporting functionality to assist with the large amount of geological information currently housed in excel spreadsheets. |
| — | Consider the creation of a lithology and a structural model to help guide the mineralisation modelling. |
| — | Further bulk density testwork should be completed to ensure the values used in the Mineral Resource are appropriate and suitable for use across the entire deposit. It is recommended that density values are reviewed by lithology and area of the mine to determine whether different values would be more appropriate. |
| — | Consider changing the down hole survey method currently used to a north seeking gyro tool to minimise the impact of magnetic material currently influencing the surveys at depth. |
| — | Include blank material with every laboratory submission to test the amount of contamination between samples through the sample preparation stages at the laboratory. |
| — | Undertaking core photography will provide a lasting record of drilling, particularly useful when mining historic areas where the core has already been disposed of. |
| — | Mineral Resource reconciliation practices should be reviewed, and a system implemented that provides a measure of the estimate’s performance. It is recommended that mined development and production be reconciled monthly, and stope close-out reports be developed for each completed stope. |
| 1.9.2 | Mineral Reserves |
The QP is satisfied with the basis for estimation and update of the 2025 Mineral Reserves. The outlook for the Mineral Reserve and generally the LOM has improved on a number of fronts, these being:
| — | Capital upgrades to increase underground production and process throughput from 40.5ktpm to 55ktpm due to be completed by end 2026 |
| — | The shaft was extended to 34L allowing access to lower levels and installation of the loading pocket. Further shaft deepening to the 36L, eventually to 38L, is planned and will allow access to the deeper Mineral Resources and Mineral Reserves. |
| — | Process plant capital upgrades and improvements that are ongoing to provide improved plant reliability and performance. |
| — | Work has been completed to consolidate the individual Mineral Resource models into a single Mineral Resource model streamlining the process for Mineral Resource and Mineral Reserve estimation. |
| — | An adjusted increase to the gold price of US$3272/oz assumed for cashflow evaluation, and cut-off grade (pay limit) determination. |
| — | WSP has completed a Mineral Reserve update based on modern software and accepted mine designs and mine planning practices for stoping and the majority of lateral and vertical development. Where WSP has used existing stope designs the stope block assessments are supported by technical work and methodology to the required level to estimate a Mineral Reserve. |
| Project No PS229049 | WSP |
| How Mine | March 2026 |
| S-K 1300 Technical Report Summary | Page 6 |
| Namib Minerals |
Based on the information presented in this TRS, the QP’s key conclusions are as follows:
| — | The planned development metres, and the scheduling of them, lack the detail provided the planned stopes. While WSP believes the historical, and current, monthly actuals are adequate for the current mine plan to be achieved it is preferable to include greater detail for all development types in the mine schedule and plan. WSP notes that HGM has confirmed they will be upgrading their mine planning software, and processes, in CY2026 with the assistance of Maptek’s Vulcan software. Preparation of complete development wireframes for inventory interrogation that may allow additional ore tonnages and overall Mineral Resource recovery. |
As part of the updates to HGM’s mine planning process WSP recommends including:
| — | The system of application of mining modifying factors based on reconciliation is a conventional approach, however, consideration should be given to separate estimation of tonnage and grade factors, particularly where there is significant contribution to production from MII category resources (non-PP). This may be implemented in the electronic mining schedule. |
| — | Review of Mineral Reserve definition and stope design practices maximising the utilising of modern mining software. |
| — | Review of the application APF, BF and BCF modifying factors based on gold metal content and applied solely as a grade factor. |
| — | Review of stope block Mineral Reserve, break, hoist, mill feed and reconciled mill production to confirm reconciliation factors calculated monthly. Additionally, a complete review of the reconciliation process should be undertaken to confirm the gross level of dilution and ore loss, planned (via stope design), unplanned (operational) and actual. |
| — | Review of average mineralisation width, stope block width and diluent grade to ensure that appropriate account is made for both practically achievable mining widths and dilution estimates when using modern software to create stope shapes. |
The QP recommends providing further HGM improvements to future Mineral Reserve estimates including:
| — | The level of overall plan dilution appears low but the manner in which the MCF, dilution and extraction are applied adequately account for both excess dilution and ore loss in the stopes. There is no separate account for unplanned or operational ore loss. The APF and BF estimated from gold content are applied as the MCF only on the grade. In effect, the adoption of APF and BF factoring of grades accounts for historical production performance as call factors that take account of both dilution and ore loss, however, the relatively high level of contribution from Inferred resource category (20-50% historically) may be masking the overall reconciliation. |
| — | Ore tonnages are reported on a dry basis. Recent inspection in February 2026 indicates that the mine is relatively dry. Density estimates are applied at one significant decimal place. WSP recommends estimating average densities either by interpolation within the Mineral Resource model by lithology or by reconciliation to derive an average dry density estimate to two significant decimal places. |
| — | Marginal blocks were included in the Mineral Reserve base. These blocks were included by the QP on the basis of a reduction in the pay limit to 0.6 g/t, based on US$3,272/oz, given the hoisting and processing availability for each year in the Mineral Reserve mine plan. |
| — | Underground and surface broken ore stocks have not reconciled. Starting stocks for the LOM plan end December 2025 assume nil stocks. |
| — | The surface Dam Sands #3 & #4 Mineral Reserve estimates are appropriately based on survey solid wireframes, resource models and pay limit estimates (0.8 g/t). The Dam Sands (sands) Mineral Reserve is not currently included in the LOM plan since it would displace higher grade underground resource but remains as potential project upside at the conclusion of underground mining and processing. The sands process amenability should be reviewed with respect to potential for impurities, deleterious elements and pregnant solution robbing materials. Process variability testwork should be revisited. The marginal cut-off for the sands has been calculated in the relevant section in this report. |
| — | Capital and operating costs for the operation are considered appropriate and compare well with historical benchmarks, contracts and quotations. A 5% contingency allowance is included in WSP estimates. |
| — | Unit operating costs should be reviewed on a fixed and variable basis to confirm forecast cost savings from economies of scale. This is an area that HGM is currently improving and should be finalised in CY2026. |
The mining methods are appropriate to the style and type of mineralisation and are based on a history of successful implementation. Subject to capital constraints, the QP recommends consideration be given to implementing more modern, mechanised mining techniques to improve general safety, productivity and production tonnage per personnel-shift. This will need to take appropriate account of the existing underground infrastructure and constraints, including ventilation. It could include the use of diesel, electric or battery powered boggers and electric-hydraulic drill rigs.
| Project No PS229049 | WSP |
| How Mine | March 2026 |
| S-K 1300 Technical Report Summary | Page 7 |
| Namib Minerals |
| 2 | Introduction |
| 2.1 | Registrant information |
This Technical Report Summary (TRS) is for the Namib Minerals owned How Gold Mine (HGM) [or the Property], located in Matabeleland South Province, southwestern Zimbabwe, and was prepared by the Qualified Person (QP) for Namib Minerals.
HGM is wholly owned and operated through Namib Minerals. Namib Minerals acquired BMC - the long-standing operator of the mine in 2025 from Greenstone Corporation. Following this transaction, Namib Minerals holds 100% indirect ownership of HGM, while BMC continues to function as the on-site operator under the new corporate structure
The area covered by ML 28 has a surface area of 2,408 hectares (ha) [Figure 3.2].
Figure 2.1 presents the corporate structure of Namib Minerals.
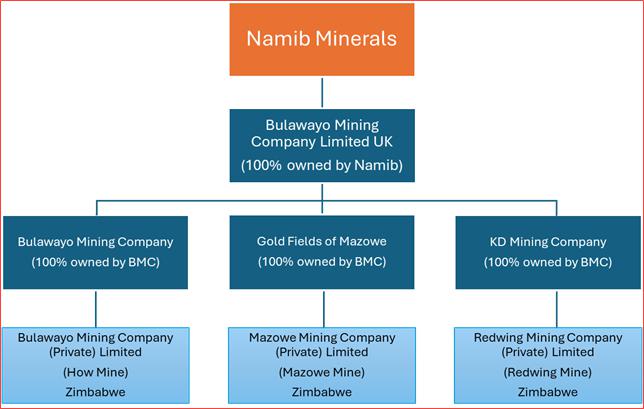
Figure 2.1 Namib Minerals corporate
This portfolio of mineral assets located in Zimbabwe consists of three mining properties located within a significant land package consisting of some 66.02 square kilometres (km2) in area. The mining properties comprise three separate underground gold mines, namely: How, Mazowe, and Redwing. Each mining property is serviced by its own dedicated processing facilities and accompanying infrastructure. Namib considers there to be significant exploration potential at each of the mining properties.
From acquisition of the assets in 2002 until 2006, gold production steadily increased, with gold production peaking in 2005 at approximately 156,000 ounces (oz) of gold, one of Zimbabwe’s largest gold producers.
Due to political unrest and hyperinflation in 2007, BMC Limited’s mining activities in Zimbabwe ceased, and all mines were placed on Care and Maintenance (C&M). In 2009, mining activities recommenced, with several of the mines requiring rehabilitation work.
| Project No PS229049 | WSP |
| How Mine | March 2026 |
| S-K 1300 Technical Report Summary | Page 8 |
| Namib Minerals |
Operations were suspended at the Mazowe Gold Mine (MGM) on 31 December 2018, and at the Redwing Gold Mine (RGM) on 30 March 2019 due to general economic challenges.
Gold production from the HGM since 2018 is as follows (BMC Zimbabwe Operation Reports):
| — | 2018: 39,746 oz. |
| — | 2019: 25,719 oz. |
| — | 2020: 19,099 oz. |
| — | 2021: 30,381 oz. |
| — | 2022: 26,769 oz. |
| — | 2023: 33,714 oz. |
| — | 2024: 36,636 oz. |
| — | 2025: 25,004 oz. |
| 2.2 | Terms of reference and purpose |
WSP was appointed by Namib to prepare this Technical Report Summary (TRS) to report Mineral Resources, and Mineral Reserves for the How Gold Mine effective 31 December 2025 . This TRS conforms to the United States Securities and Exchange Commission’s (SEC) Modernized Property Disclosure Requirements for Mining Registrants as described in Subpart 1300 of Regulation S-K, Disclosure by Registrants Engaged in Mining Operations (S-K 1300), and Item 601(b)(96) of Regulation S-K. Mineral Resources and Mineral Reserves reported herein are supported by annual report statements prepared by Namib Minerals in accordance with S-K 1300 requirements.
The WSP Qualified Persons (QPs) who have prepared this TRS meet the QP requirements defined by the SEC.
The TRS utilises:
| — | Australian English spelling. |
| — | Metric units of measure. |
| — | Gold grades presented in grams per tonne (g/t). |
| — | Co-ordinate system presented in metric units using Cape/Lo29. |
| — | United States Dollars (USD). |
Summary Mineral Resources and Mineral Reserves in Table 1.1, Table 1.2, Table 1.3, and Table 1.4 are presented based on a Namib Minerals equity ownership basis (100%).
Key acronyms and definitions used in this TRS include those items listed in Table 2.1.
| Table 2-1 | List of acronyms and abbreviations used in this TRS |
| Acronym/Abbreviation | Description |
| ° | Degrees |
| °C | Degrees Celsius |
| ACZ | Airport Company of Zimbabwe (Private) Limited |
| AMD | Acid Mine Drainage |
| amsl | Above mean sea level |
| APF | Assay Plan Factor |
| ASCII | American Standard Code for Information Interchange |
| Attica | Attica Mines (Pvt) Ltd. |
| Project No PS229049 | WSP |
| How Mine | March 2026 |
| S-K 1300 Technical Report Summary | Page 9 |
| Namib Minerals |
| Acronym/Abbreviation | Description |
| Ballarat | Ballarat Mines (Pvt) Ltd |
| BBR | Beitbridge Bulawayo Railway (PVT) LTD |
| BCF | Block Call Factor (a mine call factor) |
| BD | Bulk Density |
| BGB | Bulawayo Greenstone Belt |
| BIF | Banded Iron Formation |
| BF | Block Factor |
| BMC Limited | Bulawayo Mining Company Limited |
| BMC Zimbabwe | Bulawayo Mining Company (Private) Limited Zimbabwe |
| BMC UK | Bulawayo Mining Company (UK) Limited |
| CAD | Computer-Aided Design |
| Capex | Capital Expenditure |
| CFM | Cubic Feet per Metre |
| CIP | Carbon in Pulp |
| C&M | Care and Maintenance |
| COG | Cut Off Grade |
| CPR | Competent Person’s Report |
| CRM | Certified Reference Material |
| CV | Coefficient of Variation |
| DRC | Democratic Republic of Congo |
| DXF | Drawing Exchange Format |
| EBIT | Earnings Before Interest and Taxes |
| EBITDA | Earnings Before Interest, Taxes, Depreciation, and Amortization |
| EDA | Exploratory Data Analysis |
| EIA | Environmental Impact Assessment |
| EMA | Environmental Management Agency |
| EMP | Environmental Management Plan |
| Enmin | Enmin Consulting (Private) Limited. |
| ESIA | Environmental and Social Impact Assessment |
| FGB | Filabusi Greenstone Belt |
| Frobisher | Frobisher Ltd. |
| FS | Feasibility Study |
| Goldfields | Goldfields Development Co. Ltd |
| Project No PS229049 | WSP |
| How Mine | March 2026 |
| S-K 1300 Technical Report Summary | Page 10 |
| Namib Minerals |
| Acronym/Abbreviation | Description |
| g | Grams |
| g/l | Grams per litre |
| g/t | Grams per tonne |
| ha | Hectares |
| Halo | Halo Co. Ltd |
| HGM | How Gold Mine |
| IML | Independence Mining (Private) Limited |
| ISO | International Organization for Standardization |
| Independence | Independence Mining (Pvt) Ltd. |
| JMN | Joshua Mqabuko Nkomo International Airport |
| kg | Kilograms |
| km | Kilometres |
| km2 | Square kilometres |
| koz | Thousand ounces |
| kt | Thousand tonnes |
| ktpa | Thousand tonnes per annum |
| ktpm | Thousand tonnes per month |
| kV | Kilovolts |
| l/s | Litres per second |
| LOM | Life of Mine |
| Lonmin plc | Lonmin |
| Lonrho | Lonrho Zimbabwe (Pvt) Ltd. |
| m | Metres |
| M | Million |
| MAR | Mean annual run-off |
| MCF | Mine Call Factor |
| Ml | Megalitre |
| ML | Mining Lease |
| mm | millimetre |
| MMC Zimbabwe | Mazowe Mining Company (Private) Limited Zimbabwe |
| MPa | Megapascal |
| Middindi | Middindi Consulting Pty Ltd |
| Mt | Million tonnes (metric) |
| Project No PS229049 | WSP |
| How Mine | March 2026 |
| S-K 1300 Technical Report Summary | Page 11 |
| Namib Minerals |
| Acronym/Abbreviation | Description |
| mVA | Megavolt-ampere |
| NPV | Net Present Value |
| NRZ | National Railways of Zimbabwe |
| OK | Ordinary Kriging |
| opex | Operating Expenditure |
| oz | Ounce |
| PSA | Pressure Swing Absorption |
| QAQC | Quality Assurance Quality Control |
| QP | Qualified Person |
| Rhodesian | Rhodesian Gemstones (Pvt) Ltd. |
| RMC Zimbabwe | Redwing Mining Company (Private) Limited Zimbabwe |
| RMR | Rock mass rating |
| ROB | Rough-Ore-Bin |
| ROM | Run of Mine |
| RPEE | Reasonable Prospects for Economic Extraction |
| RTGS | Real Time Gross Settlement |
| SAMREC | South African Mineral Resource Committee |
| SD | Standard Deviation |
| SG | Specific Gravity |
| SHEQ | Safety, Health, Environment and Quality |
| SRK | SRK Consulting (South Africa) (Pty) Ltd |
| t | Tonne |
| t/m3 | Tonnes per cubic metre |
| tpm | Tonnes per month |
| TRS | Technical Report Summary |
| TSF | Tailings Storage Facility |
| UK | United Kingdom |
| μm | Micrometre |
| USD | United States Dollar |
| WSP | WSP Australia Pty Limited |
| Wt.% | Weight percent |
| ZESA | Zimbabwe Electricity Supply Authority |
| ZETDC | Zimbabwe Electricity Transmission and Distribution Company |
| Project No PS229049 | WSP |
| How Mine | March 2026 |
| S-K 1300 Technical Report Summary | Page 12 |
| Namib Minerals |
| Acronym/Abbreviation | Description |
| ZiG | Zimbabwe gold currency |
| ZINIRE | Zimbabwe National Institute of Rock Engineering |
| ZWL | Zimbabwean Dollar |
| 2.3 | Sources of information |
This TRS relies upon various reports and other material prepared by Namib Minerals and information from staff and consultants as provided to WSP. This data and information have been supplemented with information in the public domain, and through information gathered during a site inspection by WSP in February 2026 (Section 2.4).
WSP has taken reasonable care to ensure that the information contained in this TRS is in accordance with the facts and information available to it and is unaware of any omission likely to affect its import.
| 2.4 | Personal inspection |
Information in this TRS has been prepared under the supervision of the WSP QPs for Geology/Resources and Mining/Reserves.
The WSP geologist and mining engineer visited the site between 24 February 2026 and 25 February 2026. The WSP geologist reviewed the regional and deposit geology with senior personnel from the management, geology and mining teams. They visited the core storage facility to review the deposit geology, core logging, sampling, analytical, QAQC, and core/sample chain of custody and archiving processes and also visited the site laboratory, the sand dumps and a surface drill rig drilling potential new resource areas above the 10 Level.
WSP QPs visited the operating underground mine (active development and production areas) and surrounding area and observed exploration drilling occurring on the 30 Level.
During the personal inspection, the WSP QPs interviewed senior personnel from the management, geology and mining teams regarding recent mine performance, practices and financial performance.
| 2.5 | Previously filed Technical Report Summaries |
This is the second TRS filed for the Property. The first TRS was filed in January 2024, with an effective date of 31st December 2023.
| 2.6 | WSP declaration |
The opinions of QPs in the employ of WSP contained herein and effective 31 December 2025, are based on information collected throughout the course of investigations by the QPs. The information in turn reflects various technical and economic conditions at the time of preparing the TRS. Given the nature of the mining business, these conditions can change significantly over relatively short periods of time. Consequently, actual results may be significantly more or less favourable.
This TRS may include technical information that requires subsequent calculations to derive sub-totals, totals, and weighted averages. Such calculations inherently involve a degree of rounding, and consequently introduce a margin of error. Where these occur, the QPs do not consider them to be material.
Neither WSP, nor the QPs responsible for this TRS, are insiders, associates, or affiliates of Namib or any of its subsidiaries. The results of the technical review by the QPs are not dependent on any prior agreements concerning the conclusions to be reached, nor are there any undisclosed understandings concerning any future business dealings.
| Project No PS229049 | WSP |
| How Mine | March 2026 |
| S-K 1300 Technical Report Summary | Page 13 |
| Namib Minerals |
| 2.7 | Statement of Independence |
WSP has provided and continues to provide technical consulting services to Namib Minerals with respect to its mineral assets; some of that work is referred to in this report. The work is carried out independently on a fee for service basis. Fees generated from Namib Minerals are not material to WSP either locally or globally. The QPs have not previously worked on projects for Namib Minerals and in our opinion, WSP’s association with Namib Minerals does not impact on the independence of this report. Furthermore:
| — | WSP and the authors of this report have no material present or contingent interest in or association with Namib Minerals, and their subsidiaries or the assets under review. Individual employees of WSP may hold non-material securities holdings in these entities either directly or indirectly. |
| — | WSP has had no material association during the previous two years with the owners/promoters of the mineral assets, the company acquiring the assets or any of the assets to be acquired and has no material interest in the projects. |
| — | There are no business relationships between WSP and Namib Minerals. WSP or its employees and associates are not, nor intend to be, a director, officer or other direct employee of Namib. The relationship with Namib Minerals is solely one of professional association between client and independent consultant. |
| — | WSP does not hold and has no interest in the securities of Namib Minerals and its subsidiaries under review. |
| — | WSP has no relevant pecuniary interest, association or employment relationship with Namib Minerals and its subsidiaries. |
| — | WSP has no interest in the material tenements, the subject of the Report. |
| — | WSP is not a substantial creditor of an interested party, nor has WSP a financial interest in the outcome of the proposal. The review work and this report are prepared in return for professional fees based upon agreed commercial rates and the payment of these fees is in no way contingent on the results of this report. |
| — | The Report has been prepared in compliance with the Australian Corporations Act and ASIC Regulatory Guide 112 with respect to WSP’s independence as experts. |
| — | Fees for the preparation of this report are being charged at WSP’s standard schedule of rates, with expenses being reimbursed at cost plus a handling charge. Payment of fees and expenses is in no way contingent upon the conclusions of this report. |
| — | Based on the information provided to WSP and to the best of its knowledge, WSP has not become aware of any material change or matter affecting the validity of the report. |
| Project No PS229049 | WSP |
| How Mine | March 2026 |
| S-K 1300 Technical Report Summary | Page 14 |
| Namib Minerals |
| 3 | Property description |
| 3.1 | Property location |
The Property is located in Matabeleland South Province, Zimbabwe, approximately 30 km southeast of the city of Bulawayo (latitude 20°18’S and longitude 28°46‘E), in the Bulawayo Mining District of Zimbabwe.
The location of the Property and its proximity to major infrastructure is presented in Figure 3.1.
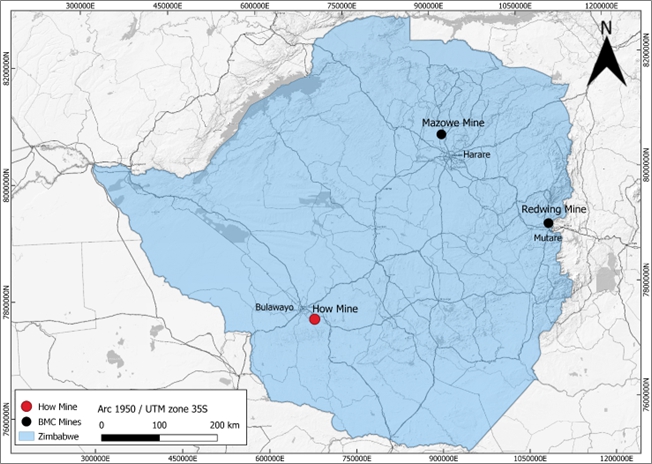
Figure 3.1 Property location map
| 3.2 | Title and mineral rights |
BMC Zimbabwe, a wholly owned subsidiary of BMC UK, which is a wholly owned subsidiary of Namib Minerals, holds ML 28. The area covered by ML 28 has a surface area of 2,408 ha. ML 28 is renewed annually, and the current certificate is valid until 17 August 2026.
Isolated cases of artisanal gold mining activities have been reported along some streams, and historical workings within the ML area. Artisanal activity is largely concentrated along the Mzingwane River, on the southern margins of the ML area.
| Project No PS229049 | WSP |
| How Mine | March 2026 |
| S-K 1300 Technical Report Summary | Page 15 |
| Namib Minerals |
Figure 3.2 presents the ML 28 boundary.
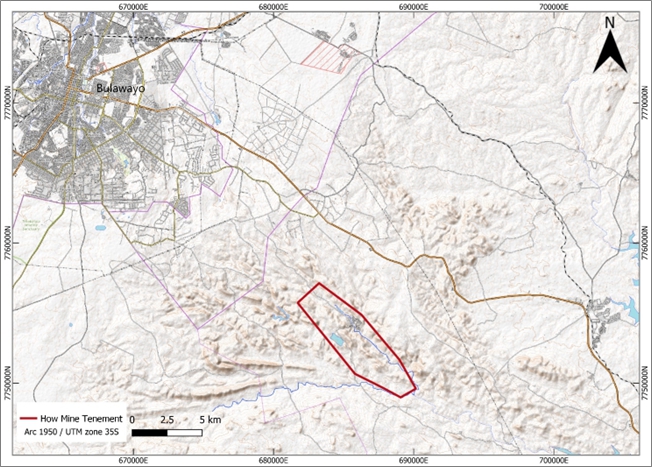
Figure 3.2 HGM ML 28 boundary
While WSP has referred to tenement holdings in this TRS, such reference is for convenience only and may not be complete or accurate. WSP is not expert in tenement management and the reader should not rely on information in this TRS relating to the current ownership and legal standing of the tenements or any encumbrances impacting on those tenements. This TRS assumes that all tenements and tenement applications are in good standing and free of all encumbrances other than those set out in this TRS.
| 3.3 | Encumbrances |
There are no known significant encumbrances to the Property that would impact the current Mineral Resources or Mineral Reserves.
| 3.4 | Risks to access, title or right to perform work |
Access to the mine site and to the ore is authorised by the applicable mining legislation, and BMC Zimbabwe’s title and mining rights (Section 3.2). Mining exploration and exploitation works conducted or to be conducted on site are authorised in accordance with the applicable legislation, and BMC Zimbabwe’s title and mining rights (Section 3.2). Other required permits and authorisations (e.g., environmental, building, etc.) are applied for by BMC Zimbabwe in accordance with the applicable legislation.
| Project No PS229049 | WSP |
| How Mine | March 2026 |
| S-K 1300 Technical Report Summary | Page 16 |
| Namib Minerals |
| 3.5 | Agreements and royalties |
In 2022, the government of Zimbabwe has promulgated new regulations through Statutory Instrument 189 of 2022 to the effect that mineral royalties are to be paid partly in kind and partly in monetary form. The mineral royalties are collected from minerals specified in terms of section 49(1)(c1) of the Reserve Bank of Zimbabwe Act [Chapter 11:15] deemed to be components of the reserves maintained by the Reserve Bank of Zimbabwe. Minerals include but are not limited to gold, diamonds, platinum group metals and lithium. These regulations have also caused timeous amendments to the Finance Act and the Reserve Bank of Zimbabwe Act to ensure the cooperation in application of legislation (BMC 2023b).
In 2024, the monetary component was revised.
Royalties remitted to the Zimbabwe Revenue Authority in respect of gold and those minerals specified are paid based on 50% in kind and 50% in monetary form. With regards the “in kind component”, miners submit actual minerals they would have extracted. The 50% monetary component would be paid as follows:
| — | 37.5% in the Zimbabwe Gold (ZiG) currency. |
| — | 12.5% in foreign currency (RBZ 2024). |
| — | Prior to the promulgation of these regulations, royalties were paid only in monetary form. |
| — | A US$21 per kilogram (/kg) realisation fee is also charged for gold lodged with Fidelity Printers and Refiners (BMC 2023b). |
| 4 | Accessibility, climate, local resources, infrastructure, and physiography |
| 4.1 | Topography, elevation, and vegetation |
The HGM is located at an altitude of approximately 1,250 m above mean sea level (amsl). The surrounding hills range between 1,230 and 1,410 m amsl, and the property drains southeast towards the Mzingwane River (BMC 2023b).
The natural vegetation of the Property is veldt, which covers the gently undulating hills and slopes. Various types of mixed woodland species are naturally found throughout the area. However, the natural vegetation in the area has not been significantly disturbed particularly by forestry activities and historic mining activity dating back to early 1941. Invader plants include amongst others Eucalyptus (gum tree). The majority of the vegetation in the area consists of indigenous plants (BMC 2023b).
| Project No PS229049 | WSP |
| How Mine | March 2026 |
| S-K 1300 Technical Report Summary | Page 17 |
| Namib Minerals |
| 4.2 | Access and proximity to population centres |
The HGM is located approximately 30 km southeast (by road) of the city of Bulawayo (latitude 20°18’S and longitude 28°46‘E), which has a population of approximately 1.5 million (urban plus rural areas).
Bulawayo is serviced by Joshua Mqabuko Nkomo International Airport (JMN), operated by the Airport Company of Zimbabwe (Private) Limited (ACZ), which has the capacity to handle 1.5 million passengers per annum (ACZ 2024), and by rail. The National Railways of Zimbabwe (NRZ) provides both freight services (NRZ 2024a), and passenger services (NRZ 2024b), whilst the Beitbridge Bulawayo Railway (PVT) LTD (BBR) provides a dedicated freight service to South Africa.
The Property is accessible via a sealed road from Bulawayo, which is in fair condition.
| 4.3 | Climate |
The HGM operates continuously throughout the year, with no interruptions due to seasonal changes.
Bulawayo is located in the tropics but due to its high altitude has a sub-tropical climate, classified as hot semi-arid climate (BSh) under the Köppen climate classification. The average annual temperature is 19 degrees Celsius (°C), with maximum daily temperatures ranging from 21°C in July to 30°C in October and cool nightly minimum temperatures ranging from 7°C in July to 16°C in January. Bulawayo experiences three distinct seasons: a dry cool winter from May to August; a hot dry early summer from August to November; and a warm wet late summer from November to April (BMC 2023b).
The mean annual rainfall is 575 millimetres (mm) falling mostly between November and February. However, the region is vulnerable to drought and wet season rainfall can vary significantly from one year to the next. 888 mm of rain fell between December and February in 1978, while only 84 mm fell during the same period in 1983 (BMC 2023b).
Table 4.1 and Figure 4.1 present climate statistics for Bulawayo, Zimbabwe.
Table 4-1 Mean temperatures in Bulawayo (World Meteorological Organization)
| Month | Jan | Feb | Mar | Apr | May | Jun | Jul | Aug | Sep | Oct | Nov | Dec |
| Mean Maximum (°C) | 27.7 | 27.2 | 27.1 | 25.9 | 24.1 | 21.6 | 21.5 | 24.4 | 27.9 | 29.4 | 28.7 | 27.7 |
| Mean Temperature (°C) | 21.8 | 21.2 | 20.6 | 18.7 | 16.0 | 13.7 | 13.8 | 16.4 | 19.9 | 21.6 | 21.7 | 21.4 |
| Mean Minimum (°C) | 16.5 | 16.2 | 15.3 | 13.0 | 9.9 | 7.4 | 7.2 | 9.1 | 12.4 | 15.0 | 16.0 | 16.3 |
| Mean Rainfall (mm) | 117.8 | 104.6 | 51.4 | 33.3 | 7.0 | 2.2 | 1.0 | 1.4 | 7.0 | 38.4 | 91.1 | 120.3 |
| Mean rainy days | 10 | 8 | 5 | 3 | 1 | 1 | 0 | 0 | 1 | 4 | 8 | 10 |
Notes: Climatological information is based on monthly averages for the 30-year period 1961–1990.
| Project No PS229049 | WSP |
| How Mine | March 2026 |
| S-K 1300 Technical Report Summary | Page 18 |
| Namib Minerals |
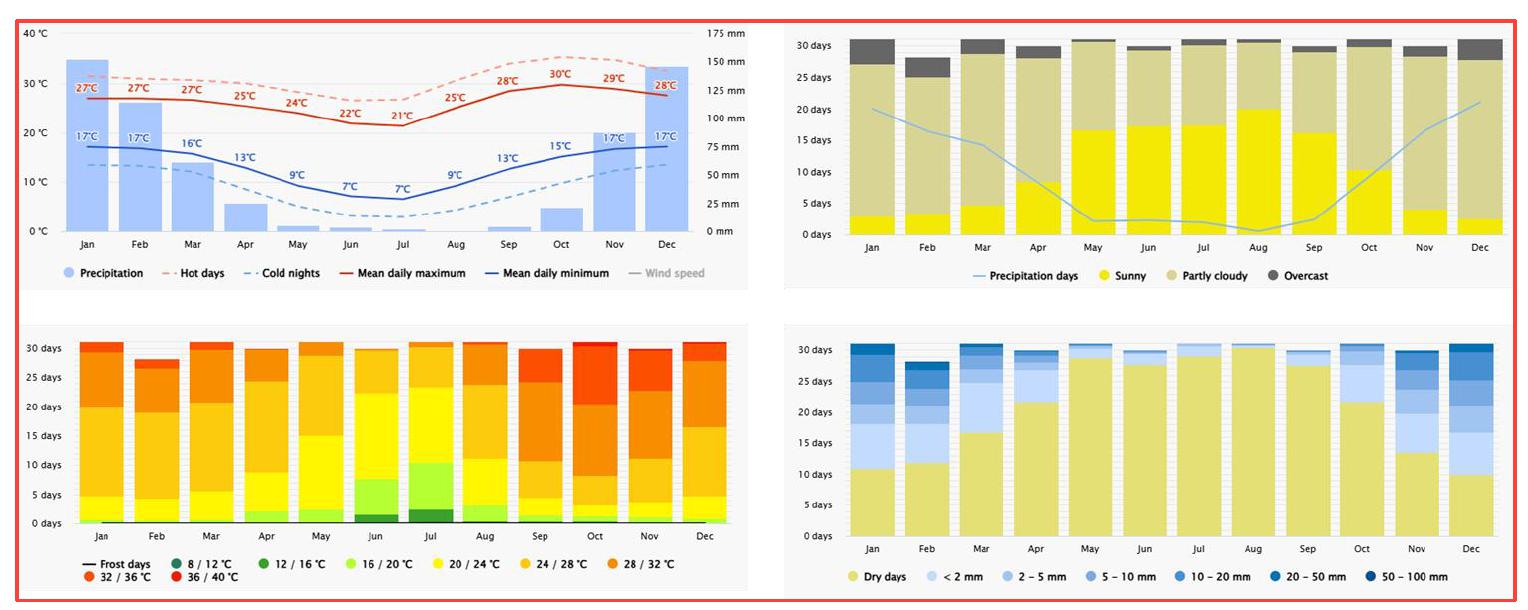
Figure 4.1 Climate statistics for Bulawayo, Zimbabwe (Meteoblue 2026)
| 4.4 | Local resources and existing infrastructure |
| 4.4.1 | Power supply |
Electricity is provided from the national grid through the Springs and Criterion lines at 7.5 Megavolt Ampere (MVA), and 2.5 MVA respectively. The lines are operated by the Zimbabwe Electricity Supply Authority (ZESA).
| 4.4.2 | Water supply |
Water used in the operations is obtained from a dam on the Gabalozi River (on the mine site) and the Chimedza Dam (located approximately 7 km west of the mine location). Drinking water is provided from a line supplying the City of Bulawayo. Water is also supplied by way of water bores drilled on site.
| 4.4.3 | Personnel |
For the 40,500 tonnes per month (tpm) throughput, budgeted employee establishment is 1,023 of whom 111 are managerial employees. The staff is largely housed on-site, in family accommodation, except for a few members of staff who are bussed in from Bulawayo daily.
| 4.4.4 | Suppliers |
The principal raw materials used in the mining operations are fuel, electricity (Section 4.4.1), and water (Section 4.4.2). Diesel fuel is used to power front-end loaders, tractors, motor vehicles, and standby power generators. The mine is currently upgrading the on-site fuel pump station to a holding capacity of 35,000 litres.
| Project No PS229049 | WSP |
| How Mine | March 2026 |
| S-K 1300 Technical Report Summary | Page 19 |
| Namib Minerals |
| 5 | History |
| 5.1 | Exploration and ownership history |
The Property draws on over 60 years of exploration field activities and previous studies.
The HGM claims were first pegged as a greenfields discovery in July 1941. In August 1941, the claims were transferred to the Halo Syndicate, which changed the name to Halo Co. Ltd (Halo) in October 1943. Two quarries had been established by July 1944, with the southern quarry developed to a depth of 30 m. The accompanying processing facility had a 19-stamp battery. During the period 1950-1951, the mine was put on option to Goldfields Development Co. Ltd (Goldfields) [BMC 2023a].
Frobisher Ltd. (Frobisher) had an option on the mine in the period 1952-1953. In the same period, a diamond drilling program totalling 2,020 m was undertaken. This program indicated potential for a large tonnage operation, with an average grade of 4.90 grams per tonne (g/t) Au. The option was abandoned in 1953, effectively ceasing all processing operations. Ballarat Mines (Pvt) Ltd (Ballarat) took over the mine in June 1954 and sunk the main shaft between the two open pits (BMC 2023a).
The property was taken over by Lonrho Zimbabwe (Pvt) Ltd. (Lonrho) in 1973, first under the name of Rhodesian Gemstones (Pvt) Ltd. (Rhodesian), then Attica Mines (Pvt) Ltd. (Attica) and eventually Independence Mining (Pvt) Ltd. (Independence), in 1986. Since 1970, the mine has operated continuously and is one of the largest gold producers in the Matabeleland region. In October 2002, Lonrho relinquished ownership of Independence to Metallon (BMC Limited). In 2016, the name changed from How Mine to Bulawayo Mining Company (Pvt) Ltd (BMC) after the parent company. Metallon (BMC Limited) separated the group’s mines into standalone mining operations (BMC 2023a).
HGM is now wholly owned and operated through Namib Minerals, which acquired Bulawayo Mining Company Limited (BMC)—the long-standing operator of the mine—in 2025 from Greenstone Corporation. Following this transaction, Namib Minerals holds 100% indirect ownership of HGM, while BMC continues to function as the on-site operator under the new corporate structure.
The surface footprint of the mineral rights owned by Namib at the HGM covers an area of 2,408 ha. Isolated cases of illegal gold mining activities have been reported along some streams and historical workings located within the ML. The majority of artisanal mining activity is concentrated along the Mzingwane River, on the southern margins of the ML area (BMC 2023a).
| 5.2 | Production history |
Total gold produced from the HGM between 1941, and 2025 is approximately 1.84 million ounces (Moz).
| Project No PS229049 | WSP |
| How Mine | March 2026 |
| S-K 1300 Technical Report Summary | Page 20 |
| Namib Minerals |
Figure 5.1 presents total gold production from the HGM for the period 1941–2025.
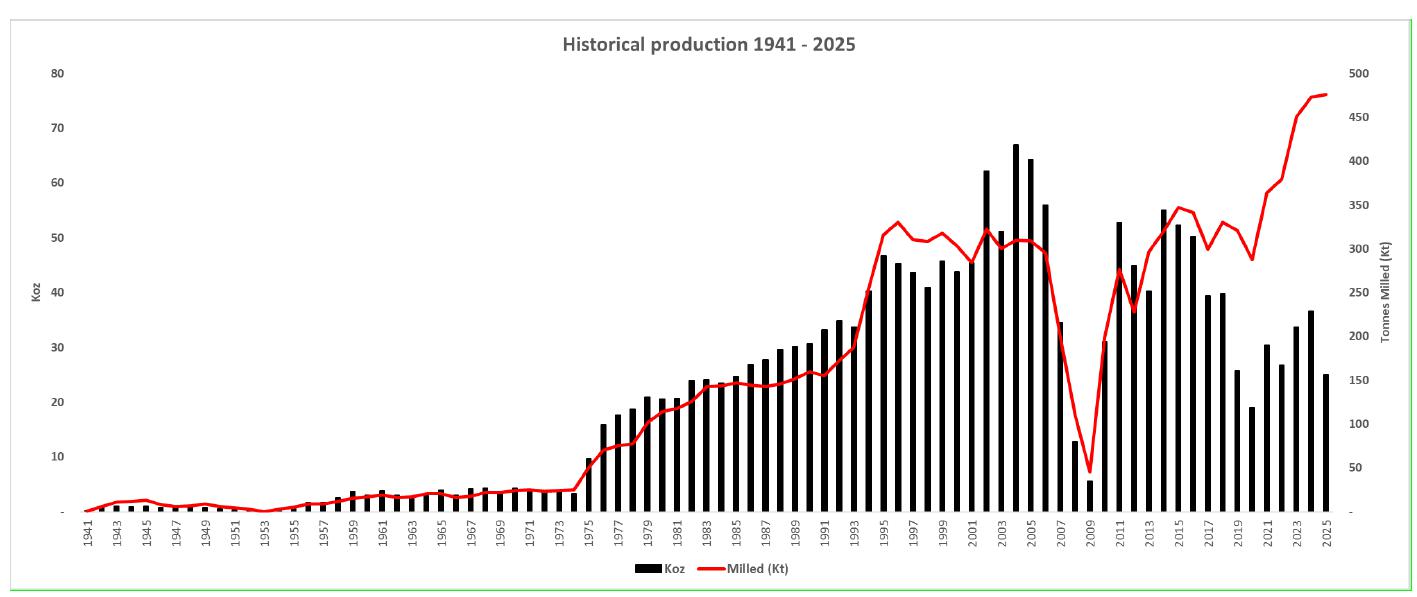
Figure 5.1 HGM total gold production 1941–2025
| Project No PS229049 | WSP |
| How Mine | March 2026 |
| S-K 1300 Technical Report Summary | Page 21 |
| Namib Minerals |
| 5.3 | Production reconciliation |
The Property’s MRMR as of the end of the 2025 and 2024 calendar years are compared in Table 5.1. WSP sourced the 2024 MRMR numbers from Metallon’s Mineral Reserves and Mineral Resources (MRMR) Estimates ( (Metallon Corporation, 2024).
Key variances between 2024 and 2025 are summarised as follows:
Mineral Resources
| — | Measured Resources: There has been a large increase in tonnes and ounces in Measured material due to an updated mineralisation domaining cut-off and a complete re-interpretation of the mineralisation to include the entire deposit, rather than small, discrete areas as was done in previous estimates. Due to the drop in reporting cut-off (where the MSO shapes were created using a 0.6 g/t Au cutoff), the grade of Measured material has dropped from 1.8 g/t Au to 1.3 g/t Au. |
| — | Indicated Resources: Similar to the commentary above on the changes in Measured inventory, the Indicated resource has significantly increased by 538% of overall ounces. The tonnage has increased significantly with a reduction in grade from 1.7 g/t Au to 1.4 g/t Au, reflecting the lower cut-off grade applied. |
| — | Inferred Resources: There has also been a very large increase in the Inferred Underground resource due to the re-interpretation process and the drop in reporting cut-off grade. The tonnes and ounces have increased dramatically with the grade dropping from 2.4 g/t Au to 2.1 g/t Au due to the lower cut-off grade applied to mining and in defining the mineralisation domains. The tailings material has remained steady. |
Mineral Reserves
| — | Total Underground: A 30% increase in Proved Reserves, and a 10% decrease in Probable Reserves, leading to a 10% increase in total gold ounces: |
| — | Proved Reserves tonnage increased by 120%, while grade reduced by 0.92 g/t, leading to a net increase of 30% in contained gold. The Proved Reserves change is driven by the updated block model and new stopes mainly below 30L. |
| — | Probable Reserves tonnage decreased by 17%, with an increase in grade of 0.07 g/t, to yield a 10% reduction in contained gold. The Probable Reserves change derives from the updated block model and a significant increase in Probable to Proved conversion. |
| — | Surface: No change to the No. 3 & 4 tailings dam (sands) Probable Reserve. |
Table 5-1 MRMR summary comparison end December 2024 to end December 2025
| Category | 31 December 2024 | 31 December 2025 | Var. (%) | |||||
| Tonnes (Mt) | Au Grade (g/t) | Au (koz) |
Tonnes (Mt) | Au Grade (g/t) | Au (koz) |
Au (koz) | ||
| Mineral Reserves | ||||||||
| Proved Mineral Reserves UG | 0.5 | 2.32 | 37 | 1.1 | 1.40 | 48 | 30% | |
| Probable Mineral Reserves UG | 0.6 | 1.63 | 31 | 0.5 | 1.70 | 28 | -10% | |
| Total Mineral Reserves UG | 1.1 | 1.91 | 68 | 1.6 | 1.50 | 76 | 12% | |
| No 3 & 4 Sands Dam – Probable Reserves | 0.8 | 0.89 | 26 | 0.8 | 0.89 | 26 | 0% | |
| Total Mineral Reserves | 1.9 | 1.46 | 94 | 2.4 | 1.29 | 103 | 10% | |
| Project No PS229049 | WSP |
| How Mine | March 2026 |
| S-K 1300 Technical Report Summary | Page 22 |
| Namib Minerals |
| Category | 31 December 2024 | 31 December 2025 | Var. (%) | |||||
| Tonnes (Mt) | Au Grade (g/t) | Au (koz) |
Tonnes (Mt) | Au Grade (g/t) | Au (koz) |
Au (koz) | ||
| Mineral Resources | ||||||||
| Measured Mineral Resources | 0.26 | 1.8 | 15 | 13.7 | 1.32 | 583 | 3,887% | |
| Indicated Mineral Resources | 1.58 | 1.7 | 86 | 10.2 | 1.41 | 463 | 538% | |
| Total M+I Mineral Resources | 1.84 | 1.7 | 101 | 23.9 | 1.36 | 1,046 | 1,036% | |
| Inferred Mineral Resources UG | 2.42 | 2.7 | 211 | 31.0 | 2.18 | 2,176 | 1,031% | |
| Inferred Mineral Resources – Tailings | 11.54 | 0.6 | 220 | 12.0 | 0.59 | 220 | 0% | |
| Total Mineral Resources | 17.79 | 1.05 | 532 | 66.9 | 1.60 | 3,442 | 647% | |
Notes: Numbers are rounded, Mineral Resources exclude Mineral Reserves, and Mineral Reserves are inclusive of dilution and ore loss. 2024 MROR Au grade was provided rounded to one decimal place.
| 5.4 | Aggregate fiscal year production |
Aggregate production over the past 5 years is provided in Table 5.2. Annual production has ramped up as shown.
Table 5-2 Aggregate calendar year production ending December 2021–2025
| Year | Process (Mt)
|
Au
Grade (g/t) |
Contained Au (Koz) | Process Recovery (%) |
Recovered Au (Koz) |
Variance % (Tonnage) |
Variance % (oz) |
| 2021 | 363.5 | 2.92 | 34.08 | 89.14 | 30.3 | 0% | 0% |
| 2022 | 379.5 | 2.45 | 29.86 | 89.65 | 26.7 | 4% | -12% |
| 2023 | 450.3 | 2.60 | 37.65 | 89.55 | 33.7 | 24% | 10% |
| 2024 | 473.0 | 2.66 | 40.51 | 90.44 | 36.6 | 0% | 11% |
| 2025 | 476.0 | 1.84 | 28.19 | 88.69 | 25.0 | -6% | -13% |
| Total | 2,142 | 2.47 | 170.29 | 89.49 | 152.3 | -5% | 6% |
| 5.5 | Exploration and development by previous owners or operators |
Previous exploration and development are discussed in Section 5.1.
| Project No PS229049 | WSP |
| How Mine | March 2026 |
| S-K 1300 Technical Report Summary | Page 23 |
| Namib Minerals |
| 6 | Geological setting, mineralisation, and deposit |
| 6.1 | Regional geology |
The HGM is located in the Umzingwane Formation of the Bulawayo Greenstone Belt (BGB). The Umzingwane Formation occupies an area broadly in the centre of an almost triangular shaped greenstone belt that tapers to the southeast, and links with the Filabusi Greenstone Belt (FGB) to the east (BMC 2023b).
Figure 6.1 presents a simplified regional geology map of Zimbabwe and the locations of major greenstone belts. The BGB is situated proximal to the city of Bulawayo.
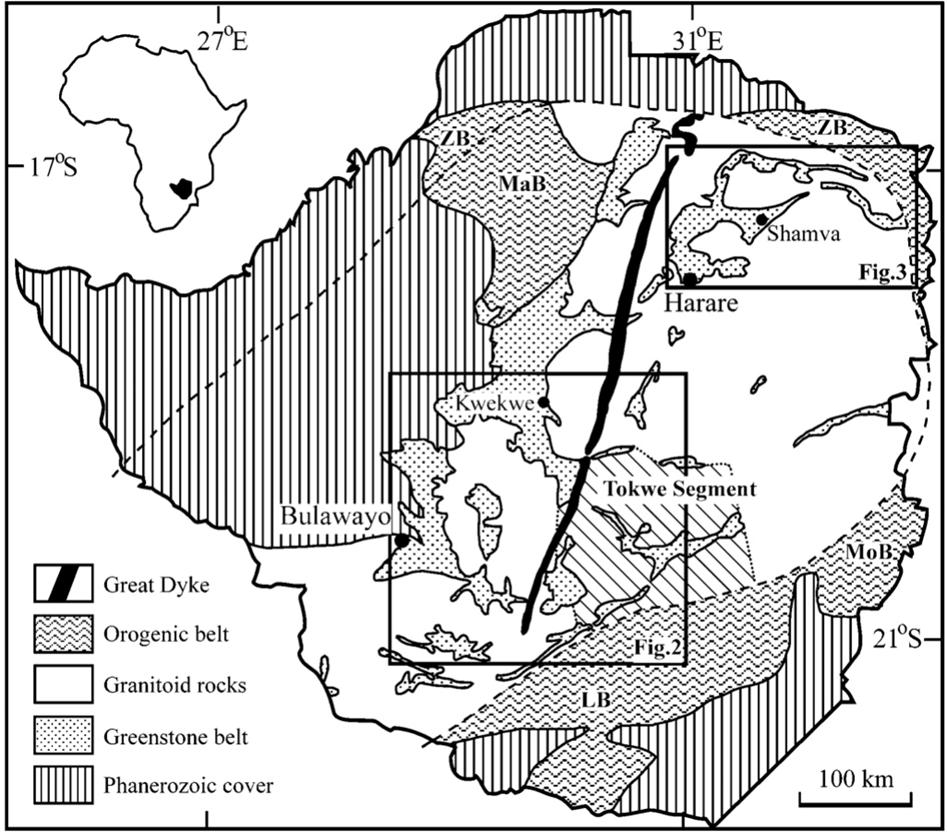
Figure 6.1 Regional geology of Zimbabwe showing location of Greenstone Belts (Prendergast 2004)
The lithological units characteristic of the Umzingwane Formation include clastic metasediments, fine-grained tuffaceous rocks, banded shales and siltstones, ferruginous cherts or Banded Iron Formation (BIF), and rhyodacites and andesitic lavas. This assemblage has been subjected to metamorphism of lower greenschist facies (BMC 2023b).
| Project No PS229049 | WSP |
| How Mine | March 2026 |
| S-K 1300 Technical Report Summary | Page 24 |
| Namib Minerals |
Figure 6.2 presents the regional geology of the HGM area.
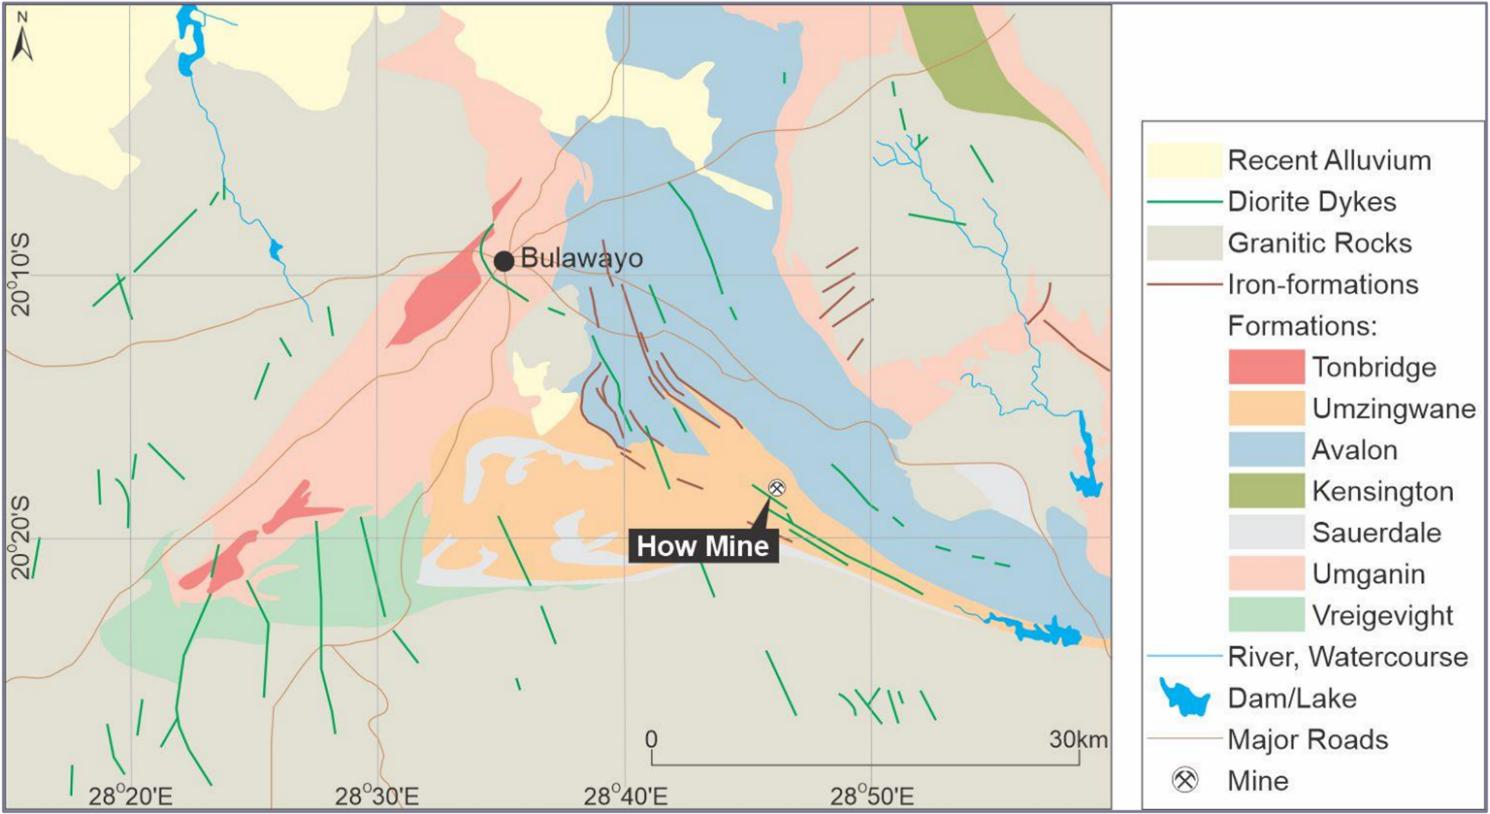
Figure 6.2 Regional geology of the HGM area (BMC Limited)
| 6.2 | Structural setting |
The setting of the volcaniclastic sediments is thought to be a rift-type basin, possibly fault bounded. Part of the deformation in the Upper Greenstones affecting the Umzingwane Formation is due to the intrusion of diapiric granites such as the Esigodini Granite to the east. The effects of this deformation phase were significant shortening, thrusting and shearing. Rocks within the Umzingwane Formation are strongly deformed, with shortening in the northeast-southwest direction and extension along a northwest-southeast axis. The How and Umzingwane shears are oriented in this direction (BMC 2023b).
| 6.3 | Local and Property geology |
The area around the HGM was geologically mapped in detail in 1976. This geological mapping work established a sequence of talc-chlorite schist, laminated black shale, silicate facies BIF, tuffaceous units and siltstone from southwest to northeast (BMC 2023b).
The occurrence of felsic porphyry intrusions and mafic dykes in local quarries is also expressed in exposures underground. The disposition of the quarries show that the ore channel locally transgresses lithological boundaries and is therefore not strictly stratabound (BMC 2023b).
| Project No PS229049 | WSP |
| How Mine | March 2026 |
| S-K 1300 Technical Report Summary | Page 25 |
| Namib Minerals |
Figure 6.3 presents the local geology of the HGM area.
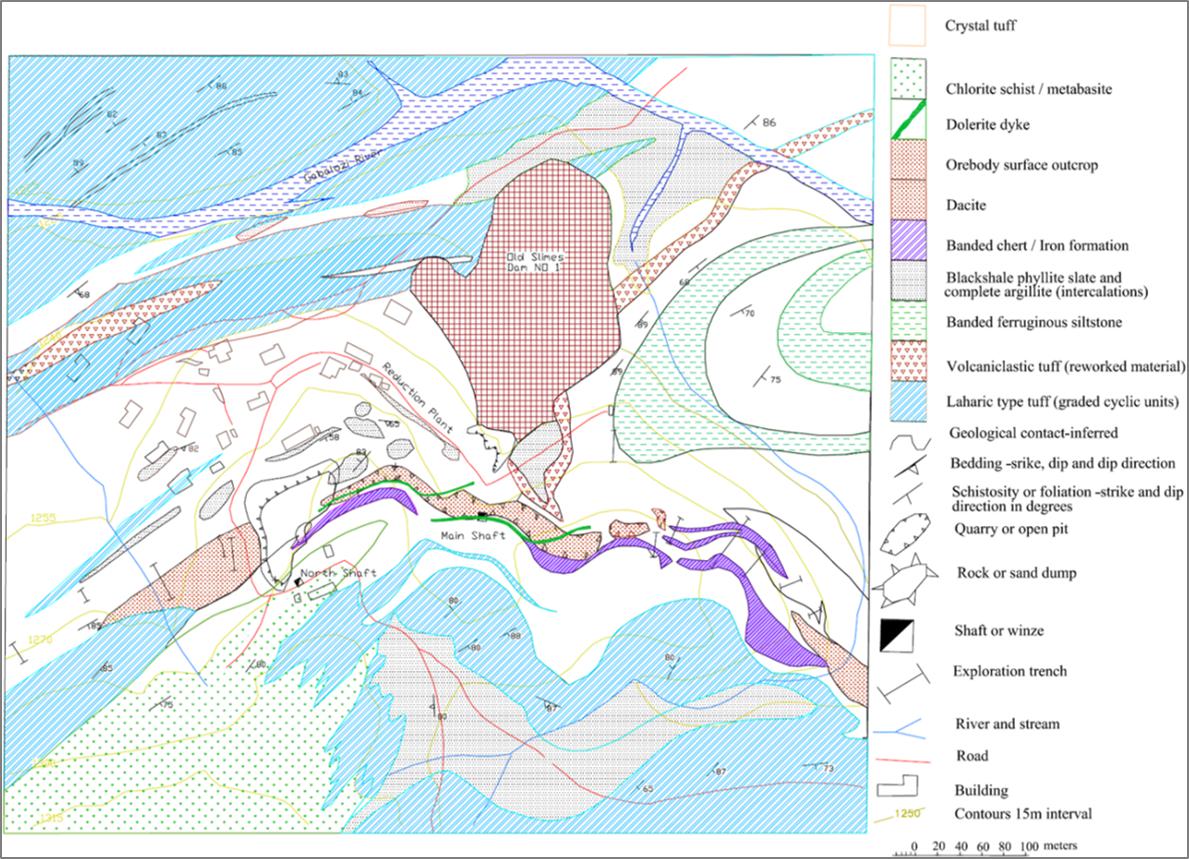
Figure 6.3 Local geology of the HGM area (BMC 2023b)
Figure 6.4 presents simplified stratigraphic columns for the Umzingwane Formation (which hosts the HGM), Avalon Formation, and Kensington Formation.
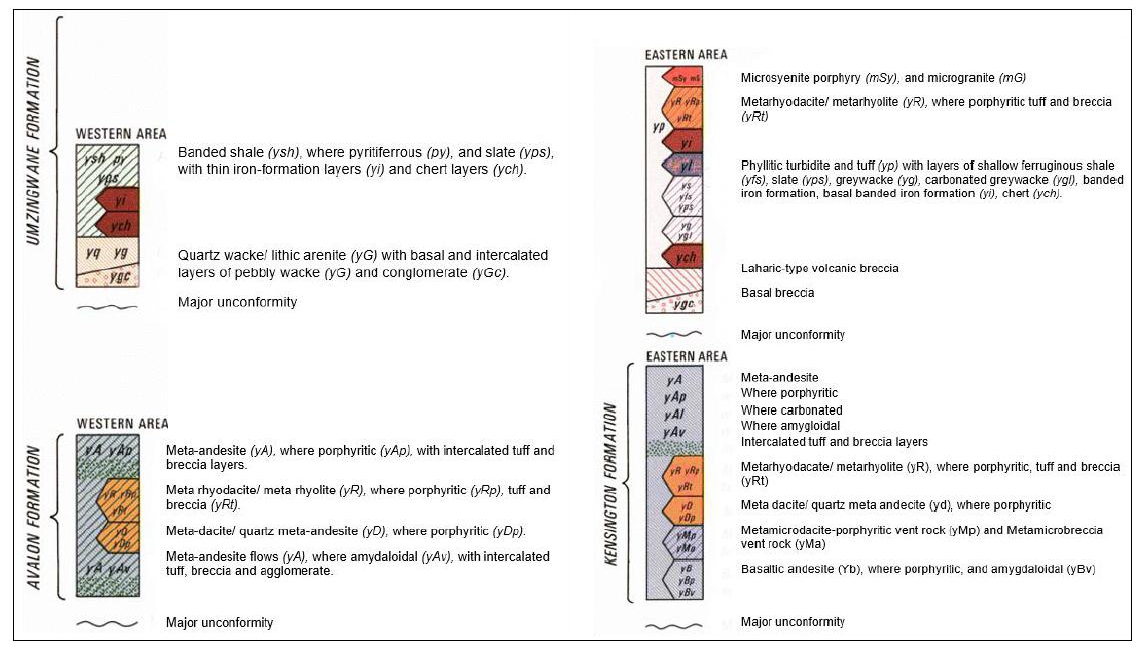
Figure 6.4 Simplified stratigraphic columns for the Umzingwane, Avalon, and Kensington formations (BMC Limited)
| Project No PS229049 | WSP |
| How Mine | March 2026 |
| S-K 1300 Technical Report Summary | Page 26 |
| Namib Minerals |
| 6.4 | Deposit type and geology |
The geological and structural information seen in the open pits provides some insight into the structural controls that are believed to be responsible for the localisation of mineralisation at the HGM. The main control is believed to be an extensional duplex, with a long axis oriented along the direction of extension (BMC 2023b).
Previous models suggesting that the ore was stratabound within felsites and was syngenetic in nature have now been disregarded due to the transgressive nature of the mineralisation. The felsites are in fact, propylitised tuffs. Prominent shears are evident on both the hangingwall and footwall contacts of the ore channel, and these represent the principal shears of the duplex system (BMC 2023b).
A new theory being tested suggests that the hangingwall contact of the dacite controlled mineralisation in the main orebodies on both strike and dip. This theory is evident when a composite plan of the mine is viewed. All development that continued into the hangingwall contact of the dacite, both north and south, does not contain significant mineralisation when compared to the main orebodies. However, there are some orebodies in the top section of the mine that are hosted in dacite. It appears that these orebodies are located at the central inflection point of the hangingwall dacite contact. This phenomenon is observed above the 16 Level. This theory is significant in terms of defining future exploration targets within the dacite hangingwall contact envelope and within the dacite itself and suggests the possibility of another “trouser leg” orebody plunging to the south (BMC 2023b).
| 6.5 | Mineralisation |
Orebodies are generally elliptical in plan, strike to the north, and dip steeply at approximately 80° to the west, with a steep northerly plunge. The major orebodies are the 300N, 180N, 350N, 400N, and 10S, which have a combined strike length of approximately 500 m. A low-grade parting separates the 300N and 180N orebodies, which becomes narrower at depth, and below the 20 Level is approximately 5 to 10 m in width.
Current information from deep diamond drilling indicates that the orebodies gradually taper in width with depth and become shallower in dip i.e. approximately 60°. The deposit shows significant hydrothermal alteration is frequently associated with sulphide mineralisation. Strong carbonation, silicification, and in extreme cases propylitisation occur together with sulphides. Pyrite is the dominant sulphide, with significantly less chalcopyrite and occasional pyrrhotite present. Chalcocite and arsenopyrite have also been reported. Ore microscopy has shown that gold is associated with a late generation of pyrite and chalcocite. The location of gold mineralisation is either in fractures within the sulphides or on sulphide grain surfaces (BMC 2023b).
Mineralisation at the HGM is thought to have been formed by hydrothermal solutions migrating along structurally controlled channels, predominantly caused by an extensional duplex, with its long axis parallel to the direction of extension. Recent underground exploration drilling between the 30 Level and 32 Level, has identified three new orebodies, namely 320N, 330N, and 360N, which are situated in the footwall of 300N and are hosted within the dacite, a completely different environment when compared to the other orebodies. (BMC 2023b).
While these orebodies appear as discrete mineralisation packages, referred to by the numeric orebodies (e.g. 300N), they are contained within a single low grade mineralisation halo.
| Project No PS229049 | WSP |
| How Mine | March 2026 |
| S-K 1300 Technical Report Summary | Page 27 |
| Namib Minerals |
Figure 6.5 presents a typical cross-section of ore zones within tuff.
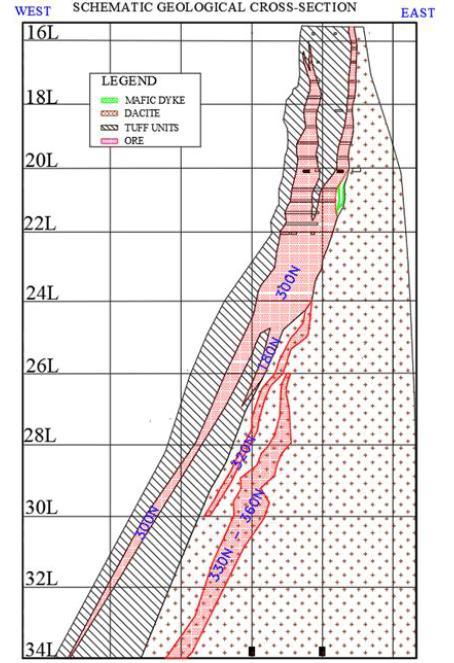
Figure 6.5 Typical cross-section of ore zones within tuff (Edelrod 2024)
| Project No PS229049 | WSP |
| How Mine | March 2026 |
| S-K 1300 Technical Report Summary | Page 28 |
| Namib Minerals |
| 7 | Exploration |
Exploration at the Property is based on detailed geological mapping that established the following sequence from southwest to northeast: talc-chlorite schist, laminated black shale, silicate facies BIF, tuffaceous units, and siltstone (Edelrod 2023).
The occurrence of felsic porphyry intrusions, and mafic dykes in historical quarries is also expressed in underground exposures. This shows that the mineralisation channel locally transgresses lithological boundaries and is therefore not strictly stratabound (Edelrod 2023).
Locally, a new theory is being tested which suggests that the hanging-wall contact of the dacite was a control on mineralisation of the main orebodies along strike and up and down dip. A plan view of the mine shows that all development that proceeded past the hanging-wall contact of the dacite (north and south) contains lower amounts of mineralisation when compared to the main orebodies. However, there are some orebodies in the top section of the mine that are hosted in dacite. Investigating the new theory is significant in terms of defining future exploration targets within the dacite hangingwall contact envelope, and within the dacite itself. This theory suggests the possibility of another “trouser leg” orebody plunging to the south (Edelrod 2023).
Channel sampling, diamond drilling, trench and sludge drilling samples were used for the purposes of geological modelling and Mineral Resource estimation.
| 7.1 | Diamond drilling |
Diamond drill core is logged and sampled at a nominal 1 m interval, depending on geology. Samples are taken to at least 5 m beyond the geologically defined mineralisation boundary in all drill holes. Core recovery averages >98% (BMC 2023b) and a visual review of core by the QP showed excellent recovery and few zones of broken core.
Core size is AXT (32.5 mm core diameter) and BQ (36.4 mm core diameter) for resource delineation, and exploration drill holes respectively (BMC 2023b).
Collars are surveyed using a Total Station. Downhole survey is conducted using a multishot digital downhole survey tool.
| Project No PS229049 | WSP |
| How Mine | March 2026 |
| S-K 1300 Technical Report Summary | Page 29 |
| Namib Minerals |
A long section view of all HGM diamond drill hole collars and existing mine development is provided in Figure 7.1.
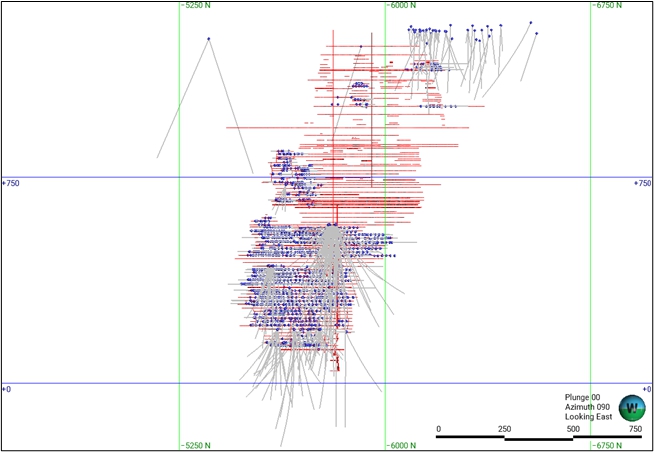
Figure 7.1 Long Section view, looking East of all HGM diamond drill hole collars, traces and existing mine development
| 7.1.1 | Exploration drilling 2025 |
The 2025 diamond drilling campaign at the How Mine formed the primary basis for updating the Mineral Resources in the deeper areas of the deposit. A total of 147 drill holes were completed for 8,216 m (Figure 7.2), distributed across the 13L, 17L, 18L, 30L, and 32L levels. Of the total drilled, 136 holes correspond to horizontal drill holes (resource delineation holes), with a combined length of 5,540 m, while the remaining holes are inclined drill holes totalling 2,676 m, which were drilled from the 30L level.
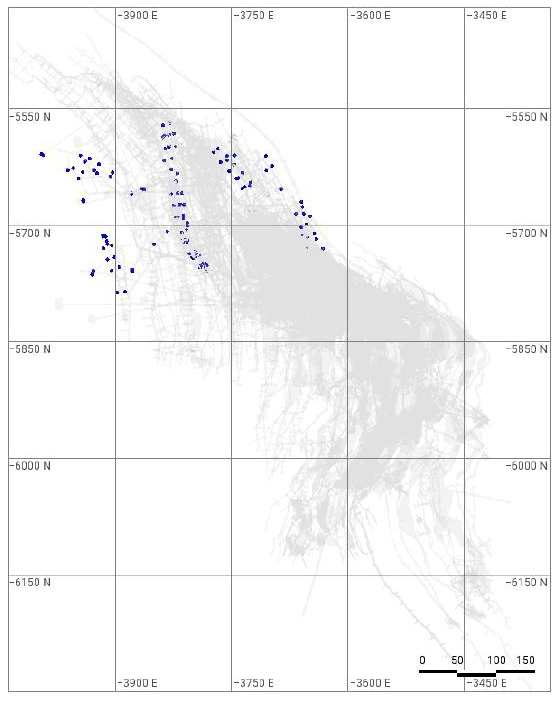 | 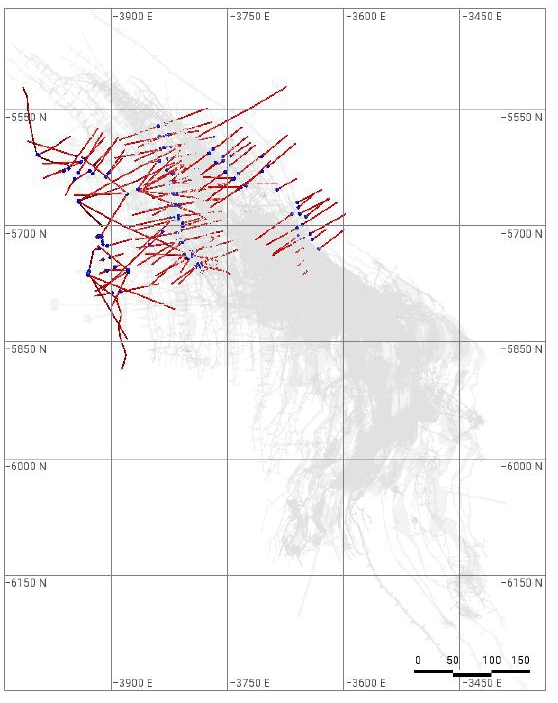 |
Figure 7.2 Plan view of 2025 drill hole collars (left) and traces (right), with existing mine development shown in grey
| Project No PS229049 | WSP |
| How Mine | March 2026 |
| S-K 1300 Technical Report Summary | Page 30 |
| Namib Minerals |
| 7.1.1.1 | 13L Drilling Plan (2025) |
Horizontal drilling targeted the 13L10m and 13Lev lift, where 4 drill holes were completed for a total of 165.3 m. The 13L (2025) drilling plan is presented in Figure 7.3.
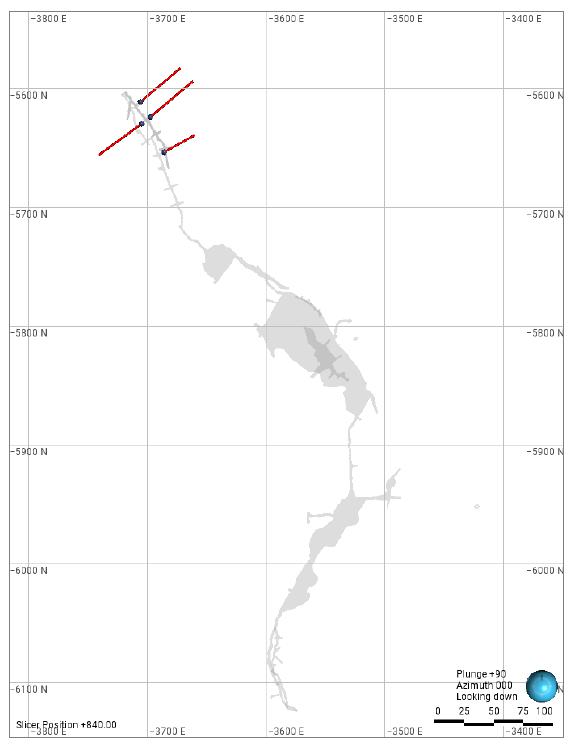
Figure 7.3 13L (2025) drilling plan
| Project No PS229049 | WSP |
| How Mine | March 2026 |
| S-K 1300 Technical Report Summary | Page 31 |
| Namib Minerals |
| 7.1.1.2 | 17L Drilling Plan (2025) |
Horizontal drilling targeted the 17L20m and 17Lev lift, where 19 drill holes were completed for a total of 739 m. The 17L (2025) drilling plan is presented in Figure 7.4.
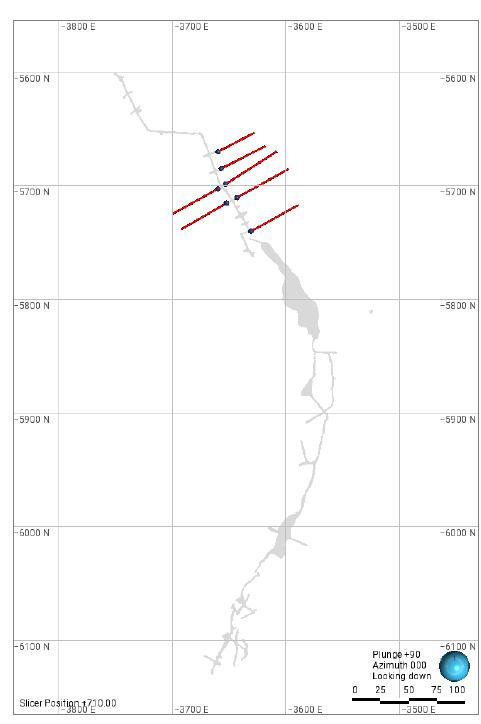 | 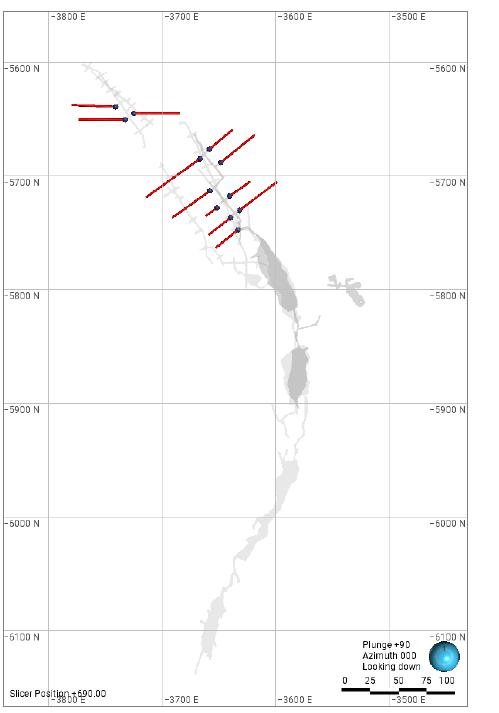 |
| Figure 7.4 | 17L (2025) drilling plan - 17L20m (left) and 17Lev (right) |
| Project No PS229049 | WSP |
| How Mine | March 2026 |
| S-K 1300 Technical Report Summary | Page 32 |
| Namib Minerals |
| 7.1.1.3 | 18L Drilling Plan (2025) |
Horizontal drilling targeted the 18L10m and 18L20m lift, where 12 drill holes were completed for a total of 476.1 m. The 18L (2025) drilling plan is presented in Figure 7.5.
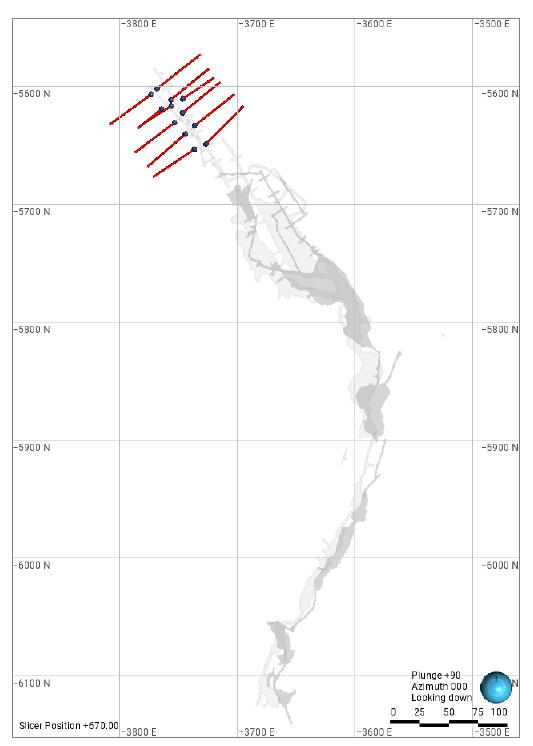
| Figure 7.5 | 18L (2025) drilling plan |
| Project No PS229049 | WSP |
| How Mine | March 2026 |
| S-K 1300 Technical Report Summary | Page 33 |
| Namib Minerals |
| 7.1.1.4 | 30L Drilling Plan (2025) |
Inclined drill holes were completed from the 30L lift, where 11 drill holes were drilled for a total of 2,676.7 m. The 30L (2025) drilling plan is presented in Figure 7.6.
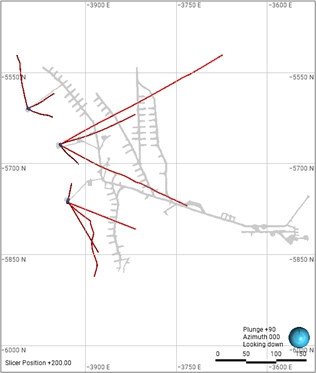 | 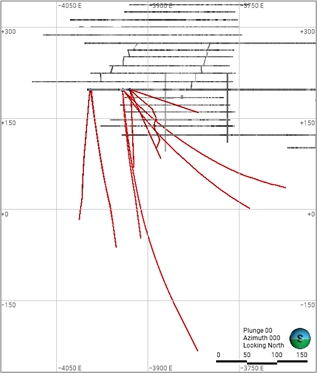 |
| Figure 7.6 | 30L (2025) drilling plan. Plan view (left) and section view (right) |
| Project No PS229049 | WSP |
| How Mine | March 2026 |
| S-K 1300 Technical Report Summary | Page 34 |
| Namib Minerals |
| 7.1.1.5 | 32L Drilling Plan (2025) |
Horizontal drilling targeted the 32L20m, 32L10m, and 32Lev lift, where 101 drill holes were completed for a total of 4,159.6 m. The 32L (2025) drilling plan is presented in Figure 7.7.
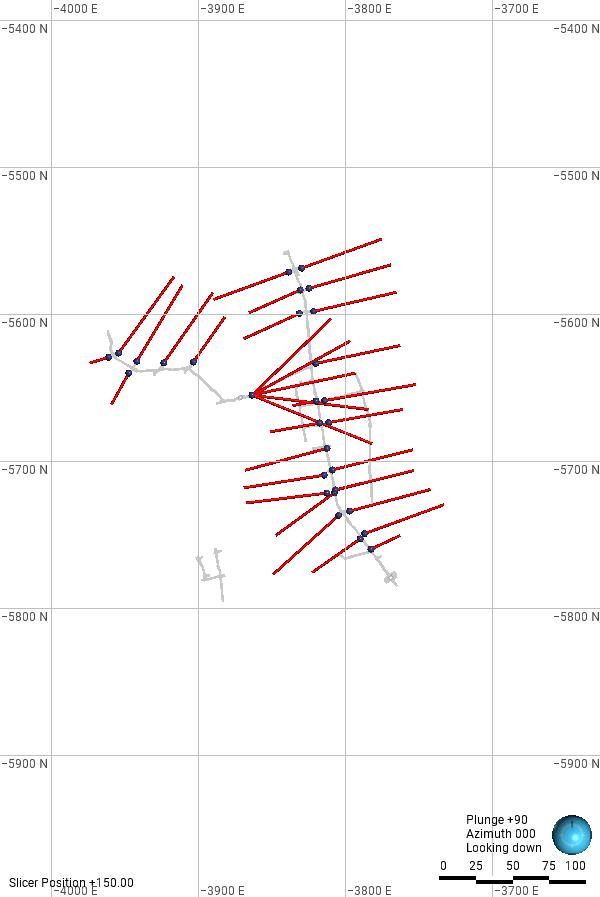 | 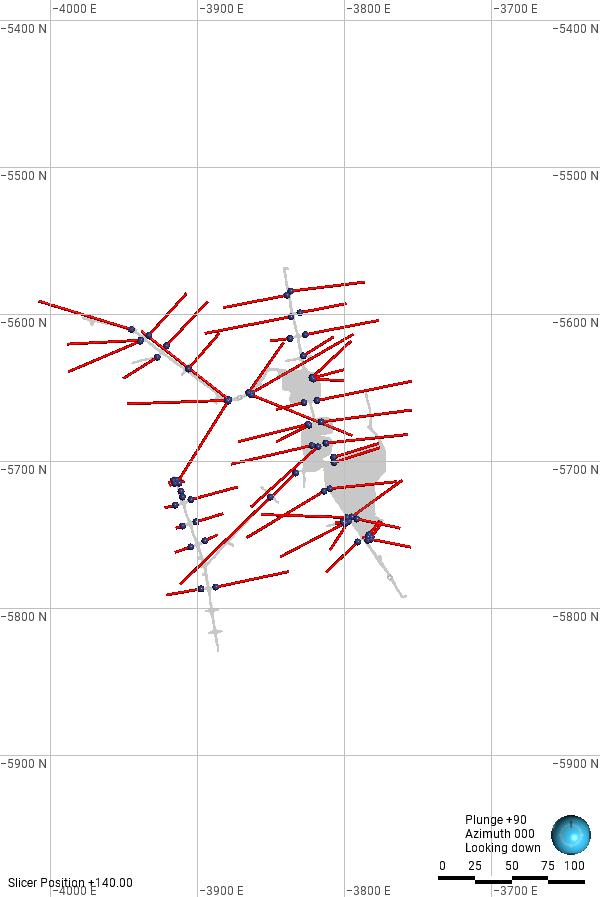 |
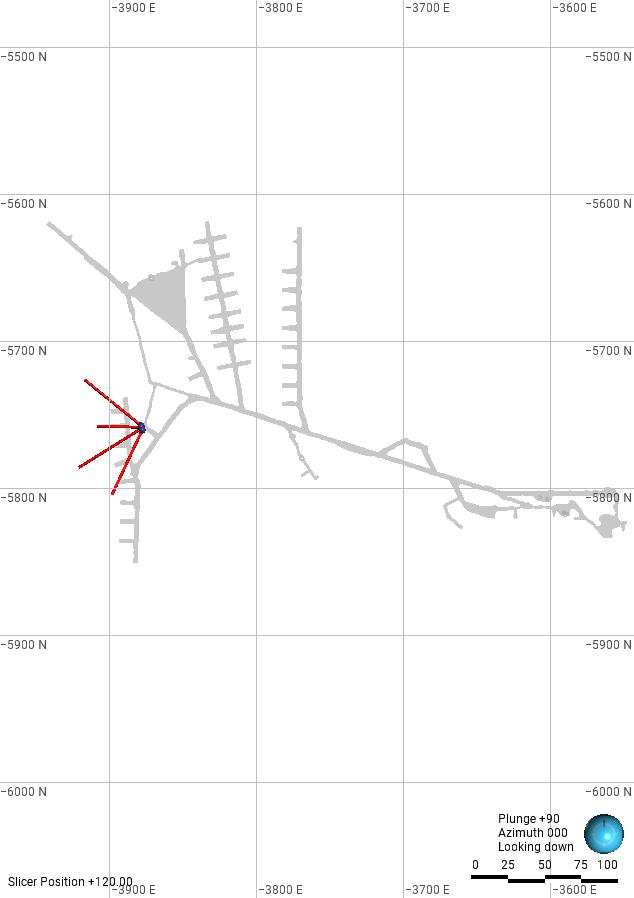
Figure 7.7 32L (2025) drilling plan - 32L20m (top left), 32L10m (top right), and 32Lev (bottom)
| Project No PS229049 | WSP |
| How Mine | March 2026 |
| S-K 1300 Technical Report Summary | Page 35 |
| Namib Minerals |
| 7.1.2 | Exploration drilling 2012-2023 |
Exploration holes drilled between 2012 to 2023 are summarised in the following section. All the hole collars were machine surveyed and downhole surveys were completed for determination of dip and azimuth deviations.
| 7.1.2.1 | 30L Drilling Plan (2021 -2023) |
Drilling targeting the 30L – 32L lift on the 300N, 320N, 360N and 400N orebodies. 19 holes totalling 5,596 m were drilled. The 30L (2021-2023) drilling plan is shown in Figure 7.8.
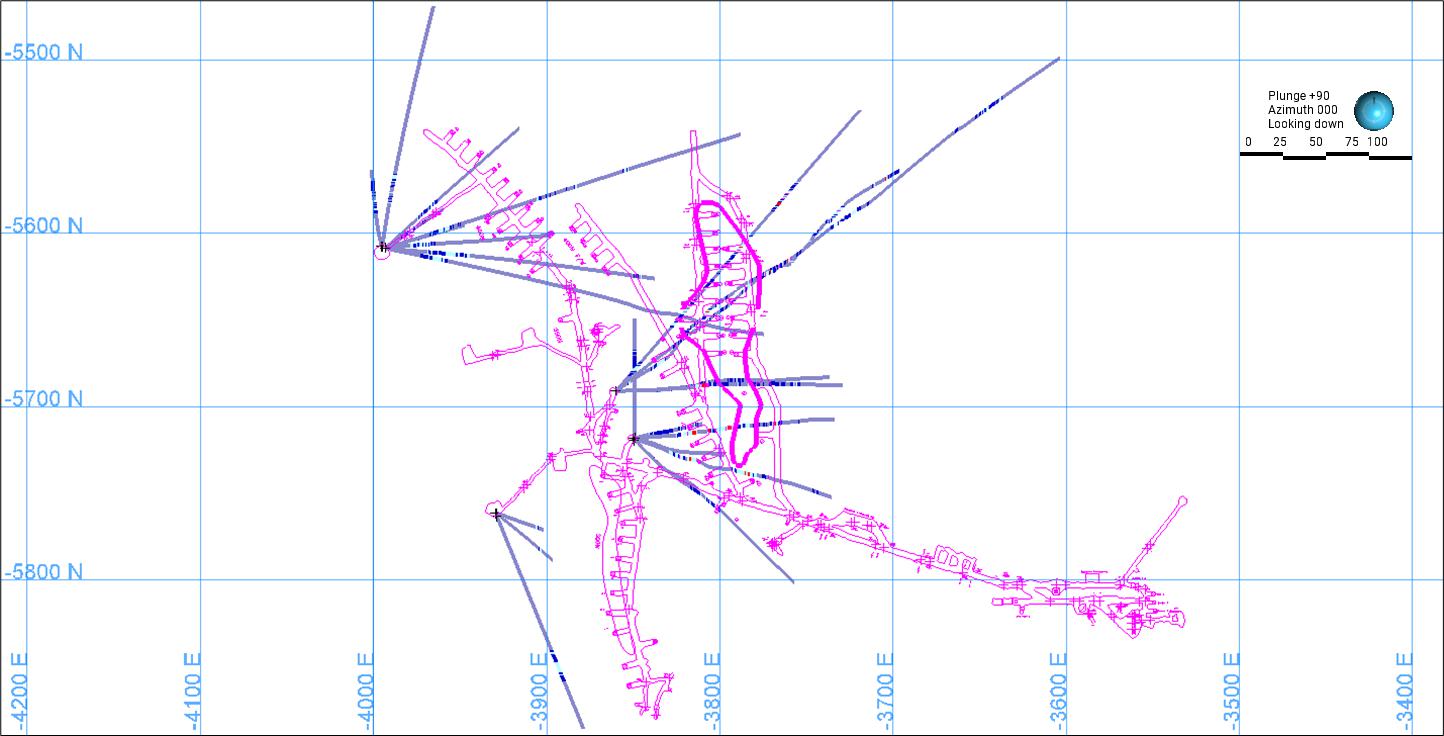
Figure 7.8 30L (2021–2023) drilling plan
| 7.1.2.2 | 24L Drilling Plan (2015–2016) |
Drilling was undertaken from two chambers on the 24L.
| — | In the 1st Chamber, 11 holes totalling 1,619 m were drilled targeting the 24L -26L lift of the 400N orebody. |
| — | In the 2nd Chamber, 9 holes totalling 2,276 m were drilled targeting the 26L – 28L lift the 400N orebody. |
| Project No PS229049 | WSP |
| How Mine | March 2026 |
| S-K 1300 Technical Report Summary | Page 36 |
| Namib Minerals |
The 24L (2015–2016) drilling plan is shown in Figure 7.9.
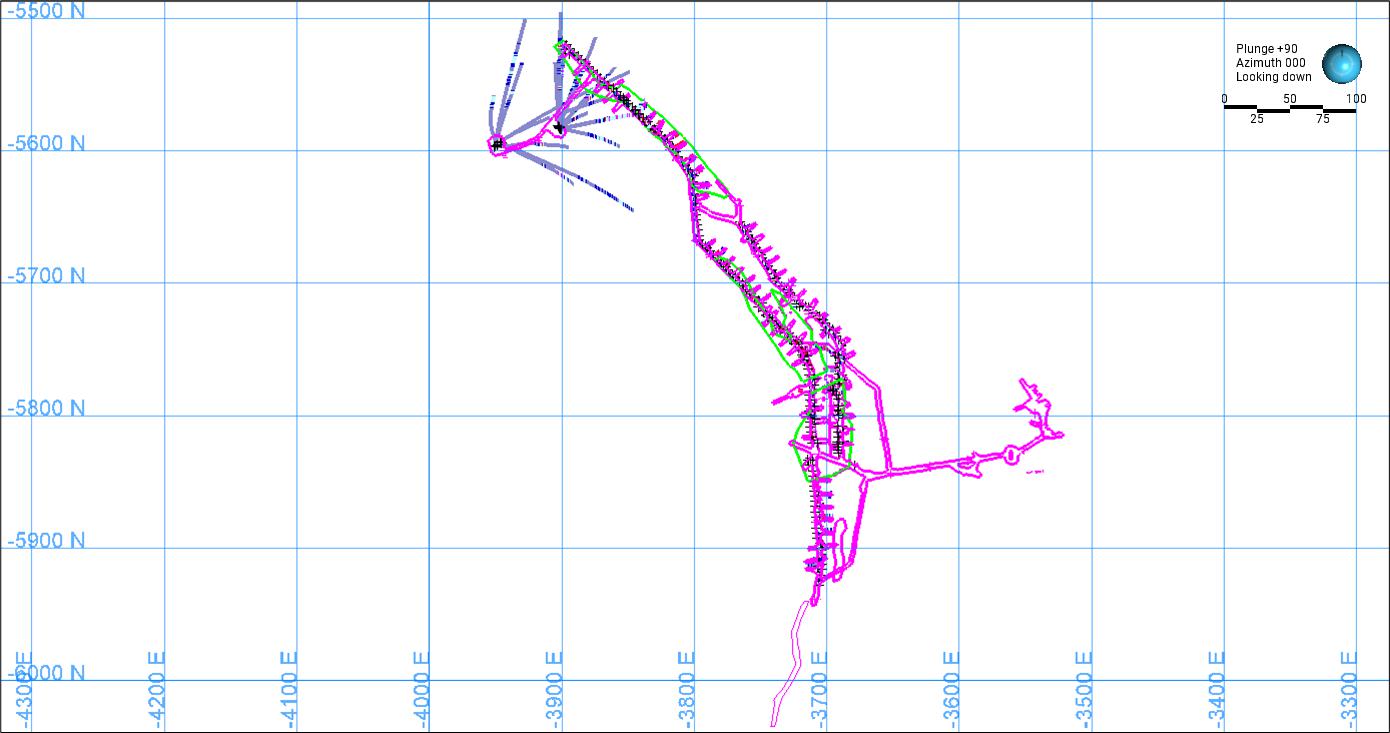
Figure 7.9 24L (2015–2016) drilling plan
| 7.1.2.3 | 26L Drilling Plan (2012–2013) |
Drilling was undertaken from the 1st chamber where 4 holes totalling 1,173 m were drilled targeting the 28L to 30L lift the 300N orebody.
The 26L (2012–2013) drilling plan is shown in Figure 7.10.
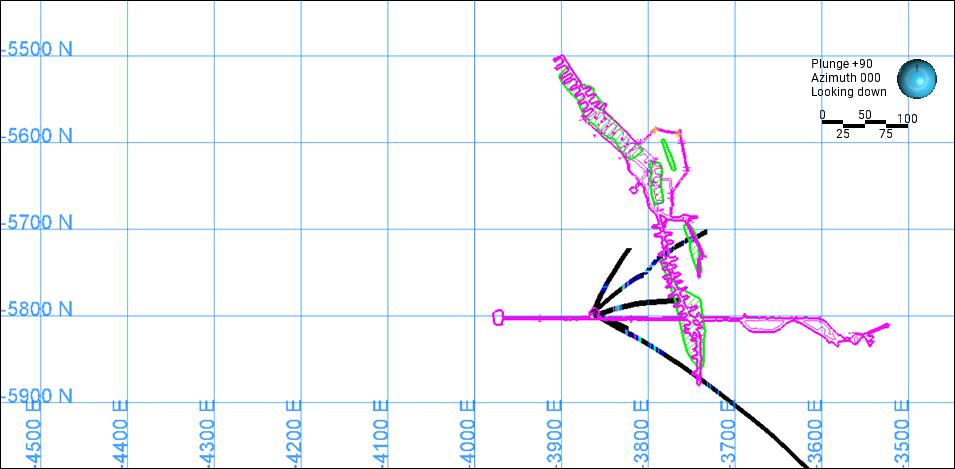
Figure 7.10 26L (2012–2013) drilling plan
| Project No PS229049 | WSP |
| How Mine | March 2026 |
| S-K 1300 Technical Report Summary | Page 37 |
| Namib Minerals |
| 7.2 | Sludge drilling |
Sludge drilling was formerly used for resource evaluation purposes. Sludge drill holes were sampled on 1 m intervals. Historical sludge drilling results remain in the resource database for mineralisation areas on or above the 20 Level. Sludge drilling has been phased out entirely due to questionable reliability. All evaluation below the 20 Level is based on diamond core and channel sampling only (BMC 2023b). Sludge samples have been included in the estimate due to them being the only available data in certain parts of the mine. Where there is no diamond drilling present and the estimate relies on the presence of sludge drilling, the Mineral Resource estimate has been classified as Inferred.
| 7.3 | QP’s opinion |
The QP considers the data collected including method of collection and storage to be appropriate for the preparation of geological models and Mineral Resources estimates, and that the data type and quality have been considered during resource classification.
| Project No PS229049 | WSP |
| How Mine | March 2026 |
| S-K 1300 Technical Report Summary | Page 38 |
| Namib Minerals |
| 8 | Sample preparation, analyses, and security |
| 8.1 | Sampling techniques |
The following types of samples are taken at the HGM and used to inform the Mineral Resource estimate:
| 8.1.1 | Core sampling |
The entire drill hole is sampled in the case of resource delineation drill holes, while only mineralised zones are sampled in the case of exploration drill holes as well as 5 m either side. For exploration drill holes, core is halved using a core splitter in the core shed. Half core is sampled and assayed, while the other half is archived.
Current practice is that half core and pulps from exploration drill holes are securely stored and only discarded after mining through the areas where drilling was completed.
| 8.1.2 | Channel sampling |
Channel sampling is undertaken using a pneumatic diamond-saw, to cut a 10 mm deep and 30 mm wide channel in the backs of development drives, or sidewalls of crosscuts. Channels are taken at 2 m intervals (and at 4 m intervals below the 22 Level) in the backs of development drives, and along sidewalls of crosscuts. The nominal sample length is 1 m; however, may be smaller to allow for variations in geology, apparent mineralisation, or excavation dimensions. The sampling interval was increased from 2 m to 4 m below the 22 Level following a variography study that demonstrated no material change to the definition of the deposit.
| 8.1.3 | Sample security |
Samples are collected and transported to the surface by an appointed sampler. Upon arrival on surface at the main shaft, the sampler is escorted by mine security to the secure on-site assay laboratory.
| 8.2 | Dry bulk density determination |
Dry bulk density (BD) determinations are completed at the on-site assay laboratory on selected diamond drill core samples. Previously, the geology technicians completed bulk density determinations. These determinations have indicated that there are only subtle variations between, or within orebodies. No clear relationship has been established between gold grade, and BD e.g., some waste material samples possess a higher value than ore.
Scientific Investments (now known as Duration Gold Limited [DGL]), a commercial analytical laboratory located in Bulawayo, initially completed a total of 105 BD determinations on core samples, and obtained a mean value of 2.8 g/cm³. This result was used to benchmark the accuracy of the in-house determinations completed which average less than 2.8 g/cm3. WSP recommend additional commercial laboratory samples are completed to allow application of different density values across the lithologies.
| 8.3 | Sample preparation, analysis, and procedures |
The on-site assay laboratory processes all samples collected from resource delineation diamond drilling, channel and face samples, draw-point grab samples, and processing plant samples.
Whole dried samples are crushed to -2 mm, riffle split to 500 g and pulverised in a Keegor Vertical Spindle pulveriser to 80% passing -75 micrometres (μm).
| Project No PS229049 | WSP |
| How Mine | March 2026 |
| S-K 1300 Technical Report Summary | Page 39 |
| Namib Minerals |
Approximately 4,000 samples are assayed each month. All samples are fire assayed with a gravimetric finish. The sample aliquot is 50 grams (g) for channel and drill core samples. Blanks and Certified Reference Material (CRM) samples are introduced at a rate of 2 samples for every 16 samples assayed. Repeat samples are also sent to the on-site assay laboratory on a regular basis. An assay repeats register is kept in the Geology Department for monitoring laboratory performance.
Exploration drill core samples from are sent to an external accredited laboratory (Antech, located in Kwekwe approximately 250 km from the HGM) for assaying. For every 16 pulp samples dispatched, two CRM samples are incorporated into the sample batch for Quality Assurance Quality Control (QAQC) purposes. Repeat samples of pulps to monitor precision are completed on mineralised intersections only.
Records of all samples collected and sent for assay are systematically kept in various ways that have an in-built back-up system. All samples collected underground have their details captured in a field logbook, from which they are transferred to daily return sheets and on-site assay laboratory submission/report sheets. These records are filed separately. For drill core assay results, records are captured in logbooks, log sheets, and computer and assay report sheets. Remaining sample pulp from exploration drill core samples is returned and kept in the sample library on site.
| 8.4 | Quality Assurance Quality Control |
The following QAQC procedures are used at the HGM:
| 8.4.1 | Channel sampling |
For channel samples, a CRM sample is inserted into each sample batch. The CRM’s are created using HGM material, ensuring matrix matched standards are used. CRM results are tested for compliance to set tolerance ranges, equal to two standard deviations from the designated mean value. No blanks are included in the channel sampling batches.
Any assay batches which contain standards which are outside of these tolerance ranges are re-assayed in their entirety. Data is subjected to analyses by scatter and regression plots.
WSP recommends introducing a blank into each sample batch and monitoring QAQC results on a monthly basis.
| 8.4.2 | Core sampling |
For core samples, a CRM sample is inserted every 14 samples. In some cases, a second CRM is inserted every 14 samples as well or alternatively, a duplicate is included.
Any assay batches which contain standards which are outside of these tolerance ranges are re-assayed in their entirety. Data is subjected to analyses by scatter and regression plots.
| 8.4.3 | 2025 QAQC results |
During 2025, Namib inserted a high-grade standard which changed ranged from an accepted value of 1.7g/t Au to 2.7 g/t Au. Three different high-grade standards were used over the year, and the graph is shown in Figure 8.1. The performance of the standards is considered acceptable. The standards were created for Namib using their own material and certified which ensures the matrix matches with typical HGM mineralisation. The values of the standards created change over time to align with current average mining grades.
| Project No PS229049 | WSP |
| How Mine | March 2026 |
| S-K 1300 Technical Report Summary | Page 40 |
| Namib Minerals |
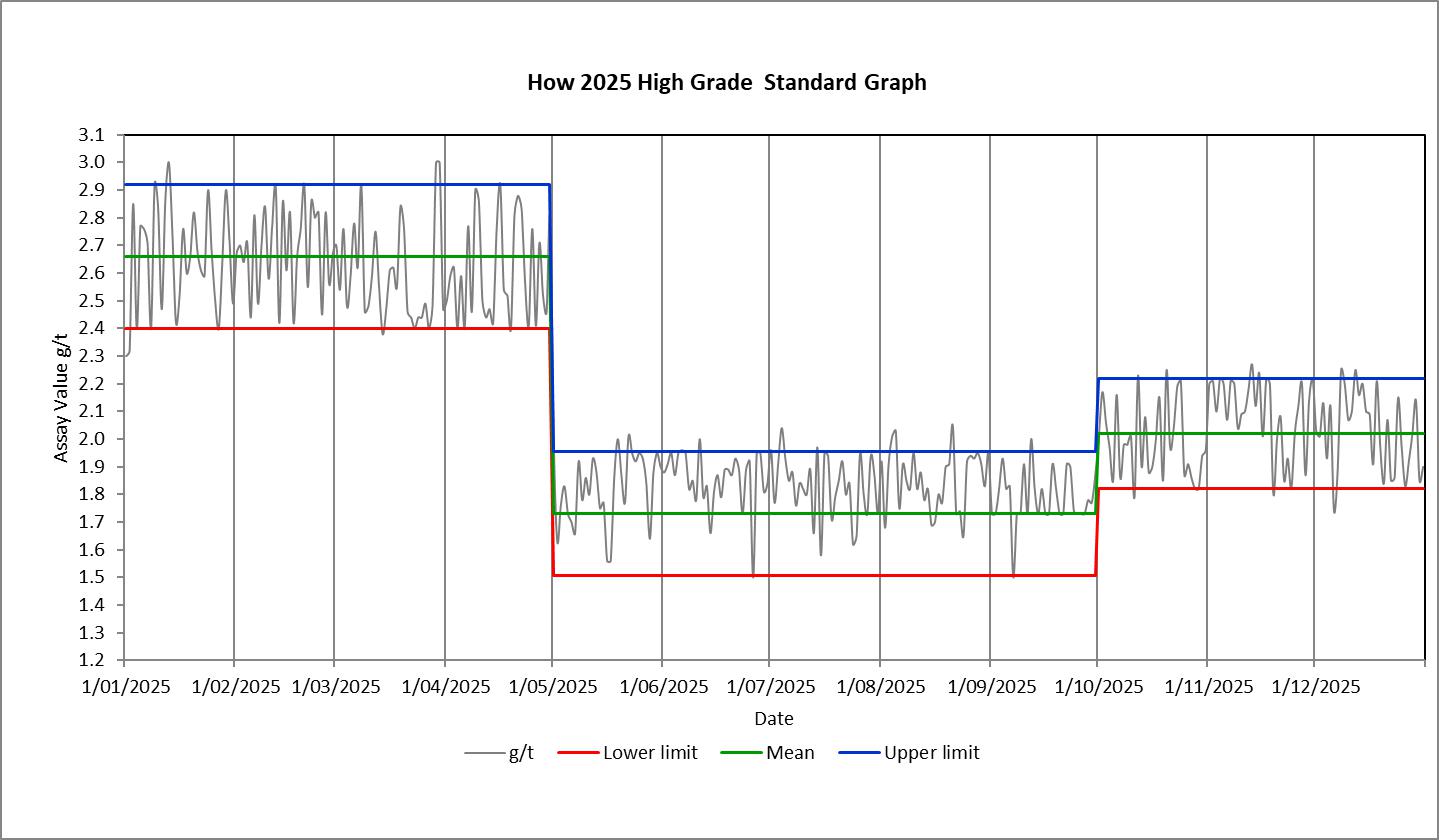
Figure 8.1 2025 Standard performance – high-grade standard
In addition to the high-grade standard, Namib also inserted a lower-grade standard which ranged in accepted value from 0.22 g/t Au to 0.38 g/t Au, the results of which are presented in Figure 8.2.
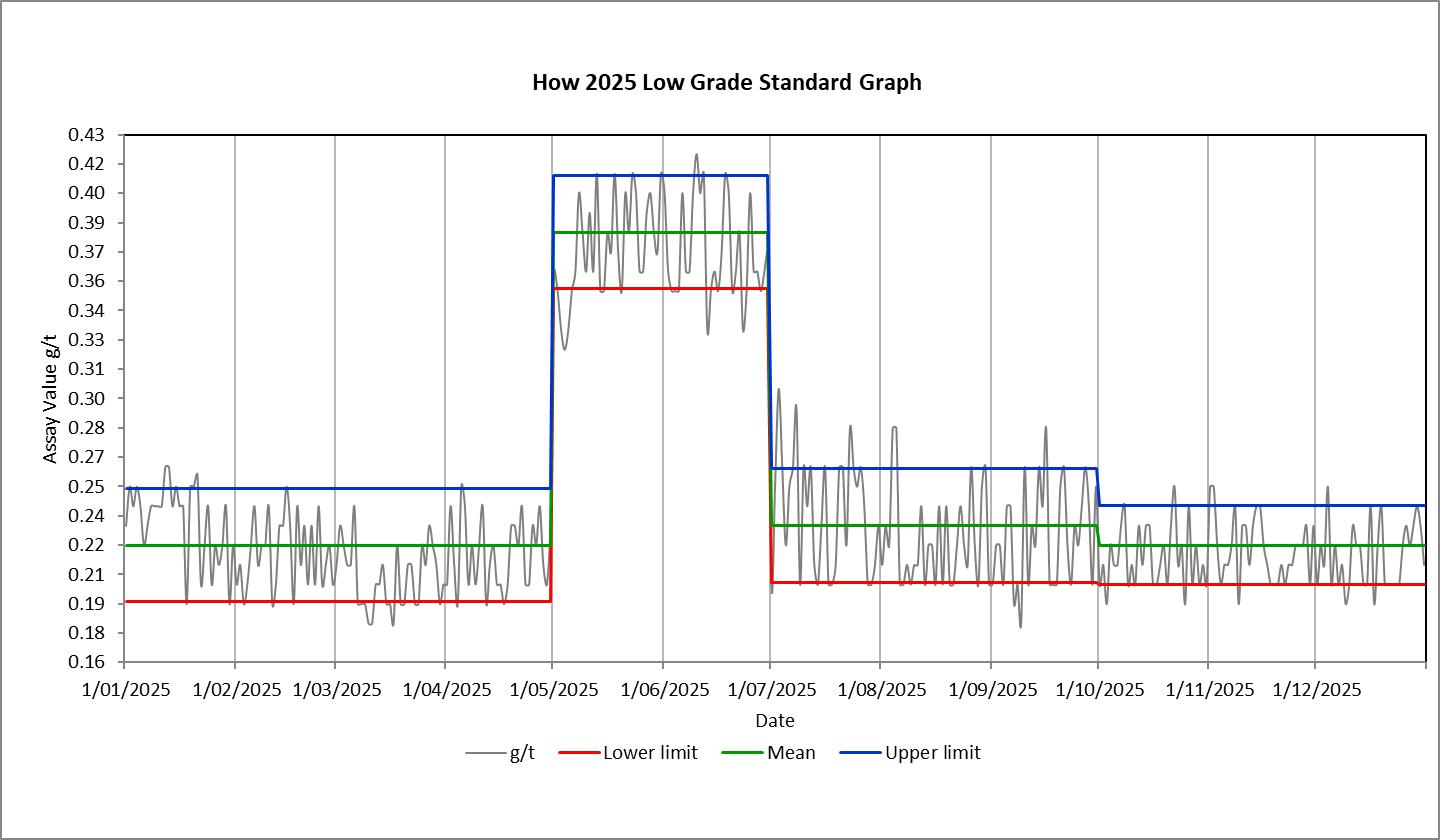
Figure 8.2 2025 Standard performance – low-grade standard
| Project No PS229049 | WSP |
| How Mine | March 2026 |
| S-K 1300 Technical Report Summary | Page 41 |
| Namib Minerals |
The on-site laboratory also sends off umpire samples to three external laboratories each month. Two of these laboratories are site laboratories located at the nearby Turk Mine (approximately 85 km north of the HGM) and at the Renco Mine (approximately 375 km east of the HGM) with one being a commercial laboratory (Performance Laboratories, located in Ruwa, 485 km northeast of the HGM). The results for January 2026 are shown in Figure 8.3 and show the How laboratory is reporting approximately 5% higher compared to the Turk Mine laboratory, 11% lower than the Renco Mine laboratory and 3% higher than the Performance Laboratory. Overall this suggests that the How on-site laboratory performs well compared to the other laboratories, particularly well with the commercial laboratory.
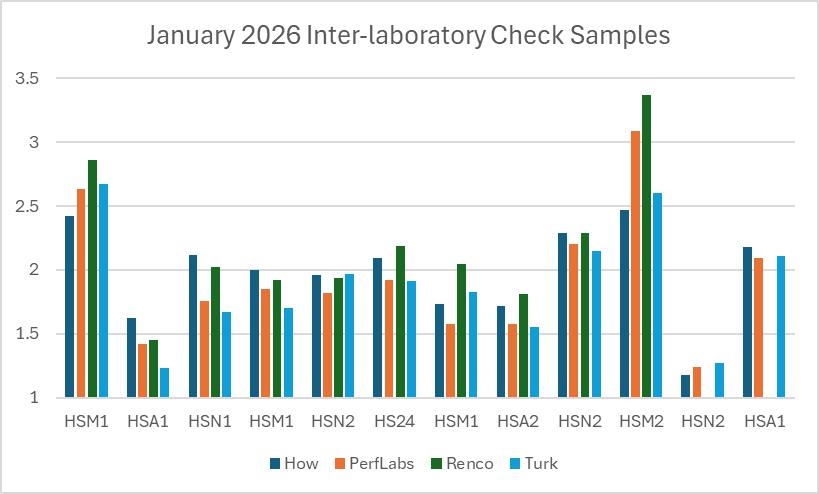
Figure 8.3 January 2026 Inter-laboratory Check Sample Results
| 8.5 | Bulk density |
Namib provided a total of 250 recent density measurements taken from diamond drill core and draw points as well as almost 4000 samples taken between 2007 and 2016. Previously, an assigned density of 2.8 g/cm3 has been used which aligns with the average density measurements received from 105 diamond drill core samples tested at an external laboratory (Scientific Investments) in 2000. Results do not suggest a clear correlation between density and grade. For the purpose of this estimate, a constant density of 2.8 g/cm3 has been utilised, consistent with previous estimates, however further analysis is recommended to inform future estimates.
Table 8-1 Summary of density samples taken between 2007 and 2016.
| Lithology | Number of Samples | Mean Density (g/cm3) | Mean Gold Grade |
| AGM | 1241 | 2.74 | 1.04 |
| DSH | 601 | 2.75 | 0.97 |
| CHT | 58 | 2.66 | 0.68 |
| CTF | 816 | 2.77 | 0.96 |
| DIO | 165 | 2.69 | 0.57 |
| DOL | 66 | 2.71 | 0.58 |
| LTF | 326 | 2.75 | 0.81 |
| MDK | 100 | 2.66 | 0.37 |
| MTF | 453 | 2.77 | 1.05 |
| TFF | 119 | 2.68 | 0.65 |
| Total | 3945 | 2.75 | 0.93 |
WSP recommends further review of density by domain and by lithology type to confirm the existing assumptions and a review of the density measurement process in addition to further analyses completed at the external laboratory.
| 8.6 | QP’s opinion on adequacy |
The QP considers the sample preparation, analyses, QAQC, and security protocols used at the Property to be appropriate in regard to the data used in the preparation of Mineral Resources estimates, and that the data has been considered during resource classification.
| Project No PS229049 | WSP |
| How Mine | March 2026 |
| S-K 1300 Technical Report Summary | Page 42 |
| Namib Minerals |
| 9 | Data verification |
| 9.1 | Mineral Resources data verification |
| 9.1.1 | Data verification conducted by BMC Zimbabwe |
Data validation conducted by BMC Zimbabwe was completed using Microsoft Excel, inbuilt Vulcan™ software validation tools, physical checks, and correction of any erroneous input data to ensure completeness, and integrity of captured data. Transcription errors were checked, identified, and corrected through direct comparison of captured data with data sources such as assay plans, and diamond drill core log sheets. Drill hole collar locations and elevations were inspected, verified and corrected in Vulcan™. Recently, on site geologists have started using Leapfrog software to assist with data verification activities.
| 9.1.2 | Data verification conducted by WSP |
The QP has validated the following geological and Mineral Resources estimation data:
| — | Drill hole collar locations |
| — | Drill hole downhole surveys |
| — | Drill hole assays |
| — | As built wireframes |
Some errors were identified in drill hole locations, surveys and as built wireframes which were discussed with site personnel and adjusted where necessary.
| 9.1.3 | Limitations on Mineral Resources data verification |
The QP was not directly involved in the exploration drilling, and sampling programs that formed the basis for collecting the data used in the geological modelling, and Mineral Resources estimation for the Property; however, the QP was able to observe drilling, sampling, and sample preparation methods at the HGM during the personal inspection (Section 2.4) and visited the on-site laboratory.
The QP is not aware of any other limitations on, nor failure to conduct appropriate data verification.
The QP has validated the data presented in Section 9.1, including collar survey, downhole geological data and observations, sampling, analytical, and other test data underlying the information or opinions contained in the written disclosure presented in this TRS. The QP has presented information relating to uncertainty in the estimates of Inferred, Indicated, and Measured Mineral Resources (Section 11.14), and opinions on factors likely to influence the prospect of economic extraction. A comprehensive list of Mineral Resources interpretations and conclusions, and Mineral Resources recommendations have also been presented in Sections 22.1 and 23.1 respectively.
Notwithstanding these matters, the QP considers the data used is acceptable for the purposes of geological modelling and Mineral Resources estimation.
| 9.2 | Mining and Mineral Reserves data verification |
WSP utilised the updated 2025 block model, and 2025 Mineral Resource as the basis for the Mineral Reserve:
| — | The supplied site BF, APF and BCF factors were also reviewed prior to use. |
| Project No PS229049 | WSP |
| How Mine | March 2026 |
| S-K 1300 Technical Report Summary | Page 43 |
| Namib Minerals |
The HGM financial model, used as the basis of the COG and pay limit calculations, as well as the economic analysis for the Mineral Reserve only Life of Mine Plan (LOMP) was also reviewed and deemed suitable for use in the Mineral Reserve estimate.
The supplied mine design data including the 2024 Mineral Reserves and the supplied as-built development and current (December 2025) mined stoping solids were reviewed and deemed suitable for the Mineral Reserve estimate.
The QP considers the data suitable for the purposes of preparing the mine design, mine schedule, and Mineral Reserves estimate.
| 9.3 | Geotechnical data verification |
WSP was not able to review a copy of the current HGM GCMP but has reviewed the supplied geotechnical Code of Practice (BEMS-TS-RM-COP-01.pdf), and all supplied data and the QP believes the data is adequate for the purposes for which it is used for in this TRS.
Please note: WSP was previously, in 2024, provided with the HGM geotechnical database (BMC_Geotechnical Database.xlsx) which contained Rock Mass Rating (RMR) data for a total of 648 drill holes, and scans of HGM in-situ Geomechanics classification logging sheets for a total of 44 drill holes. WSP compared the database with the logging sheets and found that a total of 33 drill holes and RMR data matched between the datasets. The remaining 11 drill holes presented in the logging sheet scans could not be identified. No additional work has been undertaken by WSP regarding this during the compilation of the TRS.
| 9.4 | Hydrology and hydrogeology data verification |
HGM commissioned a Hydrogeological assessment in 2024 following a period of drought. The operation requires 55,000m3 of water per month for ore processing. Typically, the water is sourced from surface water dams. The report identified 18 feasible drill sites to source water across site. The drilling program was later completed, providing sufficient water supplementation to get through the 2024 drought. The water level of the How Dam is at 100% at the time of this report being published, and the Chimedza dam is at 25% capacity.
The HGM is located in Matabeleland South Province, Esigodini in the Upper Mzingwane sub-catchment of the Mzingwane Catchment. Figure 9.1 shows the various Zimbabwe catchments, and Figure 9.2 shows the sub-catchments of the Mzingwane Catchment (BMC 2023a).
| Project No PS229049 | WSP |
| How Mine | March 2026 |
| S-K 1300 Technical Report Summary | Page 44 |
| Namib Minerals |
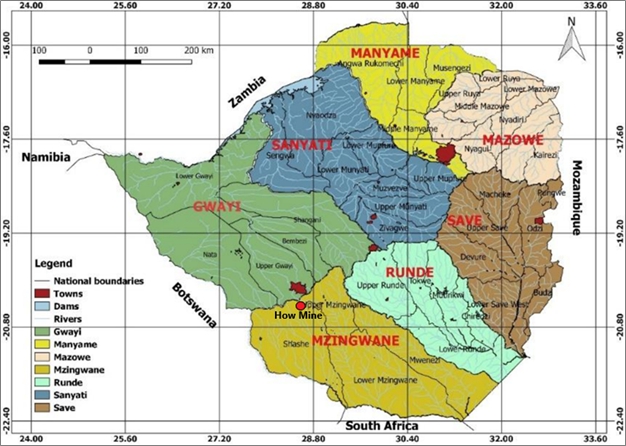
Figure 9.1 Catchment boundaries of Zimbabwe (BMC Limited)
| Project No PS229049 | WSP |
| How Mine | March 2026 |
| S-K 1300 Technical Report Summary | Page 45 |
| Namib Minerals |
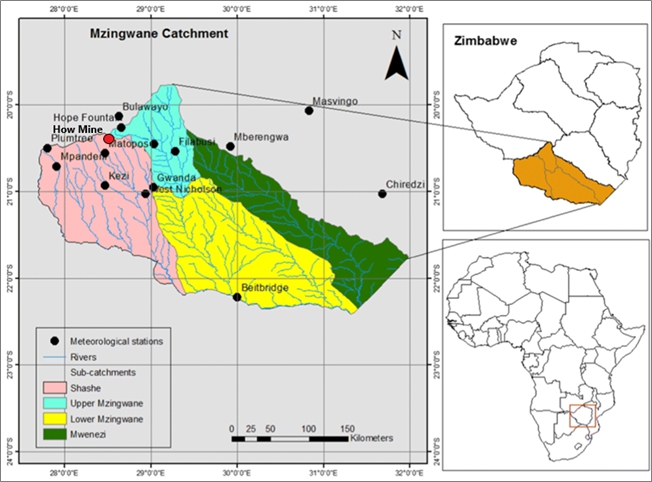
Figure 9.2 Sub-catchment boundaries of Mzingwane, Zimbabwe (BMC Limited)
| 9.4.1 | Hydrology |
Esigodini is a hydrological sub-zone BIK in the Upper Mzingwane sub-catchment of the Mzingwane Catchment. The hydrological sub-zone BIK has a Mean Annual Run-off (MAR) of 49 mm, and a Coefficient of Variation (CV) of 150%. This means that there is a high probability of having low run-off that is experienced from year to year. The Inyankuni River is the major river in the area and drains into the Mzingwane River in Mbalabala. The Inyankuni Dam (on the Inyankuni River) has a capacity of approximately 80,000 megalitres (Ml). Esigodini experiences annual rainfall of 618 mm, which is characterised by intra-season dry spells. Maximum temperatures average 27°C, and annual evaporation is 1,836 mm. There is also a local dam that supplies the mine with water. The local dam is on the Ngwabalozi River. The river is not perennial (BMC 2023a).
| 9.4.2 | Hydrogeology |
Younger intrusive granites characterise Esigodini. These granites possess low average transmitting properties, and secondary permeability. Groundwater occurrence is determined by the development of secondary structures such as faults, and weathering and shearing. Unprotected groundwater sources are vulnerable to contamination from run-off from areas where fertilisers, pesticides, herbicides, fuels, and chemicals have been applied, and those built downstream of sanitation facilities are at most risk of contamination (BMC 2023a).
| — | General groundwater potential: low to moderate. |
| — | Abstraction facilities: boreholes, and deep and shallow wells. |
| — | General water strike range: 15 to 60 m. |
| — | Borehole depth: 40 to 70 m. |
| Project No PS229049 | WSP |
| How Mine | March 2026 |
| S-K 1300 Technical Report Summary | Page 46 |
| Namib Minerals |
| — | Deep well depth: 10 to 20 m. |
| — | Shallow well depth: <10 m along river channels and low lying areas. |
| — | Water level range: 5 to 30 m. |
| — | General average yield: 0.02–2.0 litres per second (l/s). |
| — | General water quality: Good for human consumption, crops, and livestock consumption. |
| — | In the opinion of the QP, the data used to inform the groundwater models is of adequate quality. |
| — | In the opinion of the QP, this data is adequate for use in the mine design and mine schedules, and for the purposes for which it is used in this TRS. |
| 9.5 | Processing and recovery methods data verification |
The QP has validated HGM metallurgical processing by way of documentation provided, which includes metallurgical reports and performance, technical reports and business improvement projects. Further details regarding the HGM processing plant and flowsheet are presented in Section 14.
In the opinion of the QP, the processing and recovery methods data used to inform the Mineral Reserves estimate are adequate for the purposes for which it is used for this TRS.
| Project No PS229049 | WSP |
| How Mine | March 2026 |
| S-K 1300 Technical Report Summary | Page 47 |
| Namib Minerals |
| 10 | Mineral processing and metallurgical |
| 10.1 | Nature and extent of mineral processing and metallurgical testing |
The metallurgical plant encompasses a wide range of activities for extracting the gold from the ore. Ore consists of mainly sulphides, carbonates and silicates. Gold occurs at sulphide grain boundaries and in fractures within sulphides. Free gold is also found in chert bands. Pyrite, accounting for 90% of total sulphides, is fine grained and is associated with high ore grades. The plant design is appropriate for free-milling gold ore, that is, no pre-treatment refractory processing (e.g., roasting or re oxidation) is currently installed. Extraction is via gravity concentration and conventional cyanidation & adsorption.
| 10.1.1 | Nature of Mineral Processing Operations |
Comminution – designed to reduce particle size and liberate gold
| — | Crushing (Primary and secondary stages) |
| — | Milling (Primary and secondary milling circuits) |
| — | Cyclone classification (Target grind: typically, 75 µm P80) |
Gravity Recovery - designed to recover free-milling gold prior to cyanidation
| — | Knelson concentrators (KC48, KC30 x 2 and KC20) |
| — | Intensive leach reactor (Acacia) |
Cyanidation and Adsorption
| — | Carbon-in-Pulp (CIP) circuit with 14 operational tanks |
| — | Cyanide leaching at controlled pH (>10.5) |
| — | Activated carbon adsorption |
| — | Elution and electrowinning |
Tailings Handling
| — | Detoxification of cyanide using ferrous sulphate |
| — | Tailings disposal to TSF (Dam 5) |
| 10.1.2 | Extent of Metallurgical Testing |
Operational Test Work
Current metallurgical testing includes:
| — | Daily head and tail grade determination |
| — | Daily bottle roll tests |
| — | Daily grinds tests |
| — | Weekly carbon activity tests |
| Project No PS229049 | WSP |
| How Mine | March 2026 |
| S-K 1300 Technical Report Summary | Page 48 |
| Namib Minerals |
Historical Test Work
Metallurgical test work conducted included:
| — | Gold deportment studies Bottle roll cyanidation tests and Gravity recoverable tests) |
| — | Bond work index determination |
| — | Mineralogical analysis |
| 10.2 | Spatial representativity of metallurgical sampling |
The Mine has implemented documented sampling procedures, mechanical sampling systems and statistical quality control measures to ensure spatial representativity of metallurgical samples designed to minimise sampling bias and account for ore heterogeneity and nugget effect.
Plant feed sampling is conducted using a time-based, automatic, cross-belt, mechanical sampler that cut the full stream of the ore on the conveyor belt. For slurry streams, samples are collected manually using a specially designed sample cutter to collect full cross-sectional cuts.
To maintain spatial representativity during preparation, a riffle sample divider is used instead of the manual coning and quartering.
To address the nugget effect given the presence of coarse gold in the ore, especially before gravity concentration, a large sample mass is taken and sample mass reduction is done and, in the process, duplicate samples are taken.
Periodic inter-lab comparisons are done to check variability.
| 10.3 | Details of analytical or testing laboratories |
Commercial laboratories
| — | Performance Laboratories (Ruwa, Harare) |
| — | Antech Laboratories (Kwekwe) |
| — | Zimlabs (Harare) |
Mine Laboratories
| — | Turk Mine |
| — | Renco Mine |
| 10.4 | Predictions and assumptions in mineral processing |
There are no major changes in mineralogy with depth. Gold deportment remains consistent based on laboratory test works performed and historical plant performance data. Ore mineralogy and ore hardness remains consistent from between mining levels/sources.
The feed rate of ore and chemicals (lime, cyanide, peroxide) remains steady.
| Project No PS229049 | WSP |
| How Mine | March 2026 |
| S-K 1300 Technical Report Summary | Page 49 |
| Namib Minerals |
| 11 | Mineral Resource estimate |
| 11.1 | Resource database |
The HGM database was provided in the form of four separate csv files; collar, survey, assay and lithology. No geological database has been installed on site, instead the data is housed in excel files. Site geologists routinely perform data quality checks to ensure data collection quality is high.
WSP recommends Namib consider the implementation of a geological database to ensure minimal manual data entry is necessary and to improve the quality of data captured.
| 11.2 | Geological interpretation |
Consistent with previous Mineral Resource estimates, Namib supplied domain wireframes to WSP (Figure 11.1) which were created using grade-based cut-offs and sectional interpretations to create solids. These wireframes were all separate spatially and only created away from previous mining areas. Some of these wireframes at depth were created around single drillhole intercepts which WSP considers to be high risk.
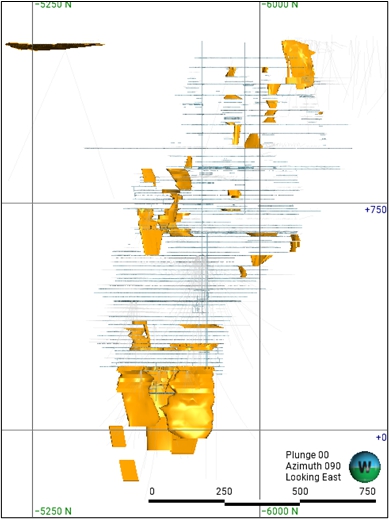
Figure 11.1 Long section view looking East showing existing development in grey and Namib’s planned MRE wireframes in orange.
| Project No PS229049 | WSP |
| How Mine | March 2026 |
| S-K 1300 Technical Report Summary | Page 50 |
| Namib Minerals |
WSP reviewed the provided wireframes and found considerable mineralisation exists in drilling in the hanging wall and footwall to the solids. With the gold price increasing dramatically since the previous MRE, a full mineralisation re-interpretation was undertaken to ensure all potentially economic material is captured and modelled to enable further future mining studies if warranted.
| 11.2.1 | Mineralisation Modelling |
The mineralisation at How is associated with sulphide mineralisation with pyrite being the dominant sulphide. Gold mineralisation occurs in fractures within the sulphide or on sulphide grain surfaces. Mineralisation is associated with hydrothermal solutions migrating along structures and appears to occur across different lithologies, including various tuff units, black shale and chert. Due to the absence of core photography and limited underground mapping available, mineralisation modelling has relied on gold grade entirely and checked against level plan mapping where available.
| 11.2.1.1 | Low Grade Domain |
Gold assays underwent statistical and spatial assessment using histograms, log probability plots and visual observation of trends to determine nominal cut-off grades to model a low-grade halo with internal high-grade domains. Statistical analysis of internal waste lengths was used to choose an appropriate amount of internal waste to include. 4.5 m of internal waste was incorporated into the low-grade mineralisation wireframes which showed visual continuity of mineralisation without the need to create a large number of internal waste domains.
A low-grade cut-off of 0.36g/t Au with up to 4.5m of internal waste was selected for the low-grade mineralisation wireframes (Figure 11.2)
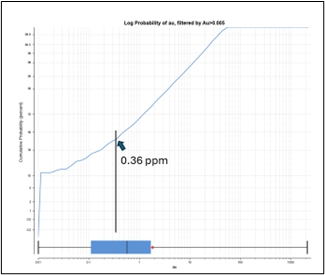 | 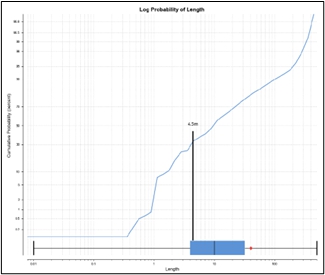 |
Figure 11.2 (left) log probability plot of Au assays at How, (right) log probability plot of waste interval lengths at How
The low-grade mineralisation wireframes were constructed in Leapfrog Geo using intrusion modelling on a section-by-section basis using the interval selection tool to manually select grade composite intervals to define the wireframes. This process is shown in Figure 11.3 where the pink intervals represent material above 0.36g/t Au containing less than 4.5m of internal waste and the blue intervals which do not meet the selection criteria.
| Project No PS229049 | WSP |
| How Mine | March 2026 |
| S-K 1300 Technical Report Summary | Page 51 |
| Namib Minerals |
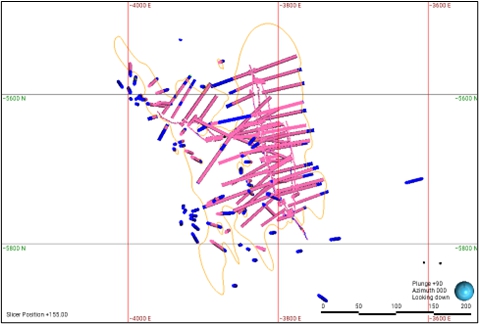
Figure 11.3 Plan view +/- 13m at 155mRL showing the intervals selected in the low-grade wireframe in pink with external segments in blue. The resulting low-grade wireframes outline is in orange.
A north facing section view of the resulting low-grade wireframe is shown in Figure 11.4.
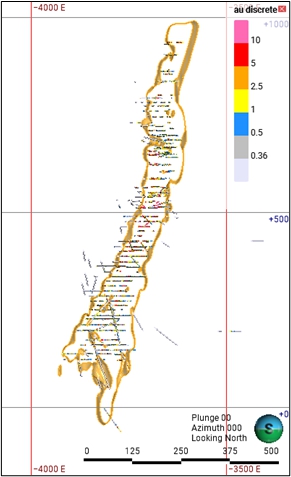
Figure 11.4 North facing section view +/- 13m at 5725mN
| Project No PS229049 | WSP |
| How Mine | March 2026 |
| S-K 1300 Technical Report Summary | Page 52 |
| Namib Minerals |
| 11.2.1.2 | Medium Grade Domain |
To review the requirement for further grade domaining, a log probability plot of Au assays within the low-grade domain was created. There was no distinct break in grade population so a 1g/t cut-off was applied with an internal waste length of 1.8 m included in the domain. Similar to the low-grade domain, an amount of internal waste was incorporated into the medium grade domains to ensure reliable connections can be made between drillholes.
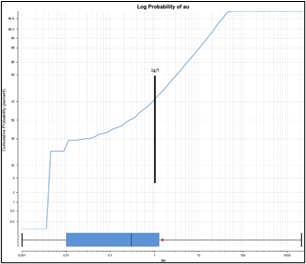 | 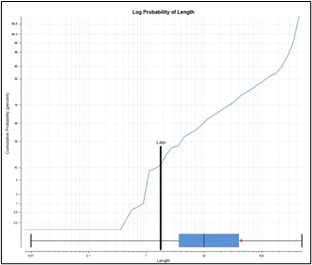 |
Figure 11.5 (Left) Log probability plot of Au assays within the low-grade wireframe at How. (Right) Log probability plot of waste interval lengths within the low-grade wireframe at How.
The medium grade domains were also created in Leapfrog using refined intrusion models, restricting the medium grade domains within the low-grade ones. To help guide the orientation of the domains, a structural trend was created for three separate areas of the mine and used to define anisotropy of the domain.
| Project No PS229049 | WSP |
| How Mine | March 2026 |
| S-K 1300 Technical Report Summary | Page 53 |
| Namib Minerals |
A plan view showing the red medium grade domain inside the orange low grade domain is show in Figure 11.6 with the structural trend discs show in blue.
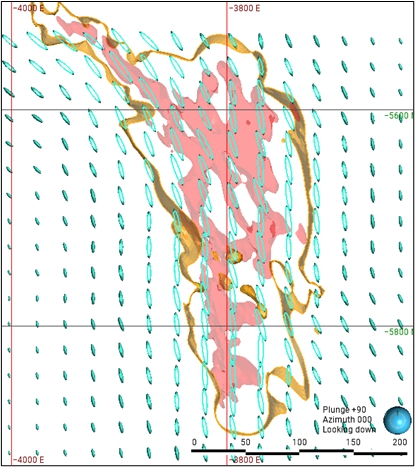
Figure 11.6 Plan view at 285mRL showing the medium grade domain (red) inside the low-grade domain (orange). Structural trend shown in blue.
| Project No PS229049 | WSP |
| How Mine | March 2026 |
| S-K 1300 Technical Report Summary | Page 54 |
| Namib Minerals |
| 11.2.1.3 | High Grade Domain |
A review of the grade distribution with the medium grade domain suggested multiple grade populations remain inside the domain. A high-grade domain was therefore delineated at a cut-off grade of 4g/t Au based on the histogram and log probability plots (Figure 11.7)
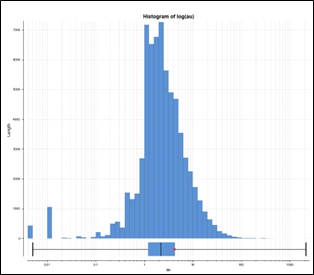 | 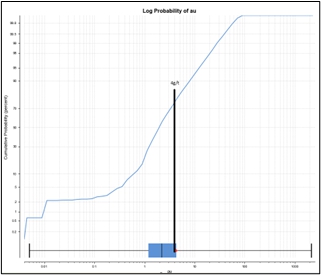 |
Figure 11.7 (Left) Histogram of Au grades within the medium grade domain at How. (Right) log probability plot of Au grades within the medium grade domain at How.
A numeric indicator model was created for this domain in Leapfrog, at a cut-off of 4g/t Au, using an iso value of 0.5. This created a high-grade wireframe internal to the previously created medium-grade wireframe and delineated the high-grade core of the mineralisation.
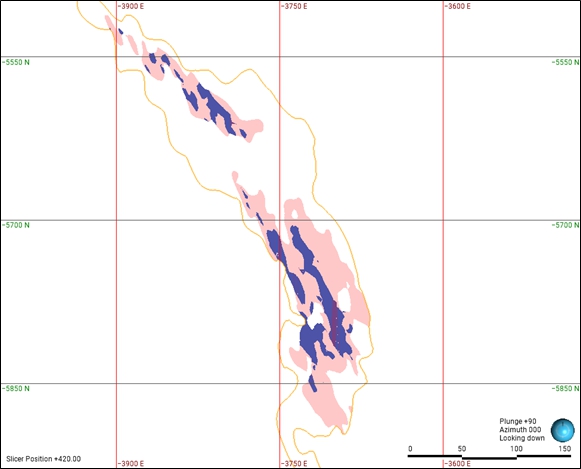
Figure 11.8 Plan view at 420mRL showing the Low-grade wireframe outline in orange with the Medium-grade wireframe in red and the internal High-grade wireframes in purple.
| Project No PS229049 | WSP |
| How Mine | March 2026 |
| S-K 1300 Technical Report Summary | Page 55 |
| Namib Minerals |
| 11.3 | Data preparation |
| — | To ensure the provided database is of sufficient quality to enable QP signoff of the MRE, a high-level data review was undertaken by WSP prior to commencing estimation of the MRE. The review concentrated on data from the 2025 drill program as these areas inform the majority of the forward mining plan. |
| — | Drilling data was provided to WSP as four separate csv files; BMC_dhcollars, BMC_survey, BMC_assay and BMC_geology with exported dates of 3rd January 2026 and is summarised in Table 11.1. |
| 11.3.1 | Hole Types |
Table 11-1 Summary of drill types included in the How database and used in the Mineral resource estimate
| Hole Type | Number of Holes | Total Length (m) | Average length of hole (m) |
| DD | 2,446 | 145,028 | 59.29 |
| Channel | 10,036 | 33,984 | 3.39 |
| Trench | 50 | 2,253 | 45 |
| Sludge | 4,846 | 47,246 | 9.75 |
| Total | 17,378 | 228,511 | 13.15 |
A review of the relationships between DD, Channel, Trench and Sludge drilling was undertaken to determine suitability of using each datatype in the estimate. While the mean grades in the Channel samples are higher than the diamond drilling, trench and sludge holes, this is thought to be due to the location of the sampling generally occurring in the centre of high-grade mineralisation. Due to the spatial locations of different drill type shown in Figure 11.9, all data has been used to define mineralisation, and in the estimate, as there are areas which are only informed by sludge drilling. Those parts of the deposit which are not informed by diamond drilling have had the classification downgraded to Inferred.
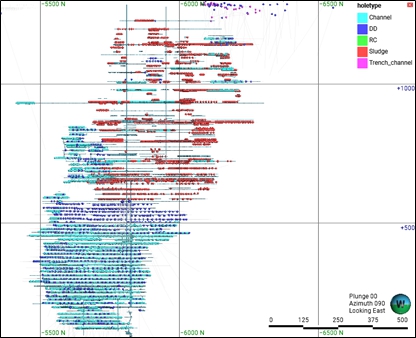
Figure 11.9 Long section view showing collar locations of different drill types
| Project No PS229049 | WSP |
| How Mine | March 2026 |
| S-K 1300 Technical Report Summary | Page 56 |
| Namib Minerals |
Due to the methodology for ore delineation diamond drilling which involves collaring in the development drive and drilling out horizontally from short stubs, the highest-grade core of the mineralisation is often not included in diamond drilling. For this reason, it was considered necessary to include trench and channel samples in the estimate to provide a more accurate representation of the high-grade core areas (Figure 11.10).
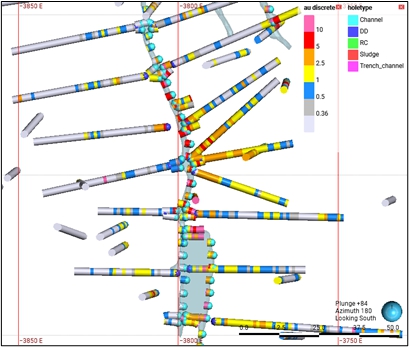
Figure 11.10 Plan view at 300mRL showing channel samples in the development drive (light blue collars) with diamond drilling (collars in dark blue)
| Project No PS229049 | WSP |
| How Mine | March 2026 |
| S-K 1300 Technical Report Summary | Page 57 |
| Namib Minerals |
| 11.3.2 | Collar Review |
A review of the collar location against provided development wireframes was undertaken, with some discrepancies found, particularly in the upper areas of the mine. Figure 11.11 shows that some areas of the mine have the drillholes plotting more than 3m away from the development. This is partly due to missing development pickups which have been requested for follow up by Namib (these were delivered on 10th Feb 2026). Other areas are due to incorrect assignment of Z co-ordinates of the drillholes. These areas of concern are largely in the mined areas of the mine and so not expected to have a material impact on the resource, particularly considering the horizontal nature of the majority of the drilling.
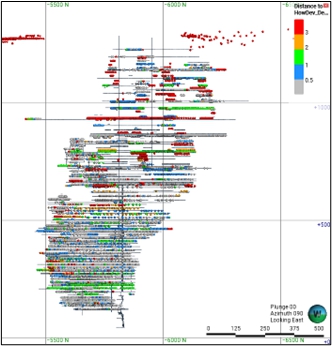
Figure 11.11 Long section looking East showing distance of the collar points to the development drive.
| Project No PS229049 | WSP |
| How Mine | March 2026 |
| S-K 1300 Technical Report Summary | Page 58 |
| Namib Minerals |
There were no excluded holes as all holes were included to inform the domaining and the estimate.
| 11.3.3 | Downhole Survey Review |
WSP reviewed downhole surveys for all of the diamond drill holes in the database with end of hole depths greater than 50m. In total, 715 diamond drill holes exist in the provided data with depths greater than 50 m, and 171 of these holes contain downhole surveys. A kink check of dogleg severity was undertaken on all holes and there are issues with many of the holes towards the bottom of the mine. Figure 11.12 shows any dogleg greater than 10 in red which suggests issues with the downhole surveys. This is potentially due to the presence of sulphides in the mineralised sections of the deposit or alternatively due to the presence of magnetite in some lithologies (potentially dolerite dykes). For the purpose of the estimate, the surveys were ignored in the drilling where the dogleg values suggest they are spurious. A complete list of ignored intervals is shown in Table 11.2.
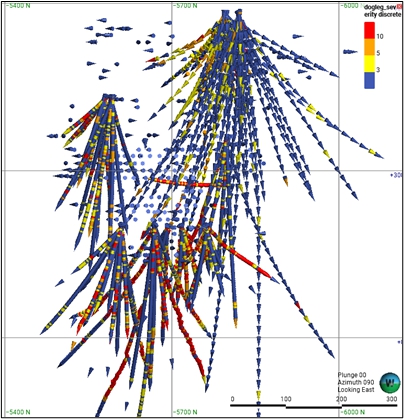
Figure 11.12 Long section view looking East showing dog-leg severity in diamond drill holes
Table 11-2 Survey intervals ignored due to spurious azimuth readings
| Hole ID | Ignored Intervals | Hole ID | Ignored Intervals |
| 26Lev_011 | 3-6; 60, 90, 99-105, 141-312 | 30L360N_011 | 153-159, 171-201, 207-210, 216-222, 228-243, 249-255 |
| 26Lev_012 | 29.71, 120.79, 170.03, 181.58, 207.44-210.31, 263.73, 272.04 | 30L360N_012 | 15, 27-39, 273-285, 306, 327 |
| 26Lev_013 | 2.93, 47-49.92, 70.29-73.19, 124.93 | 30L360N_013 | 0-6, 45-48, 63, 81, |
| 30L360N_006 | 0-6, 210-222, 276-279 | 30L360N_015 | 9-12, 39, 51, 63-69, 90, 126, 135, 144, 153, 177 |
| 30L360N_008 | 39-42, 105-129, 135-359 | 30L400N_003 | 33-36 |
| 30L400N_005 | 6 | 30L400N_006 | 0-6, 165 |
| 30L400N_007 | 6, 237-353.17 | 30L400N_009 | 9-21 |
| 30L400N_011 | 9 | 30L400N_012 | 0-3, 81 |
| 30L400N_013 | 120, 132, 159-165 | 30L400N_014 | 21, 114, 132, 192-195 |
| 30L400N_015 | 18, 39-42, 102, 132, 138-141, 162, 186-201 | 30L400N_016 | 51-54, 72, 117-120, 129-135, 153, 162, 177, 201-204 |
| 30Lev_037 | 0-9, 21, 96-111 | 30Lev_038 | 27 |
| 30Lev_039 | 0-12, 30, 45, 54-57, 63 | 30Lev_040 | 0-3 |
| 30Lev_041 | 15 | 30Lev_042 | 51 |
| Project No PS229049 | WSP |
| How Mine | March 2026 |
| S-K 1300 Technical Report Summary | Page 59 |
| Namib Minerals |
| Hole ID | Ignored Intervals | Hole ID | Ignored Intervals |
| 30Lev_043 | 15, 21-24 | 30Lev_048 | 57-172.5 |
| 30LPH1_001 | 60-72, 99-129, 171 | 30LPH1_002 | 27-33, 51-66, 111-154.92 |
| 30LPH1_003 | 6, 72-402.52 | 30LPH1_004 | 3, 78-252, 324 |
| 30L_027 | 30-126 | 30L_028 | 90-96, 105, 111-117, 126-132 |
| 30L_030 | 30-63, 72-84 | 30L_031 | 3, 42-51, 66-84 |
| 30L_033 | 6-21, 27-57, 63-123 | 30L_034 | 0, 69-135 |
WSP discussed these survey issues with personnel during the site visit and recommend considering an alternative survey method such as north seeking gyro which should negate errors due to magnetic interference.
| 11.3.4 | Assay Review |
A high-level review of the assay results was completed with no material issues identified.
Any missing intervals were assigned an assay code of -99 in the provided database. These were converted to half the detection limit (0.005 g/t Au) for the estimate as they were presumed not assayed due to the lack of presence of alteration/sulphides. Alternatively, some of these intercepts could be due to poor recovery in drilling however the core reviewed during the site visit did not show evidence of core loss.
| 11.3.5 | Compositing |
Analysis of the raw sample within the mineralisation domains at How indicated that the majority of the samples were collected at 1 m intervals (average length of 0.99 m) – see Figure 11.13. Due to the width of mineralisation extending up to 100m, the decision was made to composite drillholes to 2 m. Compositing to 2 m also allows the channel samples, which have an average length of 2 m, to be treated as a single composite.
| Project No PS229049 | WSP |
| How Mine | March 2026 |
| S-K 1300 Technical Report Summary | Page 60 |
| Namib Minerals |
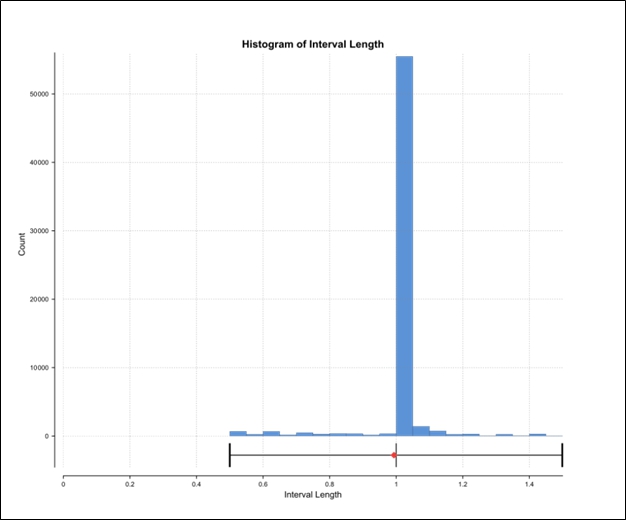
Figure 11.13 Histogram of raw assay length within mineralised domains
| 11.3.6 | Comparison Statistics |
A comparison between the raw and composite sample statistics for the estimation domains are provided below in Table 11.3.
Table 11-3 Comparison of raw and composited sample statistics (Au g/t)
| Domain | Number of Samples | Mean Grade (g/t) | Standard Deviation | ||||
| Raw | Composite | Raw | Composite | % Difference | Raw | Composite | |
| HG | 14,570 | 5,920 | 10.43 | 10.52 | -1% | 13.39 | 10.33 |
| MG | 62,447 | 29,180 | 2.87 | 2.87 | 0 | 10.40 | 7.61 |
| LG | 69,743 | 35,215 | 0.79 | 0.78 | 1% | 1.93 | 1.49 |
There are no significant changes to the mean grades across the domains through the compositing process.
| Project No PS229049 | WSP |
| How Mine | March 2026 |
| S-K 1300 Technical Report Summary | Page 61 |
| Namib Minerals |
| 11.4 | Exploratory data analysis |
| 11.4.1 | High-grade treatment |
Composites within each of the estimation domains have been analysed to ensure that the grade distributions are indicative of a single population, with no requirement for additional sub-domaining. The population analysis also identified any extreme values which could have an undue influence on the estimation of grade within the domains.
For all domains, log histograms and log-probability plots were used to identify the influence of extreme values and confirm the impact of applying a capping strategy to a population.
Au grade top cuts have been applied as tabulated in Table 11.4.
Table 11-4 Top cut statistics per domain for Au
| Domain | Top
cut Value |
Mean Grade | Co-efficient of Variation | Top
Cut percentile | ||
| Un-cut | Top Cut | Un-cut | Top Cut | |||
| HG | 65 | 10.41 | 10.26 | 0.99 | 0.86 | 99.6 |
| MG | 45 | 2.85 | 2.78 | 2.60 | 1.10 | 99.9 |
| LG | 20 | 0.78 | 0.78 | 1.92 | 1.64 | 99.9 |
The application of top cuts was required to reduce the impact of extreme values during the estimate. These high composites generally comprise of very high grades that do not demonstrate sufficient continuity to be domained separately.
| Project No PS229049 | WSP |
| How Mine | March 2026 |
| S-K 1300 Technical Report Summary | Page 62 |
| Namib Minerals |
| 11.5 | Variography |
Spatial variance analysis using variograms was conducted on the top cut and composited data for each estimation domain. Variogram orientations and rotations were checked against the mineralisation wireframe to ensure that they are geologically robust with respect to the strike and dip of each estimation domain.
Downhole and directional variograms for all domain are shown in Figure 11.14 to Figure 11.16 and a summary shown in Table 11.5.
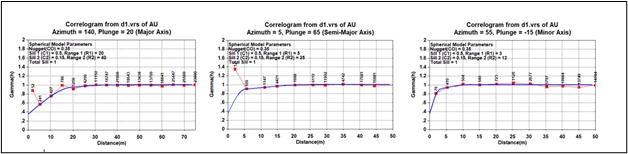
Figure 11.14 Correlograms for low-grade domain
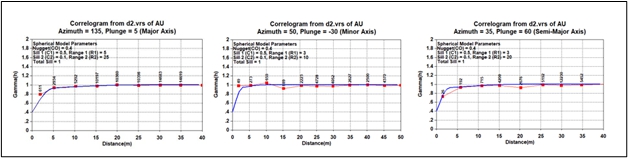
Figure 11.15 Correlograms for medium-grade domain
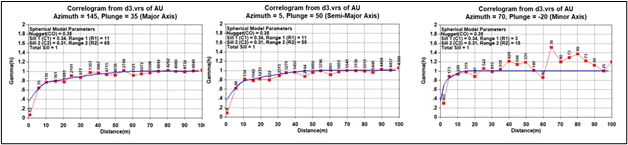
Figure 11.16 Correlograms for high-grade domain
Table 11-5 Summary of variogram parameters by domain
| Domain | Element | Leapfrog Rotations | Variographic parameters | ||||||||
| Dip | Dip Azi | Pitch | C0 | C1 | A1 | C2 | A2 | ||||
| LG | Au | 72 | 237 | 159 | 0.35 | Dir1 | 0.5 | 20 | Dir1 | 0.15 | 40 |
| Dir2 | 5 | Dir2 | 25 | ||||||||
| Dir3 | 3 | Dir3 | 12 | ||||||||
| MG | Au | 61 | 228 | 174 | 0.4 | Dir1 | 0.5 | 5 | Dir1 | 0.1 | 25 |
| Dir2 | 3 | Dir2 | 20 | ||||||||
| Dir3 | 3 | Dir3 | 10 | ||||||||
| HG | Au | 70 | 250 | 142 | 0.35 | Dir1 | 0.34 | 11 | Dir1 | 0.31 | 65 |
| Dir2 | 11 | Dir2 | 55 | ||||||||
| Dir3 | 3 | Dir3 | 15 | ||||||||
| Project No PS229049 | WSP |
| How Mine | March 2026 |
| S-K 1300 Technical Report Summary | Page 63 |
| Namib Minerals |
| 11.6 | Dry bulk density |
As discussed in Section 8.2, bulk density was assigned as a constant 2.8 g/cm3 across the entire deposit.
| 11.7 | Block models |
The block model was constructed according to the prototype parameters outlined in Table 11.6 and contains the variable as described in Table 11.7.
Table 11-6 How Block Model Parameters
| Co-ordinate | X | Y | Z |
| Minimum | -4100 | -6400 | -210 |
| Maximum | -3284 | -5392 | 1350 |
| Range (m) | 816 | 1008 | 1560 |
| Parent Cell | 8 | 8 | 8 |
| Smallest Sub-cell | 1 | 1 | 1 |
| Number of Parent Cells | 102 | 126 | 195 |
Table 11-7 Model Variables
| Variable | Description |
| Estimation Domain | LG, MG, HG |
| Au_OK | Au grade in g/t (Ordinary Kriged) |
| Density | Assigned 2.8 for all domains |
| RESCAT | Resource Classification - Measured, Indicated, Inferred |
| Mined | Mined Status - Developed, Stoped, Unmined |
| RPEEE | In_RPEEE |
The parent block sizes selected are approximately half the dominant drill hole spacing (diamond drilling) within the well-informed areas of the deposits. The blocks are sub-celled to 1 m to account for the variable thicknesses of the mineralised lodes and to accurately represent the wireframe volumes. Parent block estimation has been undertaken, therefore all sub-cells within a single parent block have the same estimated grade as the parent cell.
| Project No PS229049 | WSP |
| How Mine | March 2026 |
| S-K 1300 Technical Report Summary | Page 64 |
| Namib Minerals |
| 11.8 | Grade estimation |
The grade estimation of the mineralisation domains has been undertaken using Ordinary Kriging within each domain using hard boundary estimations. Grade estimation was completed in three passes. The search ellipse ranges applied have been based on the grade continuity and spatial variability (variography) within each domain. Dynamic anisotropy was used in each domain to adjust the search ellipse to the average orientation of the mineralisation. The first pass was estimated to the variogram range, while the second pass extends to twice the variogram range and the third to four times the variogram range (for the MG domain, the third pass was extended to five times the variogram range due to smaller ranges to ensure all blocks were estimated). Search parameters are summarised in Table 11.8.
Table 11-8 How Estimation Parameters - Au
| Domain | Pass | Search | # Samples | DH | |||
| Major | Semi-Major | Minor | Min | Max | Limit | ||
| HG | First | 32.5 | 22.5 | 7.5 | 6 | 24 | 4 |
| Second | 65 | 55 | 15 | 6 | 24 | 4 | |
| Third | 130 | 110 | 40 | 2 | 16 | ||
| MG | First | 40 | 25 | 12 | 6 | 24 | 4 |
| Second | 80 | 50 | 24 | 6 | 24 | 4 | |
| Third | 160 | 100 | 48 | 2 | 16 | ||
| LG | First | 25 | 20 | 10 | 6 | 24 | 4 |
| Second | 50 | 40 | 20 | 6 | 24 | 4 | |
| Third | 120 | 100 | 50 | 2 | 16 | ||
| 11.9 | Model validation |
Validation checks are undertaken at all stages of the modelling and estimation process. Final grade estimates and models have been validated using:
| — | Visual comparison of block grade estimates and the input drillhole data, |
| — | Global comparison of the average composite and estimated block grades, |
| — | Moving window averages (swaths) comparing the mean block grades to the composites. |
| Project No PS229049 | WSP |
| How Mine | March 2026 |
| S-K 1300 Technical Report Summary | Page 65 |
| Namib Minerals |
| 11.9.1 | Visual Validation |
Visual comparison of composite sample grades and block grades has been conducted in cross-section and in plan. Visually, the block model reflects the input composite grades, as shown in the cross section in Figure 11.17.
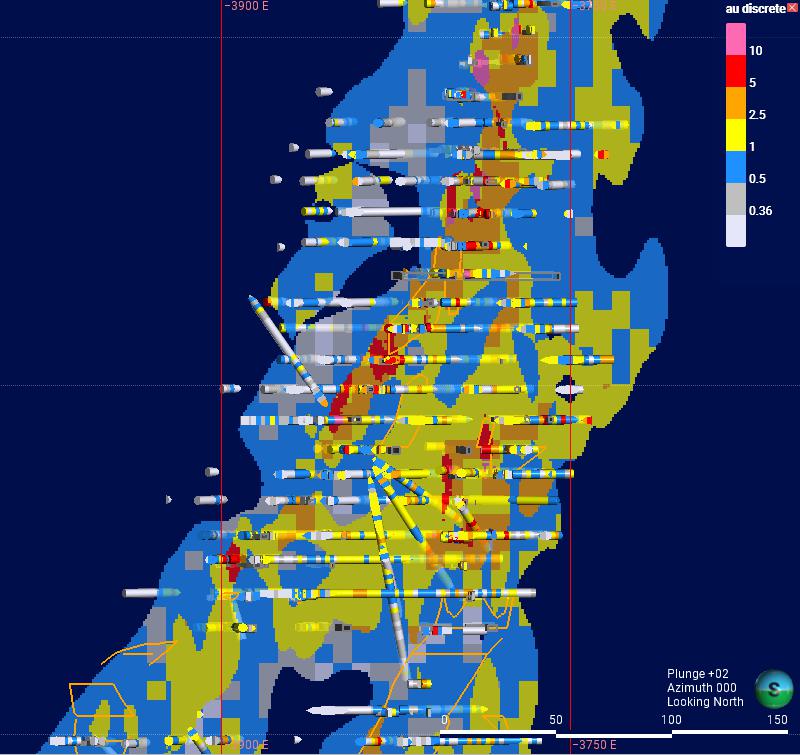
Figure 11.17 Cross section at -5625mN +/- 15m showing the block model and composites both coloured by Au
| 11.9.2 | Global Comparisons |
The final grade estimates for each estimation domain have been validated statistically against the input drillhole composites. Due to the even distribution of drilling across the majority of the deposit, it was not considered necessary to apply declustering for validation purposes.
Table 11-9 Global grade validation for all domains
| Domain | Block Estimated Grade | No of composites | Composite Grade (cut) | % Diff Est Grade vs Composite |
| LG | 0.79 | 35463 | 0.78 | 2% |
| MG | 2.72 | 29391 | 2.78 | -2% |
| HG | 10.30 | 5922 | 10.27 | 0% |
| Project No PS229049 | WSP |
| How Mine | March 2026 |
| S-K 1300 Technical Report Summary | Page 66 |
| Namib Minerals |
| 11.9.3 | Swath Plots |
Sectional validation graphs have been created to assess the reproduction of local means and to validate the grade trends in the block model by Easting, Northing and RL. These graphs (Figure 11.18 to Figure 11.20) compare the mean of the estimated block grades to the mean of the input composite grades within block model slices. The swath plots indicate that there is good local reproduction of the input grades in all directions and the estimate is applying an acceptable level of smoothing.
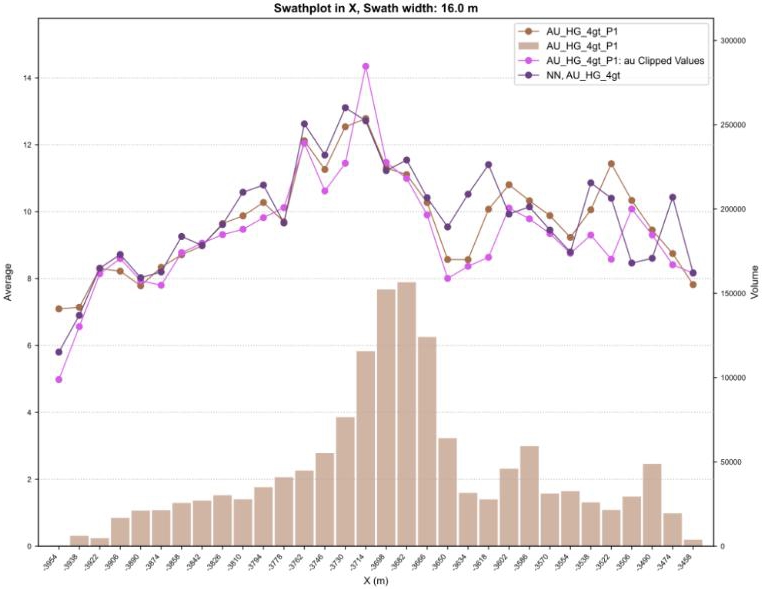 | 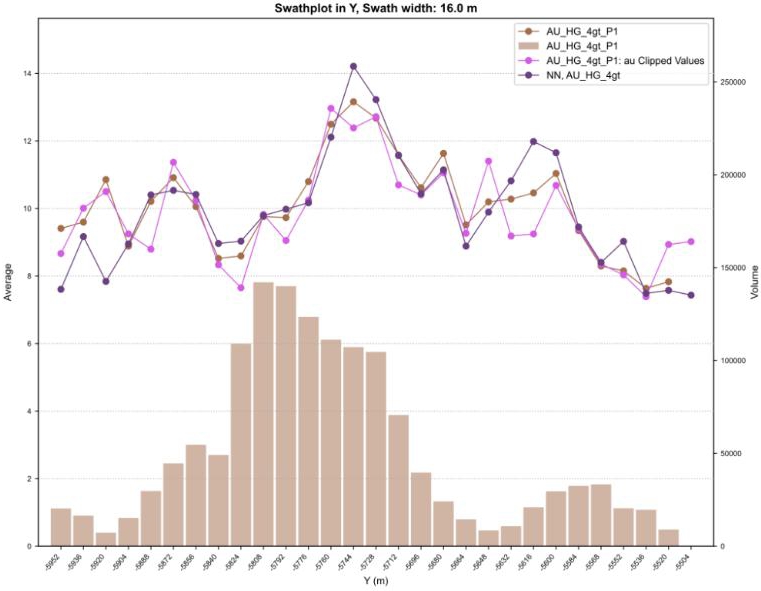 |
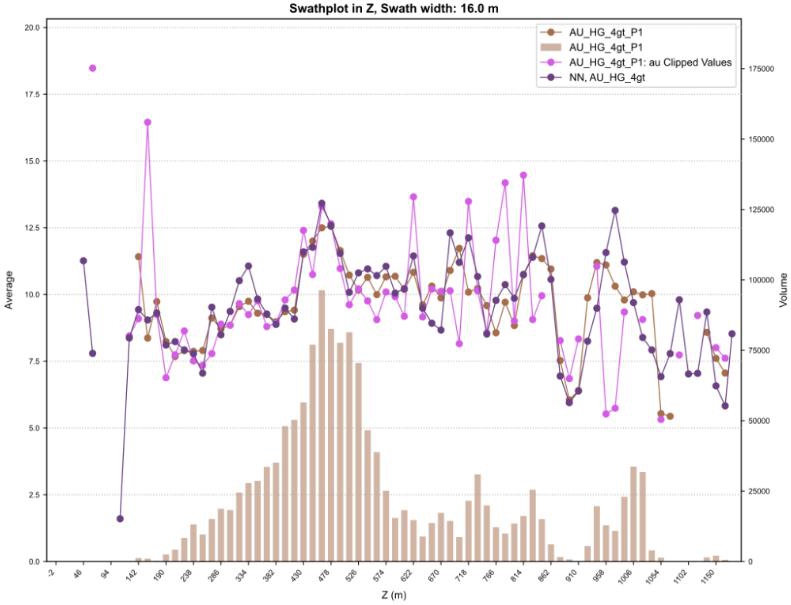
Figure 11.18 Swath Plot for HG mineralisation (Top left – X, Top right – Y, Bottom – Z)
| Project No PS229049 | WSP |
| How Mine | March 2026 |
| S-K 1300 Technical Report Summary | Page 67 |
| Namib Minerals |
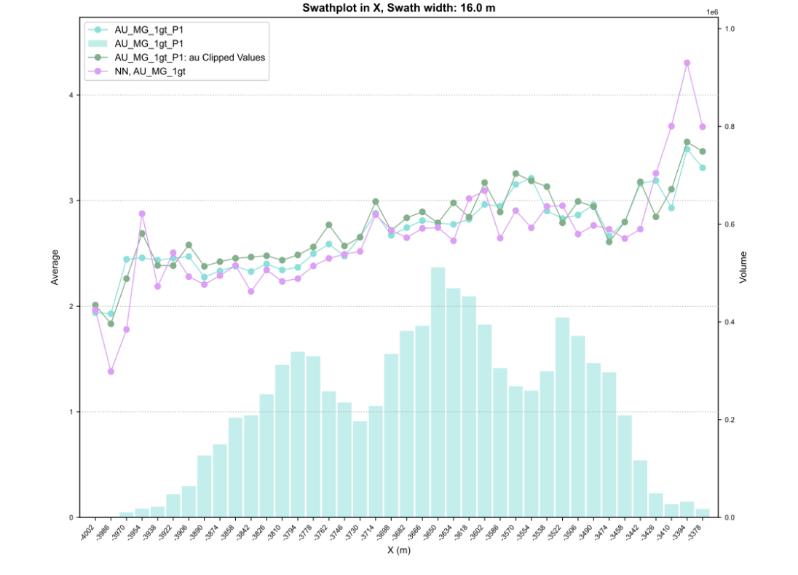 | 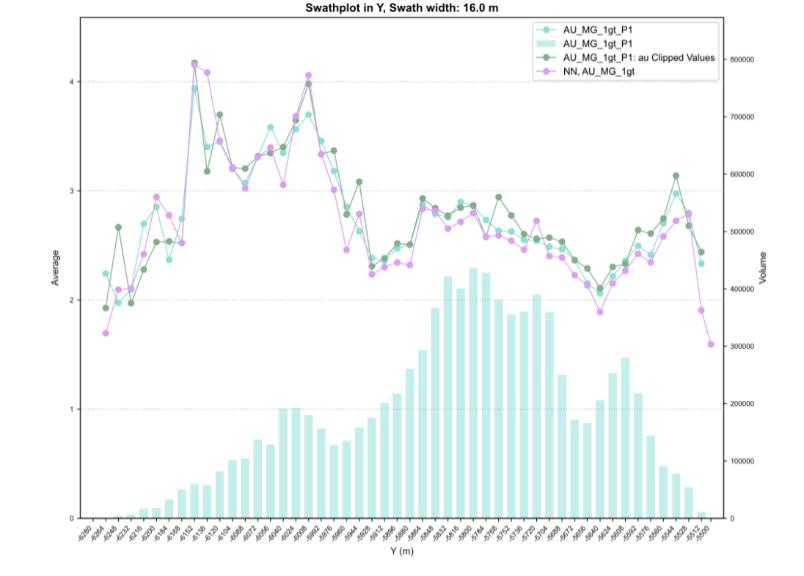 |
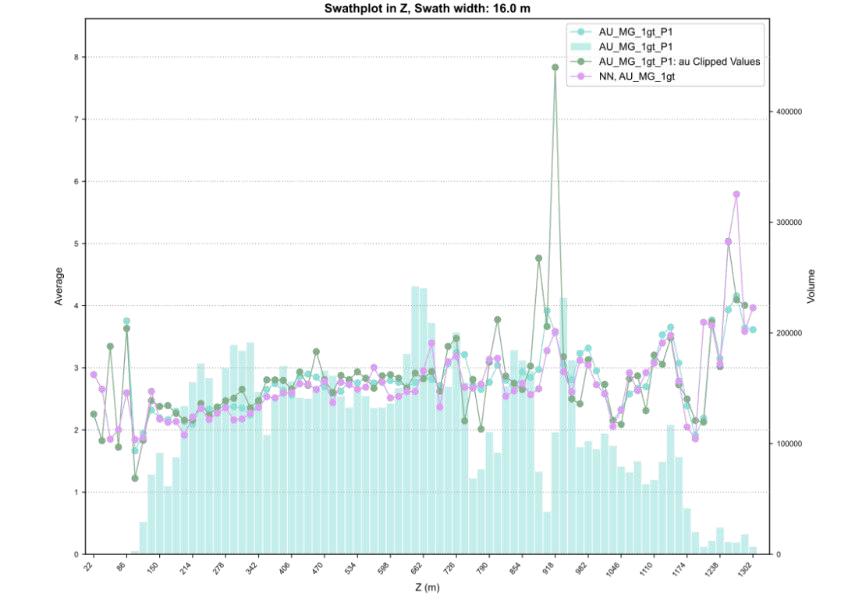
Figure 11.19 Swath Plot for MG mineralisation (Top left – X, Top right – Y, Bottom – Z)
| Project No PS229049 | WSP |
| How Mine | March 2026 |
| S-K 1300 Technical Report Summary | Page 68 |
| Namib Minerals |
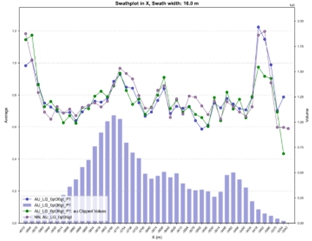 | 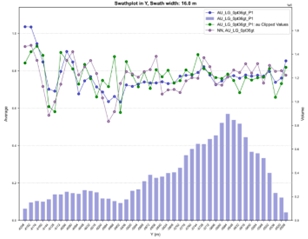 |
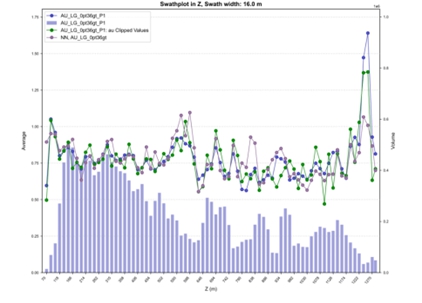
Figure 11.20 Swath Plot for LG mineralisation (Top left – X, Top right – Y, Bottom – Z)
| 11.9.4 | Tailings Dam Block Model Review |
In addition to the in-situ underground Mineral Resource estimate, Namib geologists completed an estimate of the historic Tailings Dam in 2023. These historic tailings dams were reviewed during the February 2026 site visit. WSP reviewed the estimation methodology and final estimate to enable QP sign-off of these resources. The following methodology is summarised from BMC (2021).
The historic tailings dams (Dam 3 and Dam 4) were drilled using manual augur drilling during 2021 at an approximate 15 m x 15 m spacing, resulting in 416 holes. Entire holes were sampled at 1 m spacing with depths ranging from 0.5 m to 18 m, averaging 5.07 m. Samples totalling 2-3 kg were collected and sent to the on-site laboratory for analyses by fire assay.
| Project No PS229049 | WSP |
| How Mine | March 2026 |
| S-K 1300 Technical Report Summary | Page 69 |
| Namib Minerals |
The mean grade of the 1999 samples was 0.93 g/t Au with a maximum grade of 4.99 g/t Au – no top-cutting was deemed necessary. A block model was created using a parent block size of 3.5 x 3.5 x 5m (xyz) with sub-blocking to 1m in all directions. Gold grade was estimated by Ordinary Kriging using a minimum of 2 and a maximum of 20 samples to inform each block using a flat ellipse to guide the estimate. A specific gravity of 1.6 t/m3 was applied to all blocks.
The QP agrees with the methodology used to estimate the tailings dams.
| 11.9.5 | Tailings Dam Block Model Validation |
WSP conducted a visual validation of the Dam3_4.bmf block model by comparing input composites with estimated values in the block model. Comparisons are presented in plan view, and in cross-sectional and long-sectional views for the variable Au for Dam 3 (Figure 11.21to Figure 11.24), and Dam 4 (Figure 11.25to Figure 11.28).
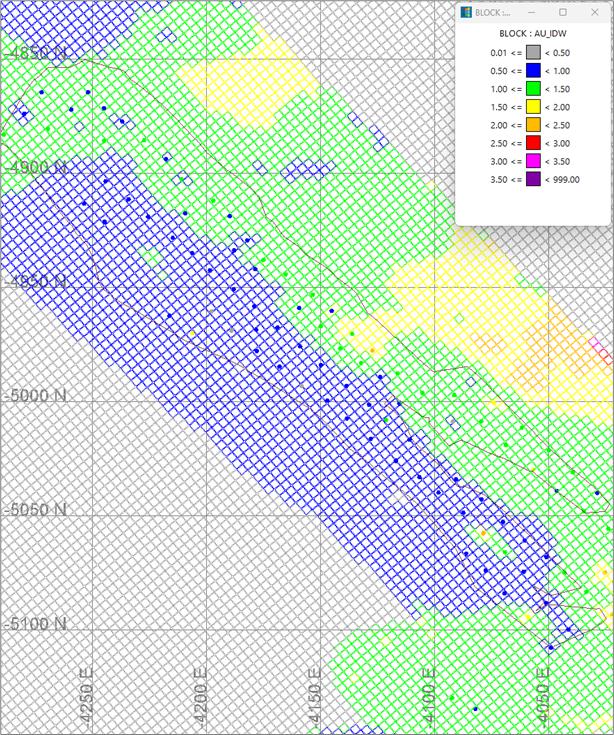
Figure 11.21 Plan view of the block model at Dam 3, showing estimated grades and composited data at the 1261 m levels (±1 m). Topography is shown in brown.
| Project No PS229049 | WSP |
| How Mine | March 2026 |
| S-K 1300 Technical Report Summary | Page 70 |
| Namib Minerals |
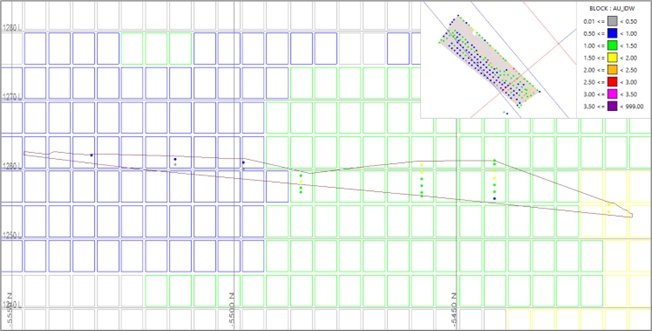
| Figure 11.22 | NE–SW cross-section (±5 m) looking northwest at Dam 3, comparing Au composite grades with the block model Au_IDW grades. Topography is shown in brown. |
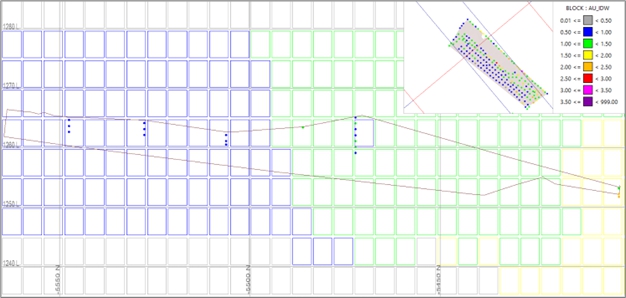
| Figure 11.23 | NE–SW cross-section (±5 m) looking northwest at Dam 3, comparing Au composite grades with the block model Au_IDW grades. Topography is shown in brown. |
| Project No PS229049 | WSP |
| How Mine | March 2026 |
| S-K 1300 Technical Report Summary | Page 71 |
| Namib Minerals |
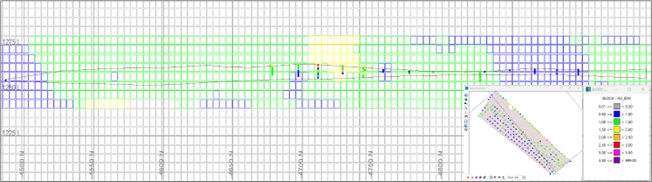
| Figure 11.24 | NW–SE long-section (±5 m) looking northeast at Dam 3, comparing Au composite grades with the block model Au_IDW grades. Topography is shown in brown. |
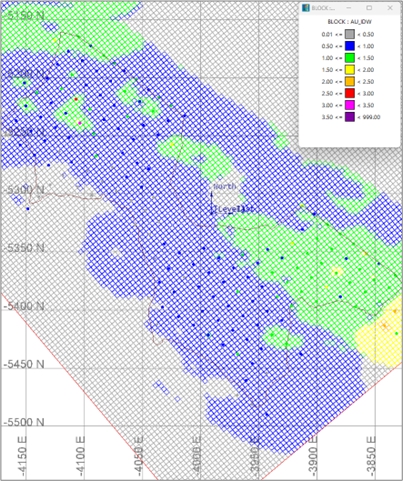
| Figure 11.25 | Plan view of the block model at Dam 4, showing estimated grades and composited data at the 1,271 m levels (±1 m). Topography is shown in brown. |
| Project No PS229049 | WSP |
| How Mine | March 2026 |
| S-K 1300 Technical Report Summary | Page 72 |
| Namib Minerals |
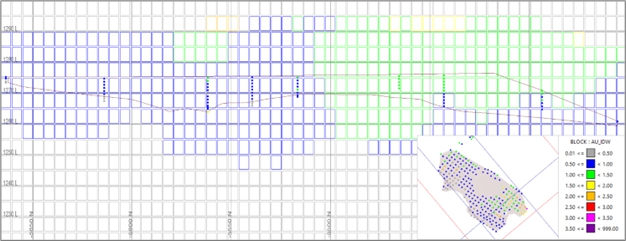
| Figure 11.26 | NE–SW cross-section (±5 m) looking northwest at Dam 4, comparing Au composite grades with the block model Au_IDW grades. Topography is shown in brown. |
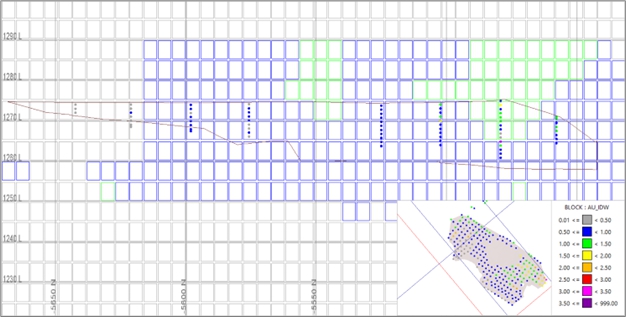
| Figure 11.27 | NE–SW cross-section (±5 m) looking northwest at Dam 4, comparing Au composite grades with the block model Au_IDW grades. Topography is shown in brown. |
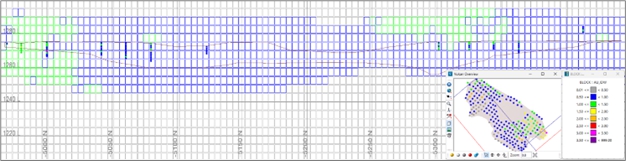
| Figure 11.28 | NW–SE long-section (±5 m) looking northeast at Dam 4, comparing Au composite grades with the block model Au_IDW grades. Topography is shown in brown. |
| Project No PS229049 | WSP |
| How Mine | March 2026 |
| S-K 1300 Technical Report Summary | Page 73 |
| Namib Minerals |
Overall, visual evaluation of grade distribution indicates a reasonable alignment between block model estimates and sample grades.
A statistical comparison between the input samples and the model estimated blocks within each dam wireframe is presented in Table 11.10.
Table 11-10 Comparison between the input samples and the model estimated blocks within each dam wireframe
| Dam | Field | Composites | Block Estimates | Mean Difference (%)* | ||||||||
| Num Rec | Min | Max | Mean | CV | Num Rec | Min | Max | Mean | CV | |||
| D3 | Au g/t | 595 | 0.31 | 3.37 | 1.12 | 0.37 | 5,871 | 0.45 | 3.07 | 1.09 | 0.27 | -2.15 |
| D4 | Au g/t | 1,528 | 0.02 | 4.99 | 0.85 | 0.50 | 13,239 | 0.20 | 2.16 | 0.82 | 0.32 | -3.06 |
Conformance of the model and sample average grades was evaluated in Easting, Northing and RL directions for dam 3 and 4 (Figure 11.29 and Figure 11.30).
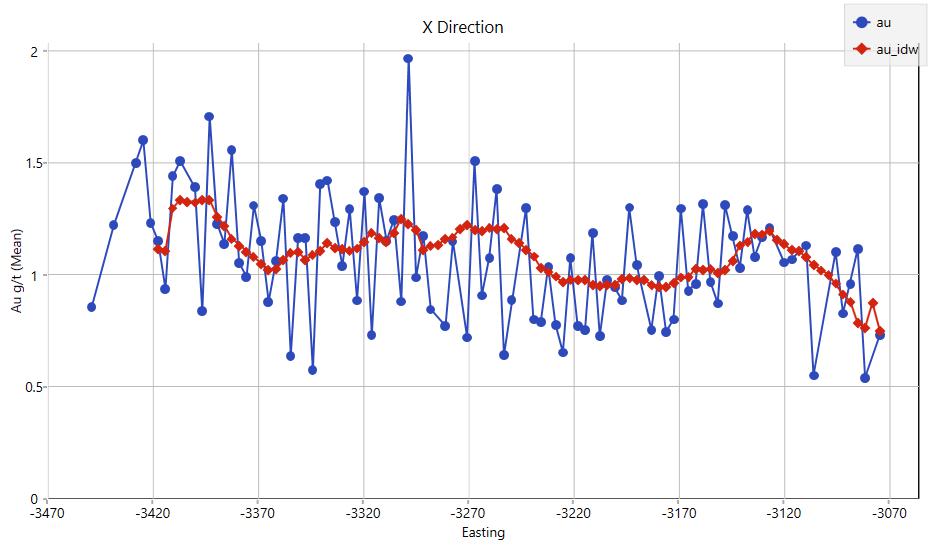 | 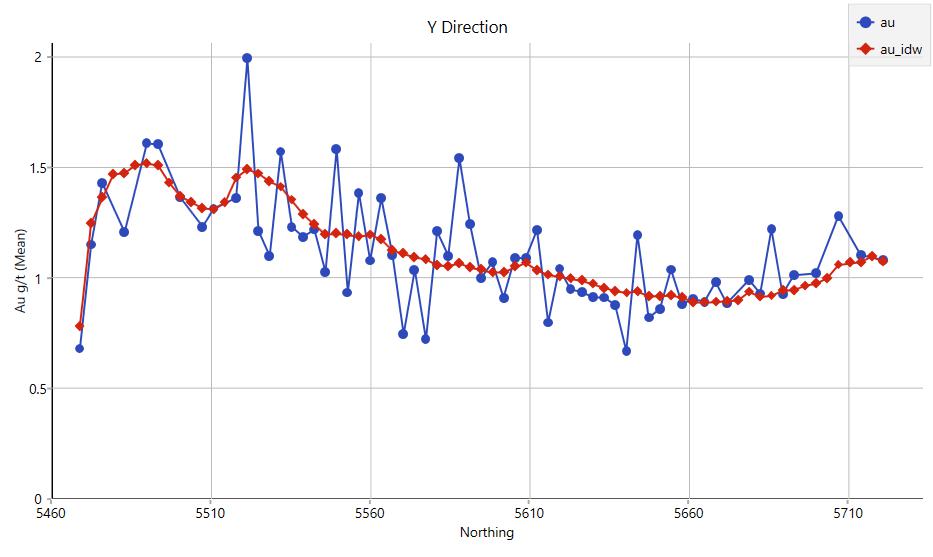 |
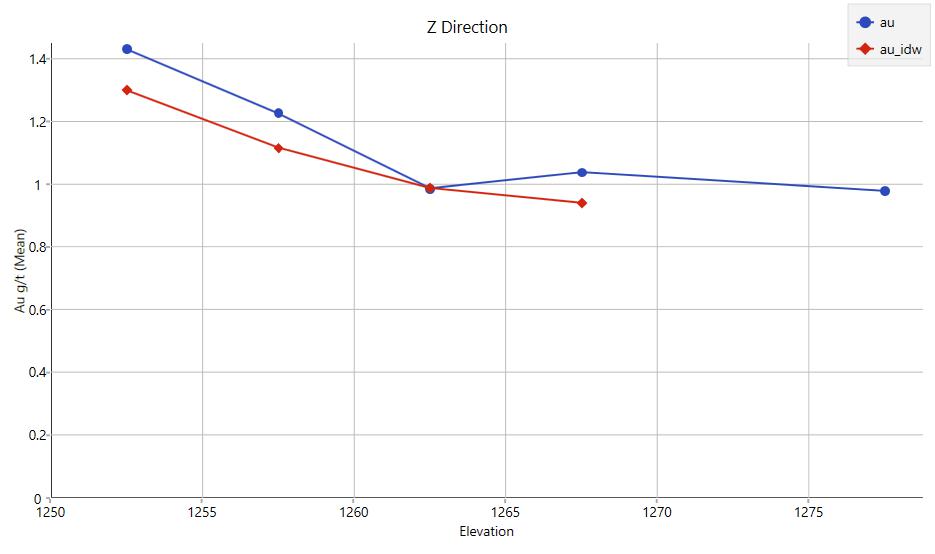 |
| Figure 11.29 | Swath Plot for Dam 3 (Top left – X, Top right – Y, Bottom – Z) |
| Project No PS229049 | WSP |
| How Mine | March 2026 |
| S-K 1300 Technical Report Summary | Page 74 |
| Namib Minerals |
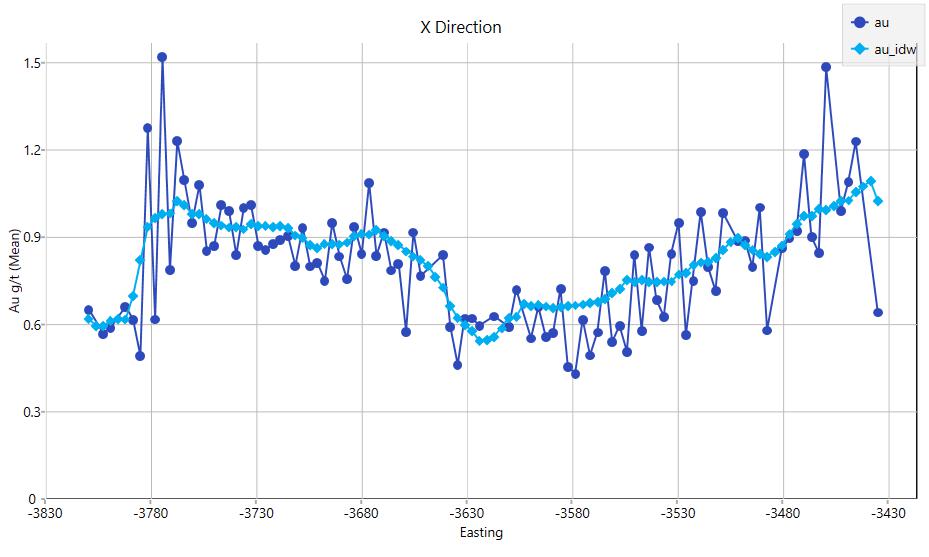 | 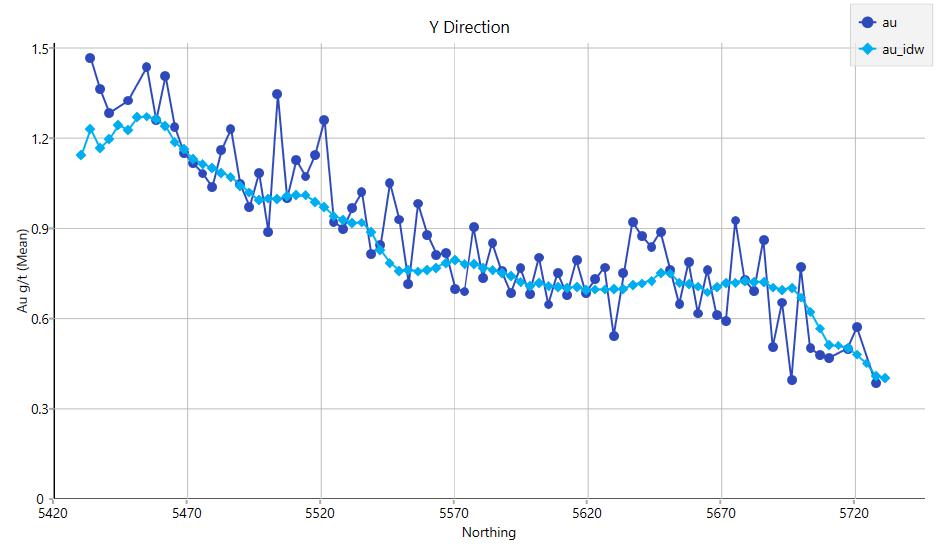 |
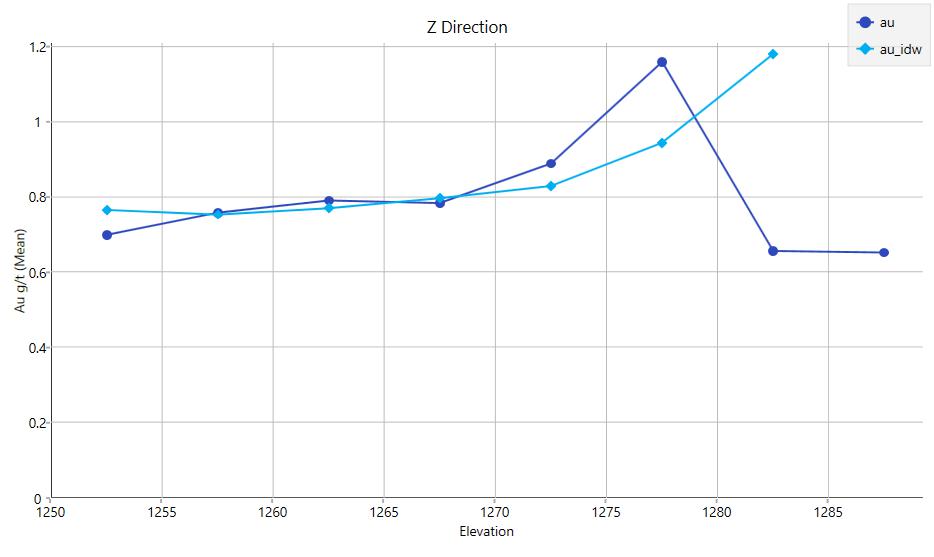 |
| Figure 11.30 | Swath Plot for Dam 4 (Top left – X, Top right – Y, Bottom – Z) |
Swath plots show a good local conformance between block estimates and sample data. The results indicate a reasonable correlation between average sample grades and estimated block values, with minor local deviations in the Z direction and slight smoothing of extreme-grade values.
Block model tonnes and grade were verified by WSP using Vulcan’s “Advanced Grade/Tonne Report” which showed an alignment between the reported tonnes and grade with the models provided to WSP.
Based on the comparison with the officially reported Mineral Resources for the Dam area, WSP found no issues in the estimation and reporting of the Dam3_4.bmf block model.
| 11.10 | Mineral Resources classification |
Classification of the Mineral Resource has been considered based on the following definitions from the SEC S-K 1300.
Measured Mineral Resource – highest confidence category which requires conclusive geological evidence to test and confirm geological and grade continuity. A Measured Mineral Resource is suitable for converting into a Proven Mineral Reserve if other modifying factors are met.
Indicated Mineral Resource – has a lower confidence level than measured but still strong enough for mine planning. Must be supported by adequate geological evidence to establish geological and grade continuity with reasonable certainty
Indicated Mineral Resources may be converted to Probable Mineral Reserves.
Inferred Mineral Resource – is based on limited geological evidence and sampling. Geological evidence is sufficient to imply (but not confirm) continuity and cannot be used for reserve estimation.
At How, WSP applied resource classification based on the following criteria:
| — | Distance to diamond drill holes |
| — | Confidence in geological interpretation |
| — | Data quality |
| Project No PS229049 | WSP |
| How Mine | March 2026 |
| S-K 1300 Technical Report Summary | Page 75 |
| Namib Minerals |
All areas of mineralisation which displayed strong geological continuity and understanding and are informed by diamond drill spacing better than 15 x 15m are considered to have sufficient confidence in the grade continuity between intercepts to apply Measured Resource classification.
All areas of mineralisation which displayed good geological continuity and understanding and are informed by diamond drill spacing better than 25 x 25m are considered to have sufficient confidence in the grade continuity between intercepts to apply Indicated Resource classification.
All areas of mineralisation which displayed reasonable geological continuity and understanding and are informed by diamond drill spacing greater than 25 x 25m, or areas which are informed by sludge and channel sampling only are considered to have sufficient confidence in the grade continuity between intercepts to apply Inferred Resource classification.
Classification wireframes were delineated in plan sections and applied to the model to ensure a smoothed classification across the deposit. The current classification status reflects the level of understanding of geological continuity and mineralisation at this stage of the project and is considered an appropriate classification. A long section view of classification is shown in Figure 11.31.
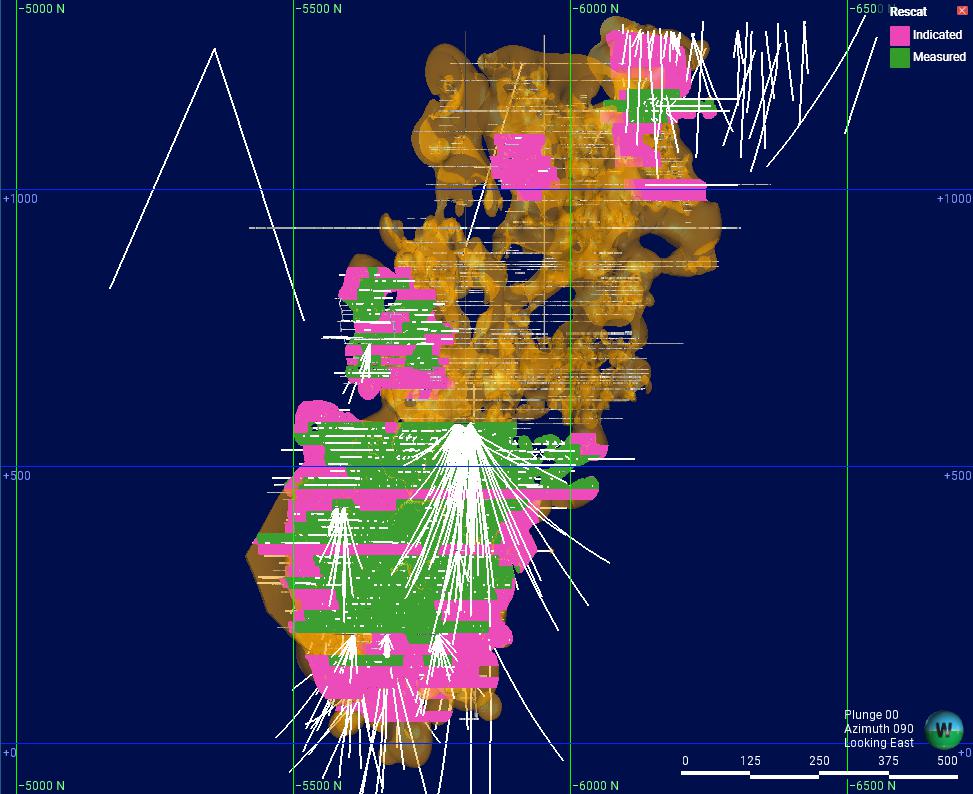
| Figure 11.31 | Long section view looking East showing Measured (green) and Indicated (pink) blocks and diamond drill hole traces in white. Material outside of these areas but within the orange estimation domain are classified Inferred. |
| Project No PS229049 | WSP |
| How Mine | March 2026 |
| S-K 1300 Technical Report Summary | Page 76 |
| Namib Minerals |
| 11.11 | Cut-off grade, price, and justification |
WSP initially calculated the break-even cut-off (BECOG) and the marginal cut-off (MCOG) values based on a Mineral Reserve gold price of US$3,272 per ounce. This was based on average of the trailing 2-year average gold price (CY2024 and CY2025) and the forecast 2026 gold price.
WSP was provided the latest pay limit (and cut-off) worksheet from December 2025. WSP reviewed the input costs data against the latest HGM supplied cost estimates and updated the gold prices to obtain the BECOG of 0.96 g/t gold (0.75 g/t pay limit) shown below in Table 11.11 and the MCOG of 0.6 g/t gold (0.35 g/t pay limit) shown below in Table 11.12.
For the Mineral Resource cut-off specific estimates WSP included a premium of 10% resulting in a gold price of US$3,600 per ounce.
The MCOG, the basis for the Mineral Resource, was then recalculated utilising the adjusted gold price of $US3,600.
Please note that as silver is not included in the block model, and contributes very minor revenues to the mine overall, WSP chose to remove silver revenue from both the COG calculations and the economic analysis.
The adjusted MCOG for both the underground and tailings is shown in Table 11.12.
Table 11-11 BECOG Calculation
| MINING BECOG Calculation | |
| Cost/Tonne Milled (cost of production) | 79.18 |
| Gold Price (US$ per oz) | 3,272 |
| Required Recovery (Pay Limit) g/t | 0.75 |
| Residue (0.23g/t) | 0.23 |
| APF (102.1%) | 1.02 |
| Final BECOG (g/t) | 0.96 |
Table 11-12 MCOG Calculation
| MINING MCOG Calculation | |
| Cost/Tonne Milled ($ per ton) | 36.86 |
| Gold Price (US$ per oz) | 3,272 |
| Pay Limit (g/t) | 0.35 |
| Residue | 0.23 |
| Final Paylimit (g/t) | 0.60 |
| Project No PS229049 | WSP |
| How Mine | March 2026 |
| S-K 1300 Technical Report Summary | Page 77 |
| Namib Minerals |
Table 11-13 December 2025 Mineral Resource conversion parameters
| Parameter | Mineral Resources (ROM) | Tailings (Sands) |
| MCOG (g/t) | 0.55 | 0.64 |
| Plant Residue Value (g/t) | 0.23 | 0.46 |
| Direct Operating Cost (C1) (US$ per ton) | 36.86 | 20.54 |
| Specific Gravity (tons per cubic metre) | 2.80 | 1.60 |
| Gold Price +10% (US$ per oz) | 3,600 | 3,600 |
| Silver Price | NA | NA |
| Silver Price +10% | NA | NA |
Notes: Applied COGs are based on a marginal cost analysis assuming direct operating costs only. No Silver credits are applied.
| 11.12 | Reasonable prospects for eventual economic extraction |
Stope optimisation was conducted using Datamine’s Mineable Shape Optimiser (MSO) software to determine the extent of the Mineral Resource with ‘reasonable prospects for economic extraction (RPEE)’ by underground mining methods. It should be noted that the optimisation results were used exclusively to assess the reasonable prospects of eventual economic extraction by underground mining methods and do not represent an attempt to estimate mineral reserves.
Model blocks contained within the conceptual MSO shapes shown in Figure 11.32 are considered to meet reasonable prospects for eventual economic extraction. Using the stope optimisation parameters listed in Table 11.14, a break-even cutoff grade of 0.6g/t Au was calculated. The preliminary MSO shapes were reviewed for the ability to be safely extracted including the proximity to blasted ground, proximity to existing rib and sill pillars and their proximity to mined voids. Any preliminary MSO shapes that could not be expected to be reasonably extracted safely were considered sterilised and removed from the final Mineral Resource inventory.
| Project No PS229049 | WSP |
| How Mine | March 2026 |
| S-K 1300 Technical Report Summary | Page 78 |
| Namib Minerals |
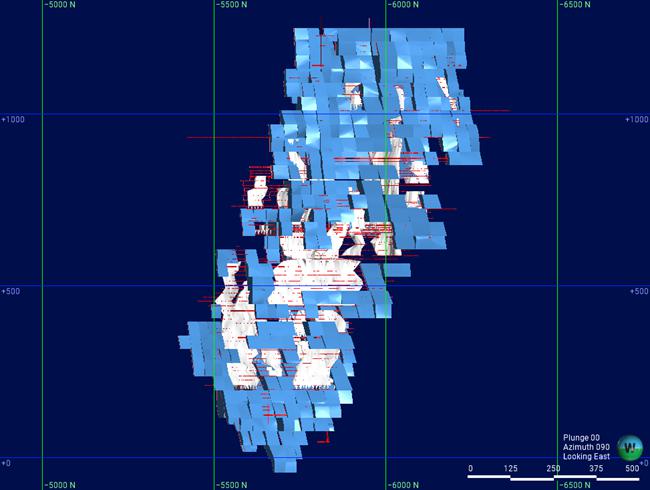
Figure 11.32 Long section view looking East showing RPEEE stopes in blue with existing stopped out areas in white
Table 11-14 Stope optimisation parameters for How Mineral Resource
| Parameter | Assumptions used in the Optimisation |
| Gold Price (USD/oz) | $3,600 |
| Total Production Cost (USD/t) | $79.18 |
| Metallurgical Recovery (%) | 89% |
| TCRC of Au (USD/oz) | $0.03 |
| Payability (%) | 84.5% |
| Royalties (%) | 5% |
| Cut-off Grade | 0.6 g/t (rounded up) |
| Minimum Mining Width | 3.5m |
| Project No PS229049 | WSP |
| How Mine | March 2026 |
| S-K 1300 Technical Report Summary | Page 79 |
| Namib Minerals |
| 11.13 | Mineral Resources statement |
The Mineral Resource for the How Gold Project as of the 31st December 2025 is provided in Table 11.15.
To determine the quantities of material offering reasonable prospects of eventual economic extraction by an underground mining method, WSP established a reasonable cut-off grade using a gold price of USD$3,600/oz and an overall metallurgical recovery of 89%.
The mineral resource is reported within Mineable Stope Optimiser shapes generated at a cut-off grade 0.6 g/t Au and is inclusive of material below 0.6 g/t Au within these shapes.
Table 11-15 How Gold Project, Mineral Resource Estimate, exclusive of Mineral Reserves – 31 December 2025
| Classification | Tonnes (Mt) | Grade (g/t) | Ounces (koz) |
| Measured | 13.7 | 1.32 | 583 |
| Indicated | 10.2 | 1.41 | 463 |
| (M+I) | 23.9 | 1.36 | 1,046 |
| Inferred | 31.0 | 2.18 | 2,176 |
| — | Mineral Resources are not Mineral Reserves and have no demonstrated economic viability |
| — | The Mineral Resource estimate was prepared by Kate Kitchen, MAIG of WSP who is a Qualified Person as defined by S-K 1300. |
| — | Totals may not add up due to rounding |
| — | Resources are reported within Mineable Stope Optimiser shapes generated at a cut-off grade of 0.6 g/t Au and is inclusive of material below 0.6 g/t Au within those shapes. |
The basis of the Property’s Mineral Resources estimate and how it is generated are summarised below. The Mineral Resources estimate for the Property is reported herein in accordance with the requirements detailed in S-K 1300. For estimating the Mineral Resources, the following definition of Mineral Resource as set forth in S-K 1300 is applied:
“Mineral resource is a concentration or occurrence of material of economic interest in or on the Earth’s crust in such form, grade or quality, and quantity that there are reasonable prospects for economic extraction. A mineral resource is a reasonable estimate of mineralisation, taking into account relevant factors such as cut-off grade, likely mining dimensions, location or continuity, that, with the assumed and justifiable technical and economic conditions, is likely to, in whole or in part, become economically extractable. It is not merely an inventory of all mineralisation drilled or sampled.”
The Mineral Resources estimate (exclusive of Mineral Reserves) for the Property is presented in Table 11.16, Table 11.17, and Table 11.18. Mineral Resources are reported on an in-situ basis with an effective date of 31 December 2025.
Table 11.16 presents the underground Measured and Indicated Mineral Resources (exclusive of Mineral Reserves) reported as at 31 December 2025.
Table 11-16 HGM underground Measured and Indicated Mineral Resources estimate as at 31 December 2025
| Category | Tonnage (Mt) | Au Grade (g/t) | Au Metal (koz) |
| Underground | |||
| Measured Resources | 13.7 | 1.32 | 583 |
| Indicated Resources | 10.2 | 1.41 | 463 |
| Grand Total | 23.9 | 1.36 | 1,046 |
Notes: Mt = Million tonnes; Au Grade g/t = gold grams per tonne; koz = thousand ounces.
Table 11.17 presents the underground Inferred Mineral Resources (exclusive of Mineral Reserves) reported as at 31 December 2025.
| Project No PS229049 | WSP |
| How Mine | March 2026 |
| S-K 1300 Technical Report Summary | Page 80 |
| Namib Minerals |
Table 11-17 HGM underground Inferred Mineral Resources estimate as at 31 December 2023
| Category | Tonnage (Mt) | Au Grade (g/t) | Au Metal (koz) |
| Underground | |||
| Inferred Resources | 31.0 | 2.18 | 2,176 |
| Grand Total | 31.0 | 2.18 | 2,176 |
Notes: Mt = Million tonnes; Au Grade g/t = gold grams per tonne; koz = thousand ounces.
Table 11.18 presents the sands (tailings) Inferred Mineral Resources (exclusive of Mineral Reserves) reported as at 31 December 2025.
Table 11-18 HGM sands (tailings) Inferred Mineral Resources estimate as at 31 December 2025
| Category | Tonnage (Mt) | Au Grade (g/t) | Au Metal (koz) |
| Sands (Tailings) | |||
| Inferred Resources | 12.0 | 0.59 | 220 |
| Grand Total | 12.0 | 0.59 | 220 |
Notes: Mt = Million tonnes; Au Grade g/t = gold grams per tonne; koz = thousand ounces.
The Mineral Resources presented in this Section are not Mineral Reserves, and do not reflect demonstrated economic viability. The reported Inferred Mineral Resources are considered too speculative geologically to have the economic considerations applied to them that would enable them to be categorised as Mineral Reserves. There is no certainty that all or any part of this Mineral Resource will be converted into Mineral Reserve.
All figures are rounded to reflect the relative accuracy of the estimates and totals may not add correctly.
Based on the geological results presented in this TRS, it is the QP’s opinion that the Mineral Resources have RPEE.
| 11.14 | Uncertainty in the estimates of Inferred, Indicated, and Measured Mineral Resources |
The QP is satisfied that the stated Mineral Resources classification reflects the appropriate level of confidence and considers all factors relevant to the deposit. The application of resource categories appropriately considers the relevant factors used in the classification process.
Some examples of specific factors that can influence the risk and uncertainty of the Mineral Resources estimates that are considered in the resource classification include:
| — | Interpretation of the mineralisation boundary. |
| — | Drill hole spacing and adequacy in defining geology, mineralisation, structure, and grade. |
| — | Quality of samples, assays, and geological information. |
| — | The Mineral Resource has addressed RPEE, and considers mining, metallurgical, and environmental factors. |
The Mineral Resource estimate has been estimated to two decimal places for gold grade, and to the nearest tonne for tonnage, however has been reported to two decimal places for gold grade, to the nearest thousand ounce for metal content and to the nearest thousand tonne for tonnage when reported in summary tables in this report.
Mineral Resources confidence is also assessed via internal peer reviews conducted at key stages of the Mineral Resources estimation process.
| Project No PS229049 | WSP |
| How Mine | March 2026 |
| S-K 1300 Technical Report Summary | Page 81 |
| Namib Minerals |
The Mineral Resource presented is not a Mineral Reserve, and does not reflect demonstrated economic viability. The level of geological uncertainty associated with the reported Inferred Mineral Resources is considered too speculative to apply relevant economic, and technical factors to have the economic considerations applied that would enable these to be categorised as Mineral Reserves. There is no certainty that all or any part of the Inferred Mineral Resources will be converted into Mineral Reserves. All figures are rounded to reflect the relative accuracy of the estimates and totals may not sum exactly as a consequence.
| 11.15 | QP’s opinion on factors likely to influence the prospect of economic extraction |
The main factors likely to influence the prospect of economic extraction include:
| — | Orebody definition. |
| — | Assigned dry Bulk Density. |
| — | Commodity pricing. |
| — | Interpretations of additional fault geometries, particularly deeper in the mine where less drilling currently exists. |
The estimates of Mineral Resources may be materially affected by environmental, permitting, legal, title, socio-political, marketing, or other relevant issues including risks set forth in this TRS.
In the QP’s opinion, all of these factors are adequately considered for the Mineral Resource reported. Based on the body of technical studies completed across the Property, it is the QP’s opinion that the Mineral Resource has RPEE.
In the QP’s opinion, all issues relating to all relevant technical and economic factors likely to influence the prospects for economic extraction, can be resolved with the recommendations for further work outlined in Section 23.1.
| Project No PS229049 | WSP |
| How Mine | March 2026 |
| S-K 1300 Technical Report Summary | Page 82 |
| Namib Minerals |
| 12 | Mineral Reserve Estimate |
| 12.1 | Key inputs, assumptions, parameters, and methods |
How Gold Mine (HGM) supplied the following electronic data:
| — | Previous (CY2024) Mineral Reserve stope solids. |
| — | Previous (CY2024) Mineral Resource stope solids. |
| — | As-built development solids as at December 2025. |
| — | Void solids for stoping depletion purposes as at December 2025. |
| — | Additional stoping solids showing stoping inclusions since the last MRE in CY2024. |
| — | The current life of mine plan mining schedule, in Microsoft Excel, as at September CY2025. |
| — | The cut-off grade (and pay calculator) worksheet that allows calculation of the break even and marginal cut off grades, updated for CY2025. |
| — | The current CY2026 life of mine plan dynamic financial model. |
In addition to the WSP generated block model this data pack contains all required inputs for the updated CY2025 Mineral Reserve estimate.
To begin WSP reviewed the macroeconomic inputs used for the previous MRE (CY2024), and the current HGM budget forecast, and assessed the values against forecast metal price data from S&P Global.
Based on this work WSP considers a gold price of US$3,272.00 to be appropriate for the CY2025 MRE, based on the averaged gold price from CY2024, CY2025, and the forecast CY2026 gold price.
In continuance of previous practice WSP considers that a 10% premium on this price, totally US$3600 per ounce to be appropriate for the Mineral Resource estimate.
Key assumptions for Mineral Reserve estimation are provided in Table 12.1.
Table 12-1 Estimation parameters
| Parameter | US$/t | Comments |
| Total production costs | 79.18 | Supplied by site and reviewed by WSP. Used for the COG calculations. Please note that the economic analysis utilises discrete calculated monthly production costs. Inclusive of sustaining and indirect costs. |
| Total variable costs | 36.86 | Supplied by site and reviewed by WSP. Utilised for marginal cut-off calculations. Inclusive of sustaining costs. |
| Total fixed costs | 42.32 | Supplied by site and reviewed by WSP. Inclusive of indirect costs. |
| Gold Price | US$3,272/oz | WSP considers a gold price of US$3,272.00 to be appropriate for the CY2025 MRE, based on the averaged gold price from CY2024, CY2025, and the forecast CY2026 gold price. |
| Silver Price | NA | WSP has chosen not to include silver revenue due to the lack of visibility in the block model and the minor role the previous silver estimates contributed to the economic analysis. |
| Project No PS229049 | WSP |
| How Mine | March 2026 |
| S-K 1300 Technical Report Summary | Page 83 |
| Namib Minerals |
| 12.2 | Cut-off grade estimate |
WSP initially calculated the break-even cut-off (BECOG) and the marginal cut-off (MCOG) values based on a Mineral Reserve gold price of US$3,272 per ounce. This was based on average of the trailing 2-year average gold price (CY2024 and CY2025) and the forecast 2026 gold price.
WSP was provided the latest pay limit (and cut-off) worksheet from December 2025. WSP reviewed the input costs data against the latest HGM supplied cost estimates and updated the gold prices to obtain the BECOG of 0.96 g/t gold (0.75 g/t pay limit) shown below in Table 12.2 and the MCOG of 0.6 g/t gold (0.35 g/t pay limit) shown below in Table 12.3.
The MCOG, the basis for the Mineral Resource, was then recalculated utilising the adjusted gold price of $US3,600.
Please note that as silver is not included in the block model, and contributes very minor revenues to the mine overall, WSP chose to remove silver revenue from both the COG calculations and the economic analysis.
Table 12-2 BECOG Calculation
| MINING BECOG Calculation | |
| Cost/Tonne Milled (cost of production) | 79.18 |
| Gold Price (US$ per oz) | 3,272 |
| Required Recovery (Pay Limit) g/t | 0.75 |
| Residue (0.23g/t) | 0.23 |
| APF (102.1%) | 1.02 |
| Final BECOG (g/t) | 0.96 |
Table 12-3 MCOG Calculation
| MINING MCOG Calculation | |
| Cost/Tonne Milled ($ per ton) | 36.86 |
| Gold Price (US$ per oz) | 3,272 |
| Pay Limit (g/t) | 0.35 |
| Residue | 0.23 |
| Final Paylimit (g/t) | 0.60 |
| Project No PS229049 | WSP |
| How Mine | March 2026 |
| S-K 1300 Technical Report Summary | Page 84 |
| Namib Minerals |
Table 12.4 summarises the COG calculations and other key inputs.
Table 12-4 Additional key parameters
| Parameter | Mineral Reserves (ROM) |
Comment |
| Pay-Limit Grade (BECOG Au g/t) | 0.75 | Costs supplied and reviewed by WSP. Pricing represents the average 2-year trailing average and current CY2026 forecast price totalling US$3,272. |
| Cut-off Grade (BECOG Au g/t) | 0.96 | Costs supplied and reviewed by WSP. Pricing represents the average 2-year trailing average and current CY2026 forecast price totalling US$3,272. To calculate the COG from the pay limit the residue (0.23 g/t lost) and the APF is applied. |
| Pay-Limit Grade (MCOG Au g/t) | 0.35 | As for the BECOG pay limit however only the variable mining and processing costs are applied in addition to transport, sales and royalties. The same calculated US$3,272 gold price is applied. |
| Cut-off Grade (MCOG Au g/t) | 0.60 | As for the BECOG however only the 0.23 g/t residue is applied, not the APF. |
| Exchange Rate | 1:25.5 USD/ZiG | Revenue paid 70% USD and 30% ZiG local currency. Local inflation rate running at 4.1% (Jan 2026). |
| Tonnage for Pay-Limit (t) | 58,050 | Estimated throughput for fixed and variable cost components. |
| Dry In Situ Density (t/m3) | 2.8 | Average estimation to one decimal place. |
| Assay Plan Factor (APF) | 102.1% | 3-year trailing monthly average. No historical average MCF estimated for Sands treatment. |
| Block Factor (BF) | 98% | 3-year trailing monthly average. No historical average MCF estimated for Sands treatment. |
Notes: Metal content (oz) is in Troy ounce unit and the conversion is one troy ounce equal to 31.10348 g. Ore tonnages are reported on a dry basis. Recent inspection in February 2026 indicates that the mine is relatively dry. Density estimates are applied at one significant decimal place. WSP recommends estimating average densities either by interpolation within the resource model by lithology or by reconciliation to derive an average dry density estimate to two significant decimal places.
| 12.3 | Metallurgical and processing recoveries |
HGM advised that a metallurgical recovery of 89.0% is applicable based on historical and planned performance. WSP has used this figure as it correlates with the historical data provided, and is reasonable, however WSP has not conducted any metallurgical test work to verify the metallurgical estimate.
| 12.4 | Modifying factors |
The conventional methodology applied to estimate dilution and ore loss is as follows:
| — | The raw diluted tonnage and grade are reported within the stope and development wireframes from the Mineral Resource model. |
| — | Mineral Resource tonnage and grade by pay limit cut-off grade (0.6 g/t Au) are reported within the same designs, excluding dilution. |
| — | The Mineral Reserve Block Estimates are then calculated by assuming the same diluted tonnage and by multiplying the diluted Reserve Estimate grade by the APF (102.1%) and BF (98.0%), a combined factor (MCF) of 100.1%. |
| — | Final stope block grades are checked to ensure it exceeds the 0.96 g/t pay limit in order to qualify for inclusion as Mineral Reserves. Stopes below the BECOG of 0.96 g/t and above the MCOG of 0.6 /t are included where hoisting and/or milling capacity exists within the Mineral Reserve only life of mine duration. These stopes are also considered a Mineral Reserve where they do not extend the mine life and thus incur the fixed costs in addition to their variable cost. |
| Project No PS229049 | WSP |
| How Mine | March 2026 |
| S-K 1300 Technical Report Summary | Page 85 |
| Namib Minerals |
The calculation of the mine call tonnage-grade factors is described as follows:
| — | An Assay Plan Factor (APF) of 102.1% was estimated as an average over the last three years of operation (January 2023 – December 2025). This factor is the equivalent of a MCF, based on the gold content and not grade per se. It is defined as the relationship between gold accounted for (bullion plus residue at the plant) versus gold “called for” by the mine’s measurement and evaluation method. This factor is also incorporated into the pay limit calculation. It is calculated as follows: |
APF = Mineral
content accounted for from ore treated (recovery + residue) x 100%
Mineral content called for based on current sampling
| — | A Block Factor (BF) of 98.0% was estimated as an average over the last three years of operation (January 2023-December 2025, for monthly averages within +/- 10% range). It is defined as the ratio of the contained gold of the ore broken from a Mineral Reserve block as indicated by current sampling results versus the estimated Mineral Reserve block gold content. |
BF = Current
sampling contents x 100%
Estimated block contents
| — | An overall Block Call Factor (BCF) has been estimated as a multiple of the APF and BF where: |
BCF = Block Factor x Assay Plan Factor x 100%
| — | This gives rise to an overall call factor of 100.1% (98.0% x 102.1%) that was applied for estimation of the 31 December 2025 Mineral Reserve. |
Currently the modifying factors are calculated for the depleted material (MR + MII + pillars recovered), the break (broken ore in development and stoping), the mill feed (hoist plus stockpiles) and the reconciled mill production, whereby:
APF = Hoist
plus Stockpile Feed (recovery + residue) x 100%
Reconciled Mill Feed
BF = Break
x 100%
Depleted Inventory (MR + MII + pillars recovered)
Additionally, a practical stoping extraction recovery of 90% has been used for all stopes excepting any stopes adjoining a sill or significant void. These stopes have individually reduced recoveries (in the electronic mining schedule) ranging from 5% to 60%.
A practical 97% surface stockpile recovery figure has also been utilised for the Dam #3 and Dam #4 sands Mineral Reserve.
| 12.5 | Mineral Reserve classification |
| 12.5.1 | Proved Mineral Reserves |
A Proved Mineral Reserve block is derived from the Measured Mineral Resource with the application of cut-offs of 0.96 g/t Au and 0.6 g/t where applicable, and the applications of the relevant modifying factors.
Dilution is applied as a 0.5 m failure envelope on the hangingwall and footwall around Measured Mineral Resource, by means of an expanded stope wireframe.
Sill, crown, and cone pillar tonnages are removed by stope block but retained in the sub-category of Measured and Indicated Mineral Resources.
Rib pillar tonnages are removed from the stope block and not classified as Mineral Reserves, since there is no intention to recover these pillars.
| Project No PS229049 | WSP |
| How Mine | March 2026 |
| S-K 1300 Technical Report Summary | Page 86 |
| Namib Minerals |
| 12.5.2 | Probable Mineral Reserves |
A Probable Mineral Reserve block is derived from the Indicated Mineral Resource with the application of cut-offs of 0.96 g/t Au and 0.6 g/t where applicable, and the applications of the relevant modifying factors.
Dilution is applied as a 0.5 m failure envelope on the hangingwall and footwall around Indicated Mineral Resource, by means of an expanded stope wireframe.
Sill, crown, and cone pillar tonnages are removed by stope block but retained in the sub-category of Measured and Indicated Mineral Resources.
Rib pillar tonnages are removed from the stope block and not classified as Mineral Reserves, since there is no intention to recover these pillars.
| 12.6 | Mineral Reserve estimate |
| 12.6.1 | Mineral Reserve statement |
The Mineral Reserves have been defined, classified and reported according to the guiding principles and minimum standards set out in S-K 1300.
The WSP QPs are satisfied that there has been sufficient standard of evaluation to support estimation of a Mineral Reserve that has been demonstrated to be technically and economically viable.
This is based on the extractable (90% recovered) portion adjusted for the average MCF applied to grade (100.1%), reflecting both plan dilution and positive reconciliation as a 3-year trailing average excluding outliers (+10%) as at end December 2025. Mineral Reserves are reported on a plant feed basis, inclusive of dilution and ore loss modifying factors, assuming a gold metallurgical recovery of 89.0%.
The Mineral Reserve estimate is based on Proved and Probable material only, delineated by Datamine’s MSO software, that has been deemed to be economically viable through industry accepted mine planning practices. The economic basis for the Mineral Reserve is based on detailed financial modelling of the Mineral Reserve only mine plan.
Please note that the HGM strategic LOM plan is a combination of the Mineral Reserve only mine plan with the addition of Inferred material that has been assessed to be safely and economically extractable within the parameters of the current mine design.
Further Inferred material may be able to be added to the HGM strategic LOM plan once a strategic LOM is completed. Please note that such a study is outside the purview of the requirements to generate this report.
| Project No PS229049 | WSP |
| How Mine | March 2026 |
| S-K 1300 Technical Report Summary | Page 87 |
| Namib Minerals |
Table 12.5 presents the HGM Mineral Reserves estimate as at 31 December 2025.
Table 12-5 Mineral Reserves estimate as at 31 December 2025
| Category | Tonnage (Mt) | Au Grade (g/t) | Au Metal (koz) | % Contribution |
| Underground | ||||
| Proved Reserve | 1.08 | 1.40 | 48 | 47% |
| Probable Reserve | 0.52 | 1.70 | 28 | 27% |
| Total Proved & Probable | 1.60 | 1.50 | 77 | 75% |
| Surface | ||||
| Probable Reserve | 0.89 | 0.89 | 26 | 25% |
| Grand Total | 2.49 | 1.29 | 103 | 100% |
Notes: UG = Underground, SF = Surface Stockpile Dam 3 and 4.
| 12.6.2 | Life of mine strategic plan |
The HGM strategic LOM plan includes the stated Mineral Reserves in addition to the Inferred material as noted below in Table 12-6.
Table 12-6 Inferred Mineral Resources included in the life of mine plan as at 31 December 2025
| Category | Tonnage (Mt) | Au Grade (g/t) | Au Metal (koz) |
| Underground | |||
| Inferred Resources | 4.03 | 1.59 | 206 |
| Grand Total | 4.03 | 1.59 | 206 |
The estimates are rounded to reflect the order of accuracy, to the nearest ten thousand tonnes (10 kt) for tonnage, to two decimal places for grade, and to the nearest thousand ounces (koz) for contained gold. Estimates are prepared carrying relevant decimal place accuracy to derive subtotals and totals that are subsequently rounded. Minor rounding errors may occur as a result.
| Project No PS229049 | WSP |
| How Mine | March 2026 |
| S-K 1300 Technical Report Summary | Page 88 |
| Namib Minerals |
| 12.7 | QP’s opinion on risk factors that may materially affect the Mineral Reserve estimates |
The main factors likely to materially affect the Mineral Reserve estimates include:
| — | Resource definition and variability. |
| — | Gold price and process recovery. |
| — | Unit operating costs. |
| — | Increased ground stress and mining induced stresses with depth with implications for recovery, ore loss and dilution. |
| — | Increased provision for dilution and ore loss as impacted by ground conditions, pillar requirements, mining accuracy and efficiency. |
| — | Increased mining and materials handling costs at depth due to conditions and increased rehandling through the internal shaft system. |
| — | Potentially increased risk to personnel and ground support requirements at depth. |
The estimates of Mineral Reserves may also be materially affected by environmental, permitting, legal, title, socio-political, marketing, or other relevant issues including risks set forth in this TRS.
In the QP’s opinion, all of these factors are adequately considered for the Mineral Reserves reported. Based on the body of technical studies completed across the Property, it is the QP’s opinion that the Mineral Reserves are both technically and economically viable.
| Project No PS229049 | WSP |
| How Mine | March 2026 |
| S-K 1300 Technical Report Summary | Page 89 |
| Namib Minerals |
| 13 | Mining methods |
| 13.1 | Introduction |
The HGM is an underground rail mine in active operation using sub-level open stoping underground techniques, generally as per Figure 13.1, with annual production rate for 2025 of 476 kt for 25,004 contained oz of gold. Two vertical shafts (North and Main Shaft) are used to access the relatively steeply dipping (80°) orebody on approximately 10 – 12m level intervals. The North Shaft hoists ore only (to a depth of 925 m), while the Main Shaft is dedicated to personnel and material movement. An additional internal shaft (16N7 Shaft) extends to 34L and currently supports operations to the 32L loading level.
Sublevels are developed on approximately 10–12 m intervals and mined on retreat by adopting underhand/long-hole open stoping methods using sub-level breaking into a common slot. Broken ore is collected in draw-points or boxes. Cone levels (extraction draw cones) are developed to 8 to 10 m above haulage drives, and sub-levels are developed above the cone drives at approximately 10–12 m intervals. Drilling and blasting are conducted by retreating from a central slot to rib pillars or other demarcated points by downhole (underhand) and uphole (overhand) drilling.
The current mining method has been utilised for many years and WSP has not considered any changes to the mining method for the MRE.
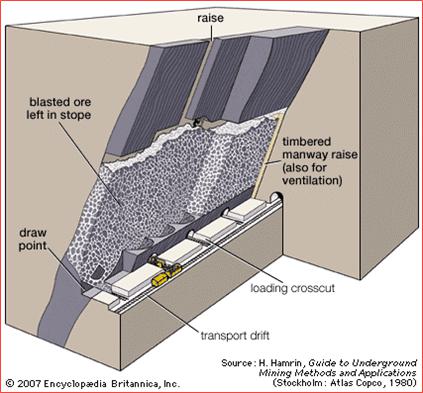
| Figure 13.1 | Figure showing general mining method (Mining – blasthole stoping, ore extraction, drilling | Britannica) |
| Project No PS229049 | WSP |
| How Mine | March 2026 |
| S-K 1300 Technical Report Summary | Page 90 |
| Namib Minerals |
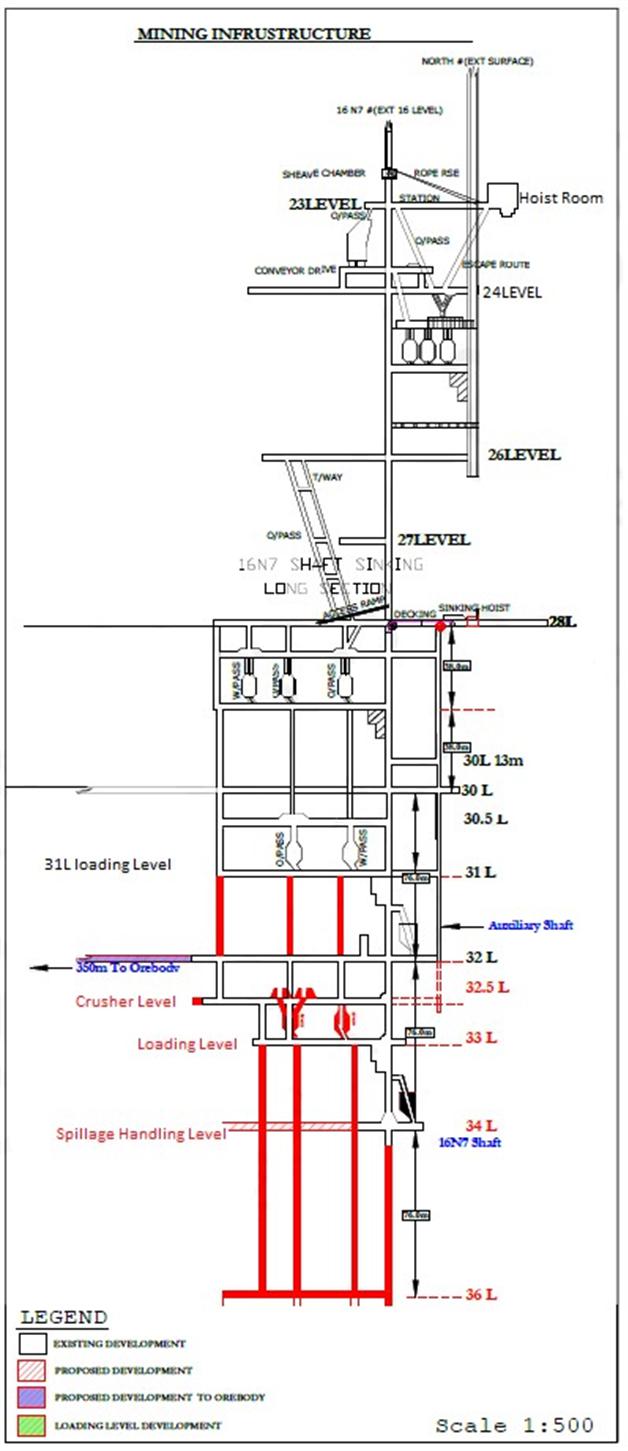
| Figure 13.2 | HGM underground mining infrastructure end 2025 |
| Project No PS229049 | WSP |
| How Mine | March 2026 |
| S-K 1300 Technical Report Summary | Page 91 |
| Namib Minerals |
Table 13-1 HGM shaft collars and depths
| Shaft | Collar (amsl) | Depth (metres below Surface) | Level | Description |
| North Shaft | 1286.7 | 940 | 26L | Main Rock Winder to surface |
| Main Shaft | 721.7 | 565 | 16L | Man riding shaft from surface |
| South Shaft (Raise bore) | 575.7 | 711 | 20L | Abandoned shaft from surface |
| 16N7 | 718.7 | 1244 | 34L | Sub-level shaft with both rock and man riding compartments |
| Auxiliary | 271.5 | 1168 | 34L | Sub-level shaft from 28L for shaft sinking |
| Winze 1 | 271.5 | 1168 | 34L | Sub-level winze from 30L.Used for blocking out to speed sub-level development |
| Winze 2 | 271.5 | 1168 | 34L | Sub-level winze from 30L.Used for blocking out to speed sub-level development |
| 13.2 | Parameters relevant to the design and schedule |
| 13.2.1 | Geotechnical |
The HGM Technical Services Department includes a Geotechnical Engineer that is responsible for geotechnical ground characterization; underground support design; mining layouts geotechnical optimization; geotechnical instrumentation; geotechnical monitoring and numerical modelling for ground stability. In addition to these responsibilities, the geotechnical engineer advises HGM management on ground control and support installation practices, including the ground control management plan (GCMP); ground support quality control; mining sequencing; blast design and blasting practices as they affect strata control. Previously, HGM management was guided by external geotechnical consultants for geotechnical services. The Geotechnical Engineer is still supported by geotechnical consultants however, this support is mainly in the form of auditing and as third-party participants. The most recent independent review of HGM was completed by Vaughan & Esterhuizen in (2024).
The 2024 independent review by Vaughan & Esterhuizen (2024) list several recommendations. While careful consideration should be given to the recommendations that would improve the health and safety of the workforce, for the purposes of this review only four are considered to have potential to materially affect the mining economics by either materially affecting the production schedule or increasing mining cost and HGM’s response is noted below:
| — | Water ingress: Water ingress into the shaft has been managed by proactively identifying sources of water and implementing controlled preventative flow measures to divert water away from the shafts. Surface drainage rehabilitation work has been completed, and weekly monitoring is being carried out. Support work is ongoing, and identified critical sections have since been fully supported using combination of both primary and secondary support elements. |
| — | Update rock properties data from deeper areas of the mine: The latest rock properties data was conducted in 2023. Efforts are underway to submit up-to-date samples in CY2026 for better estimation and increasing confidence in mining outcomes. |
| Project No PS229049 | WSP |
| How Mine | March 2026 |
| S-K 1300 Technical Report Summary | Page 92 |
| Namib Minerals |
| — | Increase draw point spacings below 1400 mbs (meters below surface): Revisions to the draw point pillar design for areas between 1400mbs and 2000mbs were adopted and incorporated into the COP and GCMP. The stability of draw point pillars was validated using numerical modelling. Additional work is currently ongoing to evaluate the impact on extraction ratios. |
| — | A ground control management plan (GCMP) and support standards are to be drafted: The Code of Practice and Ground Control Management Plan documents were developed to align operational ground control practices with the current geotechnical model and mining geometries and are currently in use. As noted by WSP earlier in section 9.3 WSP has not reviewed the GCMP but has reviewed the Code of Practice. |
| 13.2.2 | Hydrogeological |
Hydrogeological consulting company, ZIVA was engaged in August 2024 for Hydrogeological studies and ground water surveys within the mining lease (ML 28). Their findings were consistent what the mine experiences underground where water is introduced into the mine for drilling purposes and there is minimum ground water found within the mine excavations.. Recent inspection in February 2026 confirms that the mine is relatively dry.
| 13.2.2.1 | Underground water supply |
The Mine has two water sources from which it draws service water, namely the Chimedza Dam and the How Mine Dam. Water is pumped from these sources onto three surface tanks (Jurassic Park, Main Shaft, and North Shaft) for surge capacity. The underground mining operations receive water from the Main Shaft tank. Water is delivered by way of gravity feed to underground dams in sequence on the 4L, 8L, and 14L.
| 13.2.2.2 | Underground dewatering |
The 20, 23, 26, 28, and 30 Levels are equipped with settling dams that collect muddy water from the work areas, settle the mud and pump to the nearest dam above that level. Stage pumping proceeds up to the 14 Level settling dam where it is recycled by transfer to the service water supply circuit. Periodically, the underground water tested for contamination beyond the prescribed and the water stage pumped to surface where required. In this manner, mine dewatering requirements are maintained at a very low level.
Concurrently, fresh water from the surface is fed to the 4 Level dam. The contaminated water from the underground mining operations is directed to the processing plant for use and transfer to the TSF.
Similarly, the processing plant recycles process water by pumping water back from the TSF for re-use. Water recycling ensures sustainability, since the mine is in a dry region with low rainfall.
| 13.3 | Production parameters |
| 13.3.1 | Production rates |
Current mining practice at the HGM takes advantage of the steep inclination of the orebodies (averaging 80°) and highly competent host rock. This allows the adoption of higher productivity open stoping either by uphole stoping, or underhand via downhole benching techniques from sub-levels established between the main levels.
Current production rate at HGM targets 650 ktpa broken.
| 13.3.2 | Expected mine life |
Mine life is expected to extend to 2029 (Proven and Probable only). Mine life inclusive of Inferred material could extend to 2034 at an average mining rate of approximately 600ktpa.
Considering the total mine extractable inventory comprising Proved and Probable Reserve and MII Resource classified extractable inventory, a total Mine Life of 4 years has been forecast. Mineral Reserves will be upgraded on an annual basis until current Mineral Resources are depleted.
| Project No PS229049 | WSP |
| How Mine | March 2026 |
| S-K 1300 Technical Report Summary | Page 93 |
| Namib Minerals |
| 13.3.3 | Mining model |
Datamine’s MSO software was used to generate mineable shapes based on the updated block model. The final Mineral Reserve estimate stoping inventory is a combination of:
| — | New MSO shapes, where previously there was no existing Mineral Reserve estimate inventory. |
| — | Updated existing Mineral Reserve estimate shapes (CY2024), where the original shapes were altered for practicality, proximity to voids and due to depletion. |
| — | Existing unaltered original Mineral Reserve estimate shapes (CY2024). |
| — | Please note that where existing shapes were kept in the updated Mineral Reserve estimate they were interrogated by the updated block model to confirm they remained above the updated cut-off. |
| — | Some stope shapes are located near sills and close to existing capital infrastructure. These stopes have had their recovery factors reduced to account for this. |
| — | The MSO created additional stopes below 32L have been scheduled towards the end of the mine life to allow the shaft and associated development to be in place prior to extraction. |
The key parameters for the MSO optimisation process are outlined below in Table 13-2.
Table 13-2 MSO parameters
| MSO Parameters | Value |
| Cut-off Grade | 0.60 g/t |
| Key Value Field | Au_OK |
| Density | As per block model value |
| Maximum Stope Height | 20.0 m |
| Maximum Stope Length | 20.0 m |
| Maximum Stope Width | 20.0 m |
| Minimum Stope Width | 4.0 m |
| Minimum Ore width of Stope | 3.0 m |
| Overbreak-Added (footwall and hangingwall respectively) | 0.5 m (total of 1m overbreak) |
| Inter Stope Minimum Waste Pillar | 10.0 m |
| Minimum Hangingwall Angle | 45 degrees |
| Minimum Footwall Angle | 45 degrees |
| Project No PS229049 | WSP |
| How Mine | March 2026 |
| S-K 1300 Technical Report Summary | Page 94 |
| Namib Minerals |
The resulting optimised MSO stoping inventory is shown below in Figure 13.3 and Figure 13.4 shows the MRE from CY2024 for comparison.
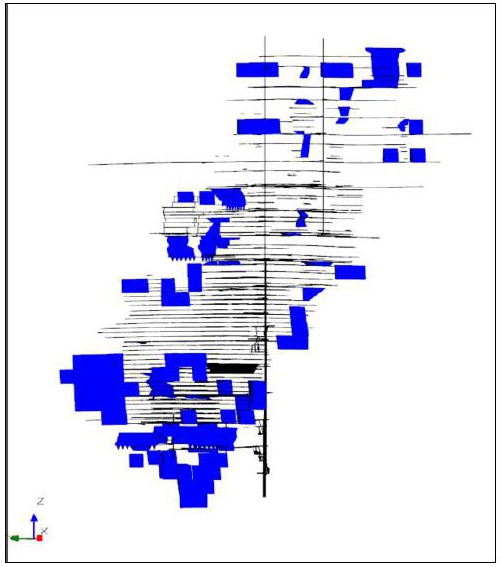
| Figure 13.3 | Updated CY2025 MRE MSO inventory looking east |
| Project No PS229049 | WSP |
| How Mine | March 2026 |
| S-K 1300 Technical Report Summary | Page 95 |
| Namib Minerals |
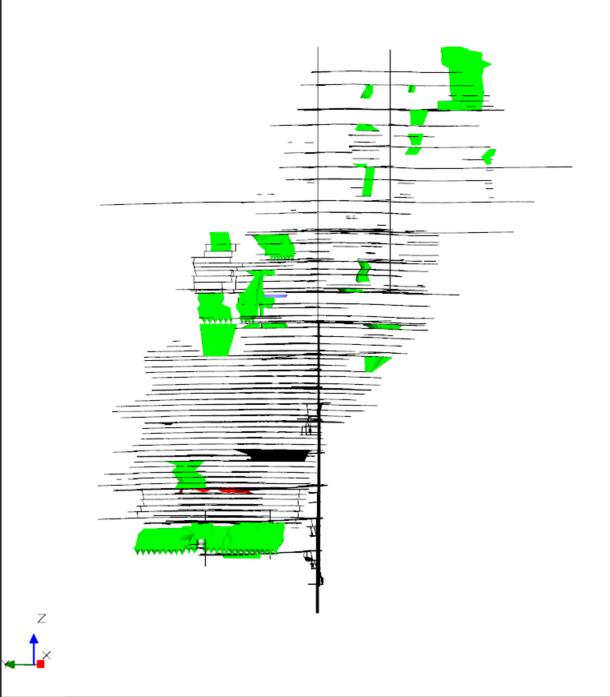
| Figure 13.4 | Previous CY2024 MRE stoping inventory looking east |
Once the stoping inventory was delineated WSP updated the mine design for lateral and vertical development required to extract all stopes above the cut-off grade. Datamine’s Studio UG software was used to create the updated mine design, updated in accordance with the current HGM mine design parameters.
Development drives through the stope shapes were depleted but not reported in the tonnages, this is in keeping with current HGM site practice
Please note that the existing mining schedule for the current HGM life of mine plan exists as an Excel based schedule only. Therefore, the client supplied development metres reported per period and per level has additional allowances, above the electronic development design strings, to allow stope extraction to take place such as allowances for stub and slot drives.
This is understood by WSP, and the decision was made to keep the client reported development metres for appropriate levels, in addition to the WSP updated development strings, as they exceed the updated electronic development total. While this may be considered slightly conservative WSP feels it is appropriate for the level of study and the requirements of the SK-1300 reporting standard.
| Project No PS229049 | WSP |
| How Mine | March 2026 |
| S-K 1300 Technical Report Summary | Page 96 |
| Namib Minerals |
Figure 13.5 and Figure 13.6 show the updated development and total mine design respectively.
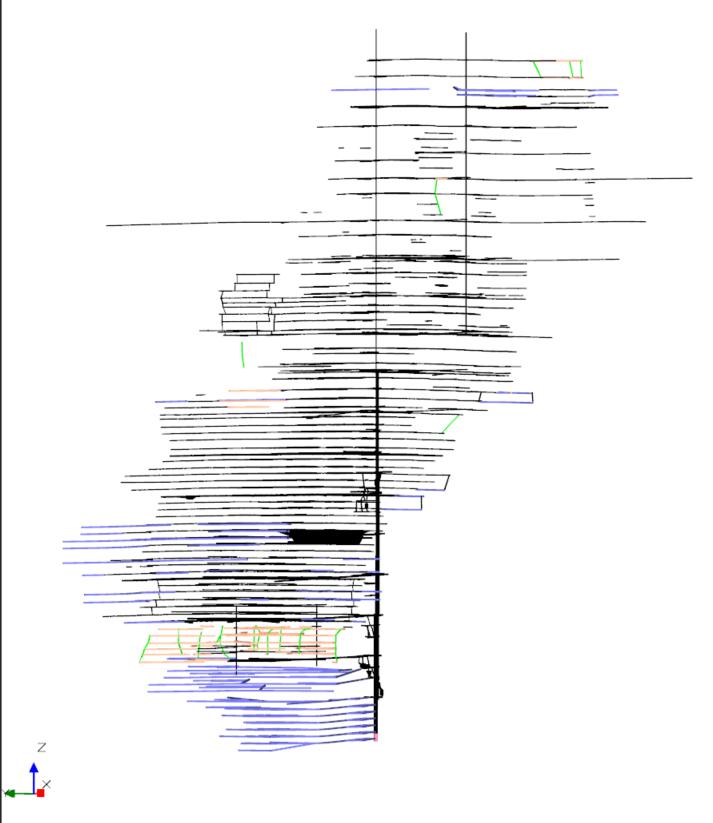
| Figure 13.5 | Updated lateral and vertical development looking east |
| Project No PS229049 | WSP |
| How Mine | March 2026 |
| S-K 1300 Technical Report Summary | Page 97 |
| Namib Minerals |
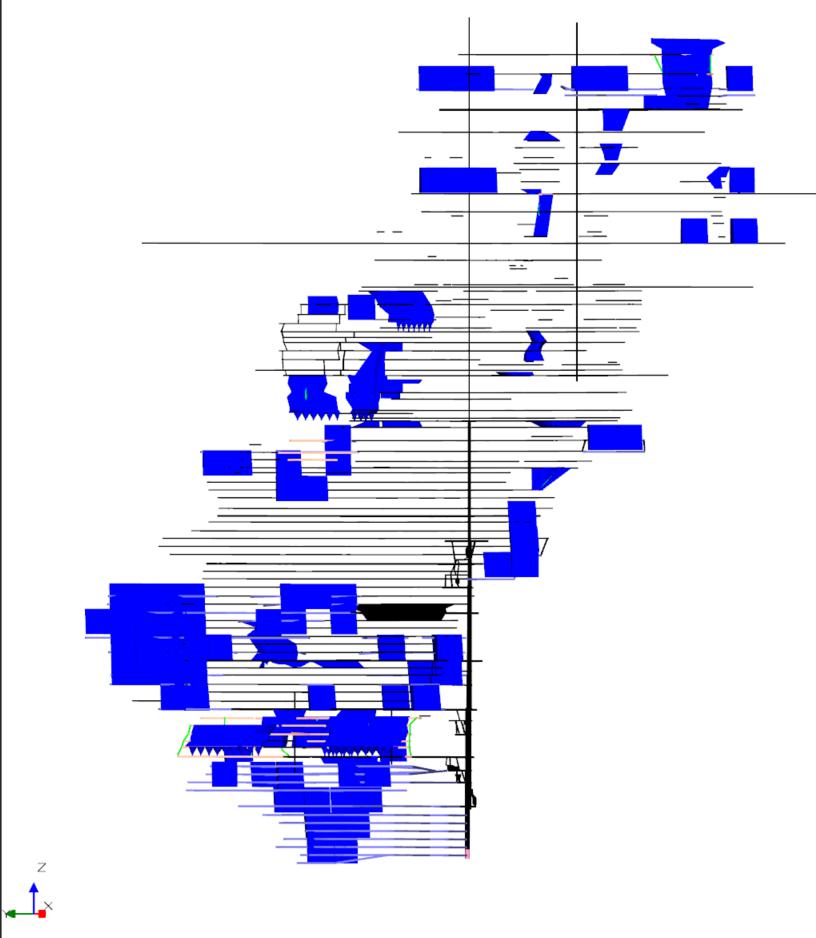
| Figure 13.6 | CY2025 MRE updated mine design looking east |
| 13.4 | Mining fleet, machinery, and personnel requirements |
| 13.4.1 | Mining fleet and machinery |
HGM is a rail mine that utilises rechargeable electric battery powered locomotives and 5 t Granby style side tipping cars. Batteries are lead acid and upgraded recently on the 30 Level to rechargeable lithium batteries installed to a 10 t locomotive to allow haulage of 7 t capacity rail cars and operation of larger 1-2 t capacity, pneumatically powered rocker-shovels.
Ore and waste are mucked from stope drawpoints and development headings using pneumatically powered rocker-shovels. Sublevels are mucked using electric or pneumatic powered hoists and scrapers or by means of shovel and wheelbarrow.
Conventional hand-held techniques utilising jacklegs are employed for development and some stoping.
| Project No PS229049 | WSP |
| How Mine | March 2026 |
| S-K 1300 Technical Report Summary | Page 98 |
| Namib Minerals |
Larger capacity pneumatic rock drills, “bar and arm” style, are used for long hole drilling of stopes in a fan pattern. Holes are drilled up to 20 m at 57 mm diameter at 1.5 m ring spacings and 2.0 m drill hole toe spacings. Electric and non-electric detonators are used in combination with packaged explosive and ANFO.
| 13.4.2 | Personnel |
The mine and process plant has 1,023 employees of which 111 are managerial employees, budgeted for a targeted maximum throughput of 650 ktpa.
| 13.5 | Scheduling process |
Datamine’s Task Scheduler (DTS) software was used to create the underground mining schedule as shown below in Figure 13.7.
Inputs to the schedule consist of the updated CY2025 MRE stoping inventory and the updated electronic development strings. Activities occur in a logical sequence, determined by the mining method, and are sequenced by linking strings in the Datamine UG software prior to the creation of the mining schedule in DTS.
This process is well understood and is part of modern mine planning processes.
| 13.6 | Mining schedule |
The mining schedule was levelled by total annual extracted ore (maximum 650kt per annum) and lateral development metres (maximum 10,800m per year) as per the current HGM operating limitations.
It has been assumed that HGM has the appropriate underground resources, including both labour and mobile equipment, to sustain these planned thresholds.
Please note that for the Mineral Reserve only mining schedule the maximum rate of 650ktpa was unable to be met even with the inclusion of marginal stopes. The current extraction limit is only able to be realised utilising Inferred material in the LOMP.
Dilution estimates were incorporated earlier in the stope optimiser process.
The extraction recovery modification factor of 90% was applied in the DTS schedule.
| Project No PS229049 | WSP |
| How Mine | March 2026 |
| S-K 1300 Technical Report Summary | Page 99 |
| Namib Minerals |
Figure 13.7 shows an example of the DTS Mineral Reserve electronic LOM schedule. Table 13.3 CY2025 Proven and Probable Mineral Reserve estimate. Figure 13.8 shows the annual ore tonnages and grades for the LOM Mineral reserve estimate.
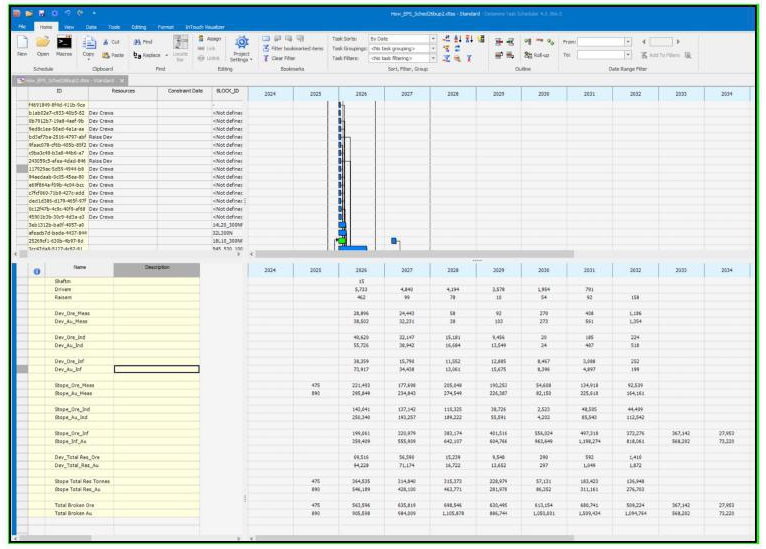
| Figure 13.7 | DTS mining schedule |
Table 13-3 CY2025 MRE (Proven and Probable only)
| HGM MINE PRODUCTION FOR FY 2026 TO 2029 (Proven and Probable Only) | ||||||
| Units | CY2026 | CY2027 | CY2028 | CY2029 | TOTAL | |
| Total Development | m | 8,815 | 10,800 | 10,800 | 10,800 | 41,215 |
| Capital Development | m | 881 | 1,200 | 1,200 | 1,200 | 4,481 |
| Total waste broken (Capital) | t | 9,696 | 12,000 | 12,000 | 12,000 | 45,696 |
| Tonnage broken | t | 296,126 | 508,524 | 517,308 | 324,966 | 1,646,924 |
| Metres drilled - Jack Hammer | t | 161,369 | 279,732 | 284,681 | 176,319 | 902,100 |
| Metres drilled - Long H | m | 182,892 | 186,226 | 186,743 | 185,279 | 741,140 |
| Tonnage hoisted (Waste) | t | 9,696 | 12,000 | 12,000 | 12,000 | 45,696 |
| Tonnage hoisted (Ore) | t | 286,430 | 496,524 | 505,308 | 312,966 | 1,601,228 |
| Tonnage hoisted | t | 296,126 | 508,524 | 517,308 | 324,966 | 1,646,924 |
| Ore Milled - ROM | t | 286,430 | 496,524 | 505,308 | 312,966 | 1,601,228 |
| Head Grade - ROM | g/t | 1.54 | 1.35 | 1.72 | 1.32 | 1.50 |
| Mineral Reserve Ounces | oz | 14,157 | 21,553 | 27,966 | 13,302 | 77,971 |
| Project No PS229049 | WSP |
| How Mine | March 2026 |
| S-K 1300 Technical Report Summary | Page 100 |
| Namib Minerals |
| HGM MINE PRODUCTION FOR FY 2026 TO 2029 (Proven and Probable Only) | ||||||
| Units | CY2026 | CY2027 | CY2028 | CY2029 | TOTAL | |
| TOTAL TONNES MILLED | t | 286,430 | 496,524 | 505,308 | 312,966 | 1,601,228 |
| ROM - Residues | g/t | 0.23 | 0.23 | 0.23 | 0.23 | 0.23 |
| Satellite - Residues | g/t | |||||
| MET.Recovery ROM | % | 89.00 | 89.00 | 89.00 | 89.00 | 89.0 |
| MET.Recovery Satellite | % | |||||
| GOLD PROD - ROM | oz | 12,600 | 19,182 | 24,890 | 11,838 | 68,509 |
| GOLD PROD - Satellite | oz | |||||
| TOTAL GOLD PRODUCED | oz | 12,600 | 19,182 | 24,890 | 11,838 | 68,509 |
| TOTAL GOLD PRODUCED | kg | 392 | 597 | 774 | 368 | 2,131 |
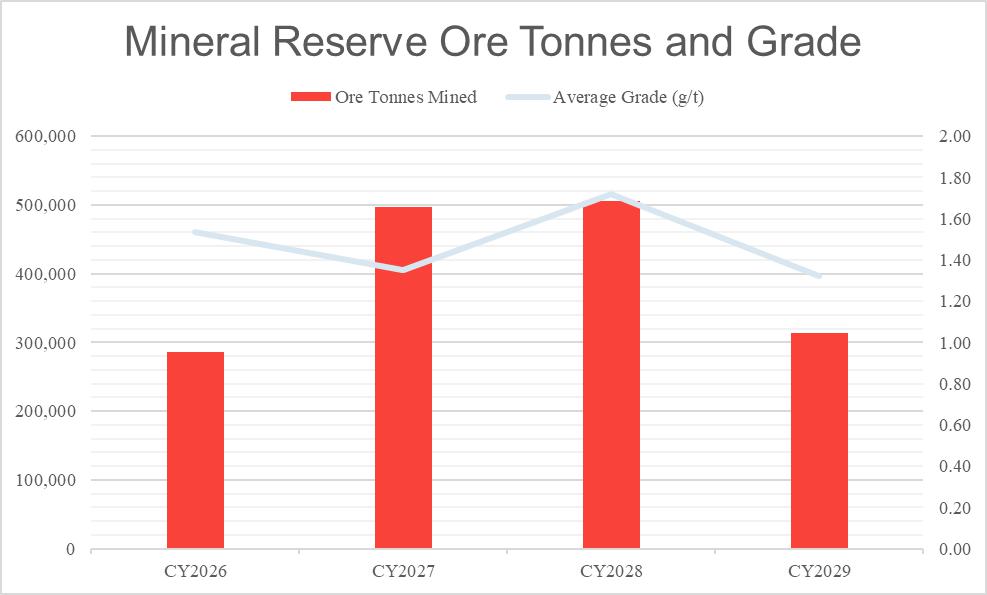
| Figure 13.8 | Total ore tonnes and average gold grade (g/t) - Proven and Probable only |
| Project No PS229049 | WSP |
| How Mine | March 2026 |
| S-K 1300 Technical Report Summary | Page 101 |
| Namib Minerals |
Table 13-4 below shows the larger strategic LOMP that includes Inferred material. As discussed earlier the included Inferred material has been selected and included in the strategic LOMP where it is safe and economic to do so, is extractable by current mining practices, and is located nearby to current workings. Additionally, a full strategic mine plan update is recommended to determine what additional Inferred material may be included. WSP notes that the majority of the included Inferred material, some of which is already being extracted, has previously been assessed via sludge hole sampling, the results of which were not utilised in assessing resource classification in the block model update as is consistent with accepted industry practice. This being the case it is also correct to state that, historically, HGM has a high resource conversion rate from their sludge sampling.
Table 13-4 HGM mine strategic life of mine plan (Proven, Probable and Inferred)
| HGM MINE PRODUCTION FOR FY 2026 TO 2034 (Proven, Probable and Inferred) | |||||||||||
| Units | CY2026 | CY2027 | CY2028 | CY2029 | CY2030 | CY2031 | CY2032 | CY2033 | CY2034 | TOTAL | |
| Tonnage broken | kt | 581 | 644 | 644 | 644 | 644 | 644 | 644 | 644 | 536 | 5,628 |
| Metres drilled - Long H | km | 166 | 184 | 184 | 184 | 184 | 184 | 184 | 184 | 153 | 1,608 |
| Tonnage hoisted (Ore) | kt | 581 | 644 | 644 | 644 | 644 | 644 | 644 | 644 | 536 | 5,628 |
| Tonnage hoisted | kt | 581 | 644 | 644 | 644 | 644 | 644 | 644 | 644 | 536 | 5,628 |
| Ore Milled - ROM | kt | 581 | 644 | 644 | 644 | 644 | 644 | 644 | 644 | 536 | 5,628 |
| Head Grade - ROM | g/t | 1.46 | 1.36 | 1.65 | 1.35 | 1.51 | 1.51 | 1.51 | 1.81 | 2.00 | 1.57 |
| TOTAL TONNES MILLED |
kt | 581 | 644 | 644 | 644 | 644 | 644 | 644 | 644 | 536 | 5,628 |
| ROM - Residues | g/t | 0.16 | 0.15 | 0.18 | 0.15 | 0.17 | 0.17 | 0.17 | 0.20 | 0.22 | 0.17 |
| MET.Recovery ROM | % | 89.0 | 89.0 | 89.0 | 89.0 | 89.0 | 89.0 | 89.0 | 89.0 | 89.0 | 89.0 |
| GOLD PROD - ROM | koz | 24.27 | 25.03 | 30.38 | 24.94 | 27.78 | 27.78 | 27.78 | 33.37 | 30.73 | 252 |
| TOTAL GOLD PRODUCED | koz | 24.27 | 25.03 | 30.38 | 24.94 | 27.78 | 27.78 | 27.78 | 33.37 | 30.73 | 252 |
| TOTAL GOLD PRODUCED | t | 0.75 | 0.78 | 0.94 | 0.78 | 0.86 | 0.86 | 0.86 | 1.04 | 0.96 | 7.84 |
| Project No PS229049 | WSP |
| How Mine | March 2026 |
| S-K 1300 Technical Report Summary | Page 102 |
| Namib Minerals |
| 14 | Processing and recovery methods |
| 14.1 | Processing methodologies and flowsheets |
Metallurgical operations at HGM are carried out in a Run of Mine (ROM) to handle a throughput of 40,500 tpm shown in Figure 14.1.
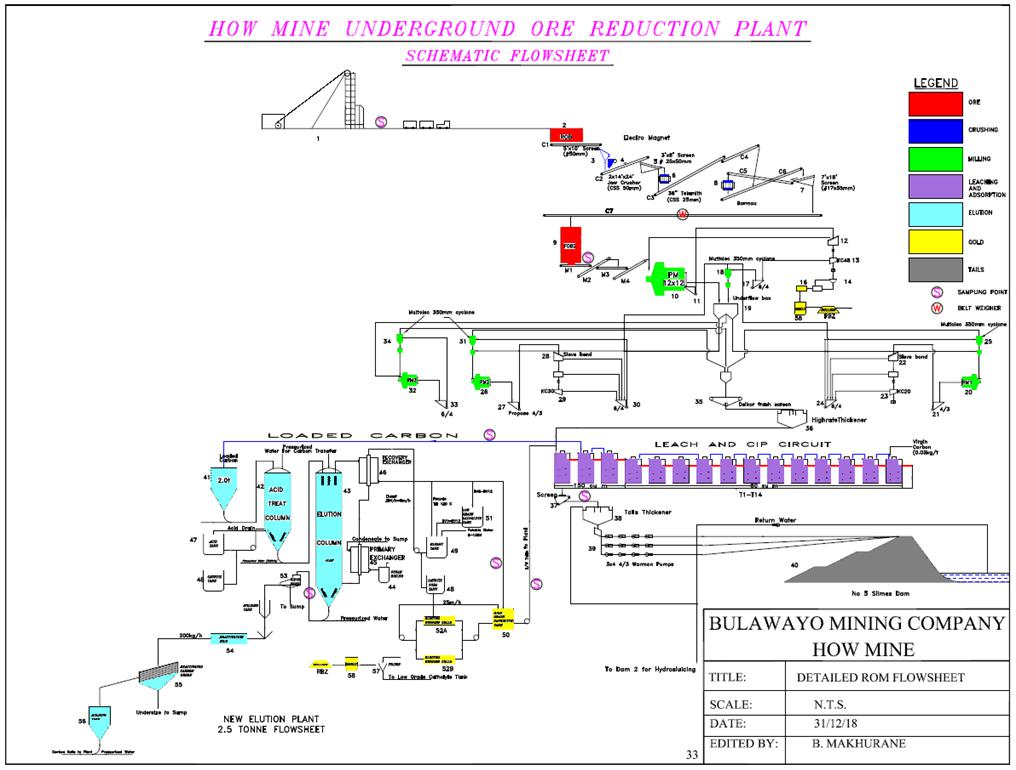
| Figure 14.1 | HGM processing flowsheet (KDM 2018) |
| 14.2 | Processing plant throughput and characteristics |
| 14.2.1 | Run of Mine crushing plant |
Hoisted ore from North Shaft is transported to a Rough-Ore-Bin (ROB) with a capacity of 100 tonnes, then fed into a crushing plant for size reduction. There are two circuits: the old circuit, with three stages (primary and secondary as open circuits, tertiary as closed), and the new circuit, with two stages (primary open, secondary closed). Final product is stored in Fine-Ore-Bins (FOBs) with a combined capacity of 700 tonnes. Three vibro-feeders draw ore from the ROB onto a conveyor feeding a Single Deck Vibrating Screen with 50 mm grizzly bars. Oversize goes to a Jaw Crusher (closed size setting 50 mm for old circuit, 100 mm for new).
| Project No PS229049 | WSP |
| How Mine | March 2026 |
| S-K 1300 Technical Report Summary | Page 103 |
| Namib Minerals |
At the secondary stage, ore is screened at a double deck Vibrating Screen. For the new circuit, oversize from the top deck goes to the HP300 crusher, while oversize from the bottom deck is conveyed to a tertiary screen. For the old circuit, oversize goes to a gyratory secondary crusher. At the tertiary stage, ore is crushed by a Barmac 9600 crusher in a closed circuit with a Vibro-King Screen. Undersize is final product, fed to FOBs, and oversize is conveyed back to the Barmac crusher for further crushing.
| 14.2.2 | Grinding and gravity concentration plant |
Crushed ore is ground in two stages to achieve 80% passing 75 μm. From the Fine Ore Bin, ore passes over a Ramsey weightometer and auto-sampler, then transfers via four conveyors to a 12’ x 12’ (1230 Hp) Marcy overflow ball mill for primary grinding. The mill operates in closed circuit with a VD9 scalping screen with a 5 mm aperture size. Screen undersize goes into a 48-inch Knelson gravity concentrator, while oversize flows back into the mill.
| 14.2.3 | Run of Mine CIP plant |
In the leach plant, cyclone overflow is thickened from 25% to 45–50% solids using Hi-Rate Thickeners with flocculant assistance. Cyanide and hydrogen peroxide are added to the thickener underflow before transferring pulp to the CIP plant. The CIP plant consists of eighteen mechanically agitated tanks, each with specific parameters for pulp conditioning. A cyanide solution dosing system maintains cyanide concentration throughout the leach process, using gaseous oxygen from a rented BOC Pressure Swing Absorption (PSA) plant and commercial hydrogen peroxide. Inter-stage screens retain carbon at about 20 g/l in select tanks and recessed-impeller pumps transfer carbon between tanks. Loaded carbon is transferred to elution at the head-end of the CIP plant, while carbon capture screens capture carbon at the tail-end. Tailings slurry is pumped to the TSF using multiple series of pumps.
| 14.2.4 | Elution plant |
Clean loaded carbon undergoes a process before elution: it is soaked in a hydrochloric acid solution for 30 minutes to dissolve inorganic impurities, then drained, and residual acid is neutralized with caustic soda. The AARL system is used for gold stripping: loaded carbon is treated with a caustic cyanide solution at 120°C and 2 bars, followed by hot potable water to wash eluted gold into holding tanks. The effluent circulates through electro winning cells, each with stainless-steel cathodes and strips, operating at 4 volts and 400 amps DC for 18 hours. Spent electrolyte is returned to the leach circuit. Eluted carbon is re-activated at 700°C, screened for fines removal, and returned to the CIP bottom tank.
| 14.2.5 | Clean-up and smelting |
Gold deposited on the stainless-steel cathodes is removed using a high-pressure water cleaner and collected in a settling tank. Excess water is removed, and the sludge is treated with hydrochloric acid to digest base metals. Residual sludge is rinsed, filtered, weighed, fluxed, and charged into a diesel-fired furnace crucible with borax, sodium nitrate, and fluorspar. Temperatures exceeding 1,500°C are used, and the molten charge is poured into cast iron moulds to produce bullion ingots. Slag is removed from the ingots, which are then cleaned, drilled for assay samples, and weighed. Bullion fineness is ensured to be at least 85% gold and 15% silver.
| 14.3 | Product sampling |
| 14.3.1 | Mill feed |
Samples are collected at an incremental frequency of half-hour by a Multotec hammer sampler positioned on the conveyor belt feeding the mills (Table 14.1). At two hours interval, two samples A and B are produced; being two hourly composite samples is riffled to make a 2 kg fraction for assay, with the balance used for making up an 8-hour composite sample. Similarly, during reduction of the shift composite sample, a 24-hour composite sample is generated to give a total 22 samples.
| Project No PS229049 | WSP |
| How Mine | March 2026 |
| S-K 1300 Technical Report Summary | Page 104 |
| Namib Minerals |
Table 14-1 Mill feed sampling specifications
| Parameter | Description |
| Position of Sampling Equipment | Mill Feed Conveyor |
| Top size of particles | 17 mm |
| Execution | Hammer Sampler |
| Frequency | 30 minutes |
| Sample handling | 10 kg bulk riffled down to 2 kg lab sample |
| Number of samples collected per shift | 5 |
| Duration of a shift | 8 hours |
| 14.3.2 | Feed tonnage |
Feed tonnage is measured on two points in the plant. In the mill area, tonnage throughput is determined from a mill weightometer on the primary feed conveyor. In the CIP area, tonnage throughput is determined by tonnage-box measurements of the header tank feed stream (refer to Table 14.2).
Table 14-2 Feed tonnage sampling specifications
| Location Name | Weightometer Tonnage | Box 2 Tonnage |
| Position | Primary Mill feed conveyor | CIP header tank feed |
| Method/equipment | Mill weightometer | Tonnage-box |
| 14.3.3 | Residues |
Tailings residues and recovery are estimated from sampling at 30-minute intervals by means of a manual sample cutter from the final tailings discharge tank 18 with assays completed at the on-site mine assay laboratory (Table 14.3).
Table 14-3 Residues sampling specifications
| Position of Sampling Equipment | Tank 18 Discharge Box |
| Execution | Manual Sample Cutter |
| Frequency of sampling | 30 minutes |
| Analysis site | Mine Assay Laboratory |
| Project No PS229049 | WSP |
| How Mine | March 2026 |
| S-K 1300 Technical Report Summary | Page 105 |
| Namib Minerals |
| 14.4 | Metallurgical recovery |
WSP conducted a review of historical metallurgical recoveries. Based on the historical data, and planned processing upgrades communicated by Namib, WSP believes a metallurgical recovery of 89% is reasonable. The recovery relationship is determined by both the head grade and grind size and this relationship is non-linear. WSP notes that while the head grade is forecast to lower from current levels over the coming years before increasing again towards to the end of the current LOM strategic plan, improved grind size and consistency will assist in alleviating any losses. Namib has advised that planned improvements to grind quality are expected as part of the planned upgrades to the processing plant that are currently underway. Please refer to Table 14-4 for the historical data provided.
Table 14-4 Historical metallurgical recovery data
| Year | Tonnage milled (t) | Grade (g/t) | Recovery (%) | Gold (kg) | Average tpm (kt) | Tails (g/t) | Grinds (%) |
| 2016 | 341,430 | 5.02 | 91.2 | 1561 | 28.5 | 0.44 | 69.7 |
| 2017 | 299,611 | 4.52 | 90.5 | 1226 | 25.0 | 0.43 | 67.5 |
| 2018 | 329,894 | 4.16 | 90.1 | 1236 | 27.5 | 0.41 | 68.0 |
| 2019 | 320,486 | 2.89 | 86.3 | 800 | 26.7 | 0.4 | 61.4 |
| 2020 | 287,447 | 2.41 | 85.6 | 594 | 24.0 | 0.35 | 66.1 |
| 2021 | 363,550 | 2.91 | 89.2 | 945 | 30.3 | 0.32 | 71.5 |
| 2022 | 379,472 | 2.45 | 89.7 | 833 | 31.6 | 0.25 | 69.0 |
| 2023 | 450,343 | 2.6 | 89.6 | 1049 | 37.5 | 0.27 | 72.4 |
| 2024 | 473,034 | 2.66 | 90.4 | 1139 | 39.4 | 0.25 | 73.4 |
| 2025 | 475,658 | 1.84 | 88.7 | 778 | 39.6 | 0.21 | 72.6 |
| 14.5 | Product stockyard |
HGM has Surface Sands stockpile namely Dam 3 and Dam 4. It is reported as Probable Category in which estimation is supported based on auguring exercise conducted by a contractor during the 3rd Quarter of 2021. Volumetric Survey is carried out by the Survey Team for the estimation of the volume and tonnage conversion.
| Project No PS229049 | WSP |
| How Mine | March 2026 |
| S-K 1300 Technical Report Summary | Page 106 |
| Namib Minerals |
| 14.6 | Energy and water process materials requirements |
| 14.6.1 | Mine power plant |
Electricity is supplied from the national grid through Springs and Criterion lines, operated by Zimbabwe Electricity Supply Authority (ZESA). The mine receives power at 33 kV from Zimbabwe Electricity Transmission and Distribution Company (ZETDC) via two lines: one from Springs substation and another from Criterion substation. The mine has nine points metered by ZETDC, with supply stepped down to various voltages for different purposes. Underground operations and the high-density village are supplied at 2.2 kV, further stepped down to 380V and 220V for domestic use.
Distribution to underground mining operations feeds various substations, with heavy equipment supplied at 550V, and further transformed for pumping and lighting. The processing plant is fed at multiple voltage levels, with plans to upgrade Springs power supply to accommodate expansion. The mine also has a compressed air generation plant, delivering compressed air to the processing plant and underground operations through various supply lines, with peak demand at approximately 13,500 CFM.
| 14.6.2 | Mine water management system |
The Mine utilises water from Chimedza Dam and How Mine Dam, pumping it onto surface tanks for surge capacity. Underground mining operations receive water from the Main Shaft tank, delivered via gravity feed to dams on various levels. Settling dams collect muddy water from work areas, with pumping facilitating recycling up to the 14 Level dam. Contaminated water is directed to the processing plant for use and transfer to the Tailings Storage Facility (TSF). The processing plant recycles process water from the TSF for re-use, ensuring sustainability in a dry region with low rainfall. Plans for expansion include upgrading the water reticulation system by constructing HDPE-lined reservoirs and drilling boreholes for additional water supply.
| 14.7 | QP’s opinion |
The existing process facility at How Mine has a record of successful operation/ Process recoveries consistent with previous experience are anticipated at levels consistent with the recent 3-year average of 89.0%.
Risks to future plant throughput and recovery include:
| — | Currently planned plant construction and refurbishment activities proceed in accordance with schedule. |
| — | Planned maintenance and refurbishment are identified and attended to ahead of time. |
The plant is relatively more complex in layout as additions and upgrades have been implemented over the course of many years in an area that is relatively constrained. Efforts should be made to rationalise and streamline the plant layout over time.
Opportunities may exist to improve recoveries given that residue levels of 0.23 g/t are relatively high by industry standards for conventional gravity recovery and CIP/CIL plants. A review of average grind size and metallurgical characteristics of the ore types may prove beneficial.
Security of the facility and safeguarding from both internal and external threats will be ongoing, particularly in an environment where gold prices are rising.
| Project No PS229049 | WSP |
| How Mine | March 2026 |
| S-K 1300 Technical Report Summary | Page 107 |
| Namib Minerals |
| 15 | Infrastructure |
| 15.1 | Rail access |
Rail access is available at Bulawayo within 31 km northwest of MGM by road (42 minutes) and with a separate line passing through Esigodini 17 km due east and 30 km by road (41 minutes). This is a general freight train service in Zimbabwe that caters to the Mining, Energy, Industrial, and Manufacturing sectors. The NRZ rail network map is presented in Figure 15.1.
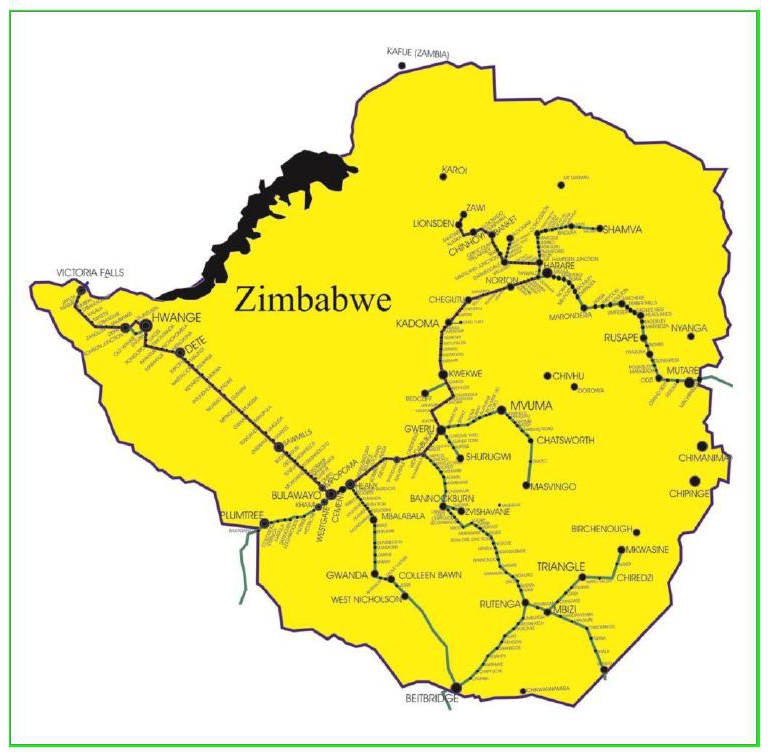
| Figure 15.1 | NRZ rail network schematic (NRZ 2024c) |
Commercial corridors and trade routes exist in the following areas:
| — | Zimbabwe-South Africa: Beitbridge, on the Zimbabwe-South African border and along the trade route to Durban, has an import-export ecosystem dominated by import-export clearance firms. |
| — | Zimbabwe-Mozambique: Mutare, on the border with Mozambique along the trade route to Beira port, is dominated by the wood, timber, and allied industries. |
| Project No PS229049 | WSP |
| How Mine | March 2026 |
| S-K 1300 Technical Report Summary | Page 108 |
| Namib Minerals |
| — | Victoria Falls: The Victoria Falls special economic zone has been designated as an International Financial Services enter which caters to customers outside Zimbabwe. The town of Victoria Falls is home to a foreign exchange-denominated stock exchange and boasts of a tourism-financial services ecosystem. It also has several tourist attractions including Victoria Falls and game parks. |
(United States International Trade Administration, 3 June 2024, https://www.trade.gov/country-commercial-guides/zimbabwe-market-overview).
| 15.2 | Port access |
Zimbabwe is a land-locked country with key road and rail routes through to ports in Durban in South Africa and Beira in Mozambique.
| 15.3 | Roads |
The HGM is accessed via a tarred road that is in fair condition.
| 15.4 | Camp |
Staff are largely housed on-site in a family accommodation area, while a few members are bussed in from Bulawayo daily.
| 15.5 | Tailings |
Pulp from tank 14 is fed into a tailings pump system. The system comprises of three identical pumping banks in parallel, each bank being a four-stage series pump arrangement that utilises 4/3D pumps. The system transfers tailings slurry through a dynamic head of 101 m to a disposal site (Dam 5) 2 km away from the plant. Dam 5 water is pumped back for reuse in the process plant.
| 15.6 | Potable water and wastewater |
Water used in the operations is obtained from a dam on the Gabalozi River (on mine site) and Chimedza dam (some 7 km west of the mine location). Drinking water is provided from a line supplying the city of Bulawayo.
Fresh water from surface is fed to the 4 Level dam.
The processing plant recycles process water by pumping water back from the TSF for re-use. Water recycling ensures sustainability, since the HGM is located in a generally dry region with low rainfall (Metallon Operations Reports).
| Project No PS229049 | WSP |
| How Mine | March 2026 |
| S-K 1300 Technical Report Summary | Page 109 |
| Namib Minerals |
| 15.7 | Accommodation and offices |
At the HGM, there are 834 employees but only 769 housing units, leaving a shortfall of 65 units for each employee to have their own allocated accommodation. The types of housing units vary, ranging from single-roomed to 6-roomed houses in the High-Density Village, and 3 to 4-bedroom houses in the Low-Density Village. Some middle management employees are accommodated in guest houses on site or in houses in the Low-Density area of Bulawayo. To improve occupational health and safety, there is a proposal to construct individual toilets and bathrooms per unit to replace the communal system currently in place for single-roomed houses. The mine receives a consistent water supply from the Bulawayo City Council, supplemented by boreholes to reduce the likelihood of water shortages in the foreseeable future.
| 15.8 | Non-process infrastructure |
No data provided for Non-process Infrastructure (NPI).
| 15.9 | Information and communications technology systems |
No data provided for Information and Communications Technology (ICT) systems.
| 15.10 | Other support facilities and utilities |
The HGM operates a local clinic that serves both mine workers and the surrounding community, addressing minor health issues and providing maternity care. To improve healthcare quality, a medical doctor visits weekly, alongside permanent, highly qualified nurses and support staff. Regular medical surveillance and check-ups are conducted to monitor worker health and ensure their wellbeing.
| 16 | Market studies |
| 16.1 | Nature and material terms of agency relationships |
The HGM is 100% owned by BMC Limited which in turn is owned by Namib Minerals, with no agency relationships applicable.
| Project No PS229049 | WSP |
| How Mine | March 2026 |
| S-K 1300 Technical Report Summary | Page 110 |
| Namib Minerals |
| 16.2 | Results of relevant market studies |
No recent formal market studies have been completed. Gold and silver are sold according to open market prices as mandated by the Zimbabwean government. Analysis is based on historical pricing using a 3-year trailing average, combined with industry forecasts for exchange rate and inflation.
| 16.3 | Commodity price projections |
Pricing assumptions for gold and silver are based on historical spot pricing in an open market for precious metals, government mandated terms for payment, foreign exchange, and inflation recent history. The LOM plan and pay limit (COG) assessment has assumed a gold price of US$3,272/oz and silver price of US$38.5/oz while the project cashflow analysis has assumed a gold price of US$3,272/oz and excluded silver byproduct as a material revenue source.
The price assumptions are reasonable given spot pricing of US$5,189/oz (Feb 2026). The assumed gold price is materially lower than the average realised price (past 12 months). The spot price for silver is currently US$89/oz whilst, again providing significant headroom above reserve and resource assumptions.
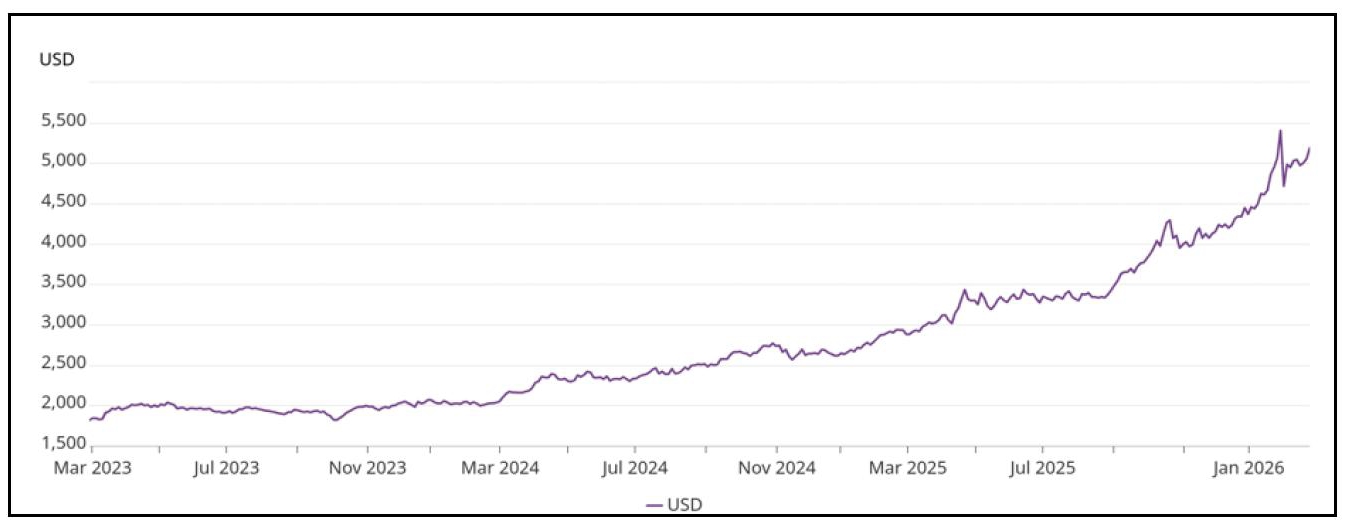
| Figure 16.1 | Historical (blue) gold spot price US$/oz (World Gold Council Feb 26) |
Gold proceeds are paid 75% in USD and 25% in local currency with effect from February 2023 (previously 60% USD and 40% in local currency). Sale of gold under these terms has been mandated by the Zimbabwean Government since the start of 2020. The impact of Government controls on gold and silver sales with respect to foreign currency retentions have been considered for the LOM plan.
The local currency component of revenue has been employed for in country expenses, however, this value is subject to inflation (4.1%, January 2026, Table 16.1) and exchange rate risk (Figure 16.2). Under these circumstances prompt expenditure of local currency is warranted.
| Project No PS229049 | WSP |
| How Mine | March 2026 |
| S-K 1300 Technical Report Summary | Page 111 |
| Namib Minerals |
Table 16-1 Zimbabwean inflation rate and economic indicators (Trading Economics, 13 February 2026)
| Indicator | Last | Previous | Highest | Lowest | Units | Date |
| Currency (ZWL per USD) | 25.56 | 25.56 | 28.68 | n/a | ZWL | Feb-2026 |
| Stock Market (ZSE All Share Index) | 360.19 | 359.26 | 365.11 | 185.68 | Points | Feb-2026 |
| GDP Annual Growth Rate | 2.0 | 5.4 | 22.57 | -17.2 | percent | Dec-2024 |
| Unemployment Rate | 8.6 | 8.8 | 10.8 | 4.4 | percent | Dec-2024 |
| Inflation Rate (CPI) | 4.1 | 15.0 | 786 | -7.5 | percent | Jan-2026 |
| Interest Rate (Policy) | 35 | 35 | 200 | 15 | percent | Jan-2026 |
| Balance of Trade | 90.5 | 28.7 | 293 | -3958 | USD Million | Nov-2025 |
| Current Account Balance | 501 | 134 | 920 | -2750 | USD Million | Dec-2024 |
| Current Account to GDP | 1.5 | 0.4 | 4.1 | -19.3 | percent of GDP | Dec-2024 |
| Government Debt to GDP | 87 | 92.6 | 248 | 48.44 | percent of GDP | Dec-2024 |
| Government Budget Balance | -1.2 | -6.4 | 2.0 | -11.2 | percent of GDP | Dec-2024 |
| Corporate Tax Rate | 24.72 | 24.72 | 30.9 | 24 | percent | Dec-2025 |
| Personal Income Tax Rate | 41.2 | 41.2 | 51.5 | 36.05 | percent | Dec-2025 |
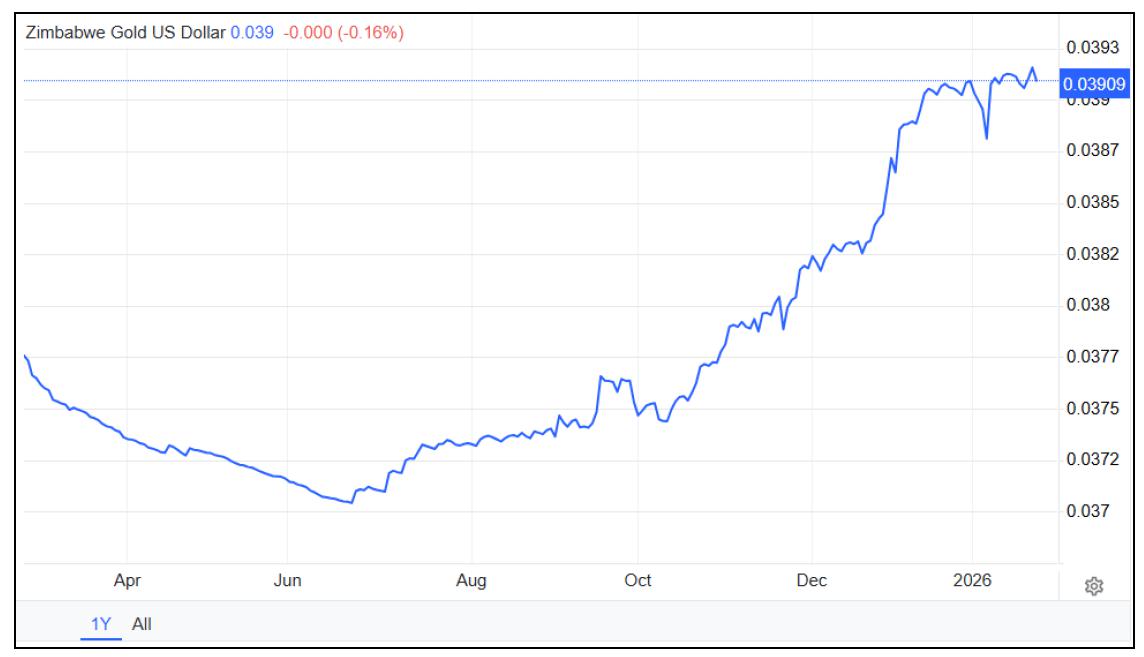
| Figure 16.2 | Zimbabwean gold currency exchange rate ZiG/USD (Trading Economics, 24 February 2026) |
| Project No PS229049 | WSP |
| How Mine | March 2026 |
| S-K 1300 Technical Report Summary | Page 112 |
| Namib Minerals |
| 16.4 | Mining and processing |
Mining and processing at HGM are conducted on an owner operator basis.
| 16.5 | Product transport and handling |
A gold and silver doré is produced for sale to the Zimbabwean government nominated agent, Fidelity. Gold generally averages 87% by weight. The product is transported by a private professional security company. Fawcetts Security, via armoured car to airport, then airlifted to Harare. Then transported by armoured car to Fidelity, a government owned refining facility via the Motapa Investment Fund (sovereign fund). Gold and silver is valued at spot pricing on the day of receipt of the doré with Fidelity stipulating allowances for refining charges (US$21/oz Au) and government royalty (5%).
| 16.6 | Hedging arrangements |
No hedging arrangements are currently in place.
| 16.7 | Forward sales contracts |
No forward sales contracts are currently in place.
| 16.8 | Contracts with affiliated parties |
No contracts with affiliated parties are currently in place with respect to gold sales.
| Project No PS229049 | WSP |
| How Mine | March 2026 |
| S-K 1300 Technical Report Summary | Page 113 |
| Namib Minerals |
| 17 | Environmental studies, permitting and plans, negotiations, or agreements with local individuals or groups |
| 17.1 | Introduction |
The following sections detail the environmental studies, permitting, plans, negotiations, or agreements with local individuals or groups and describe the factors pertaining to environmental compliance, permitting, and local individuals or groups, related to the Property.
Environmental studies and impact assessments are covered under Section 17.5 of this TRS and acknowledge that the HGM has been in operation since 1941. While baseline studies do not exist, the responsibility and requirements for management, monitoring and remediation are described as part of the Environmental Management Plan (EMP). Prior to 2025, compliance with environmental regulations was covered by an annual government audit and accreditation. This process is still in place for exploration of satellite deposits.
Requirements and plans for waste and tailings disposal, site monitoring, and water management during operations and after mine closure are covered under the 2023 EMP and as summarised under the relevant Sections of this TRS (17.7, 17.8, and 17.9). Mine closure plans have recently been updated by external consultants Enmin Consulting (Private) Limited (Enmin) in June 2024 (Section 17.12).
Project permitting requirements are covered under Section 17.4 of this TRS. The HGM is considered in good standing.
Commitments to ensure local procurement and hiring are covered under Section 17.11.8 of this TRS.
The QP’s opinion on the adequacy of current plans to address any issues related to environmental compliance, permitting, and local individuals or groups is covered under Section 17.14 of this TRS.
| 17.2 | Environmental management and corporate responsibility |
Since the previous report there has been no major environmental incidents recorded. The mine’s Business Excellence Management System was reviewed to strengthen Environmental, Social and Governance (ESG/sustainability) issues. ESG framework and actions towards this are being implemented to ensure a structured approach to sustainable stakeholder engagement and shared value creation. The framework is aligned to international standards namely NASDAQ sustainability guideline 2.0, GRI 14, SDGs and IFRS S1 and S2. The asses has on foot an EMP covering mining and processing operations for the HGM. This plan acknowledges the potential to impact the environment, and provides a management plan to ensure that all aspects and impacts for current and planned operations are captured and managed in an environmentally responsible manner, to assure legal compliance and to demonstrate the BMC Zimbabwe’s commitment to protecting and preserving the environment as guided by the Environmental Management Act Chapter 20:27 of 2002, supporting regulations, as well as the Environmental Management System ISO14001:2015, for which the HGM holds accreditation.
The company is commited to enhancing the positive impacts of all current and planned projects, including employment creation, increased mineral production and profitability of the HGM and opportunity to exercise corporate social responsibility within the surrounding communities.
| Project No PS229049 | WSP |
| How Mine | March 2026 |
| S-K 1300 Technical Report Summary | Page 114 |
| Namib Minerals |
Under the EMP, the following environmental impacts are addressed during operation and decommissioning phases:
| — | Water pollution from plant wastewater, chemical spillages, tailings, domestic sewage, fuel or oil leaks. |
| — | Air pollution from laboratory fumes, generator, smelting, crushing plant, fugitive dust from TSFs, and dusty roads. |
| — | Land pollution from fuel leaks, oil leaks, effluent, tailings, waste rock, hazardous substance spillages, hazardous waste, and general solid waste. |
| — | Natural resource depletion from removal of vegetation, mineral extraction, water, electricity, fuel, and oil usage. |
| — | Land degradation during exploration and mining. |
Roles, responsibilities and authorities are clearly spelt out in order to implement the various environmental plans efficiently and effectively, including the waste management plan, hazardous substance management plan, land management plan, mine closure plan, water management plan, air quality management plan and effluent improvement plan.
BMC Zimbabwe has also prepared a Corporate Social Responsibility Policy dated March 2024, which acknowledges that it is committed to being a responsible corporate citizen by balancing the business priorities with social, economic and environmental responsibilities. Corporate social responsibility is fundamental to the long-term growth and sustainability of BMC Zimbabwe and is therefore viewed as the basis on which it conducts its business. This policy has the following objectives:
| — | To respect, consider and respond to stakeholders’ interests. |
| — | To disseminate information about the company’s activities and decisions for which the company is responsible in a comprehensive and transparent manner. |
| — | Ploughing back to the community by addressing pressing social, economic and environmental challenges in the community. |
| — | Supporting ongoing national and community initiatives. |
| — | Building a positive corporate image, reputation and creating public goodwill for the organization. |
| 17.3 | Property context |
The HGM is located approximately 30 km south-east of the city of Bulawayo in Matabeleland South Province, in the Bulawayo Mining District of Zimbabwe. The Property is at an altitude of approximately 1,250 m amsl.
| Project No PS229049 | WSP |
| How Mine | March 2026 |
| S-K 1300 Technical Report Summary | Page 115 |
| Namib Minerals |
Figure 17.1 shows a site layout map for HGM.
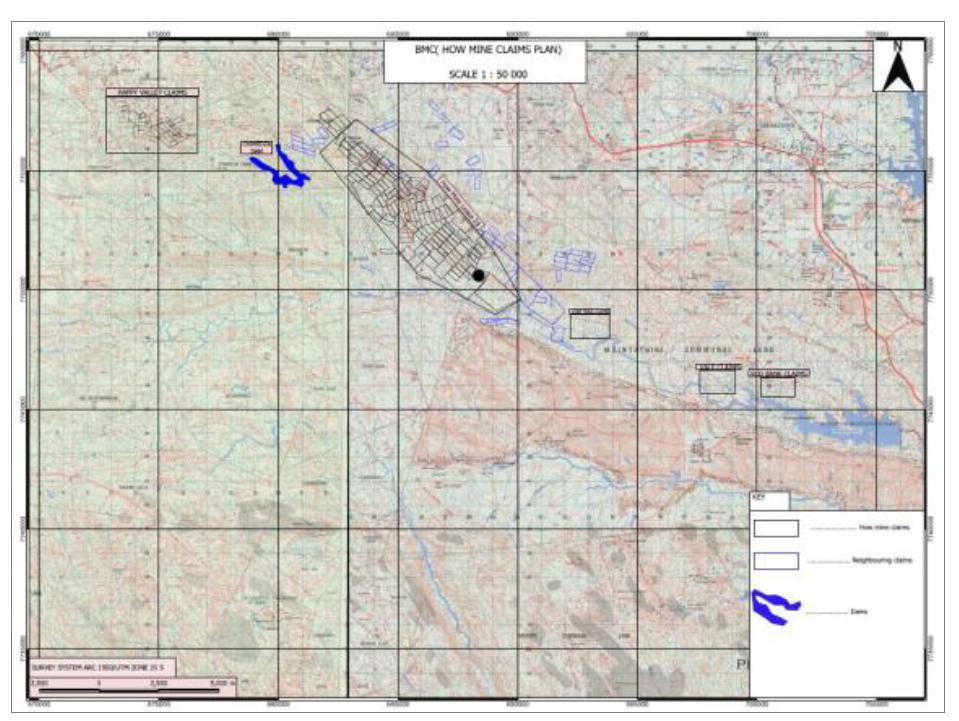
| Figure 17.1 | BMC Zimbabwe ML and other claims |
| 17.4 | Property permitting |
The following permits/licenses expiry details were confirmed :
| — | License for Storage of Explosives, Main Store – Valid 30 June 2026. |
| — | License for Storage of Explosives, Above Mine Distribution Store – Expires 30 June 2026. |
| — | License for Storage of Explosives, Above Mine Store – valid until 30 June 2026. |
| — | Air Emission License (Generator Exhaust) – valid until 31 December 2026. |
| — | Air Emission License (Assay Emission) – valid until 31 December 2026. |
| — | Effluent Disposal License – valid until 31 December 2026. |
| — | Environmental Impact Assessment Certificate (Bulawayo Mining Company) – valid until 26 June 2026. |
| — | Environmental Impact Assessment Certificate (Exploration Project) – valid until 26 June 2026. |
| — | Environmental Impact Assessment Certificate (Bulawayo South Claims – Exploration Mining and processing) – valid until 14 September 2027. |
| — | Environmental Impact Assessment Certificate (Three Castles Mine-Open Pit Mining & Exploration) – valid until 19 October 2025 (renewal applied and paid for). |
| — | ISO 14001 Certificate – valid until 14 September 2027. |
| Project No PS229049 | WSP |
| How Mine | March 2026 |
| S-K 1300 Technical Report Summary | Page 116 |
| Namib Minerals |
| — | ISO 45001 Certificate –valid until 12 June 2028. |
| — | ISO 9001 Certificate – valid until 14 September 2027. |
| — | Solid Waste Disposal License – valid until 31 December 2026. |
| — | Decommissioned Tailings Dam Solid Waste Disposal License – valid until 31 December 2026. |
| — | NORM Radiation monitoring exemption – valid until 31 December 2027. |
| — | Hazardous Substance Storage and Use License – valid until 7 April 2026. |
| — | Hazardous Waste Generation License – valid until 07 May 2026. |
| — | Hazardous Substance Importation License – valid until 31 December 2026. |
| — | Hazardous Substance Transportation License – valid until 07 April 2026. |
| — | Surface Water Permit – valid until 14 April 2029. |
| — | Water Abstraction Permit, 440 megalitres annually from Gabalozi River – Originally issued 29 November 2012 with 5-year expiry, Updated in April 2024 – valid until 14 April 2029. |
| 17.5 | Environmental and Social Impact Assessment |
At the HGM, major environmental concerns include water and land pollution, air pollution, and land degradation. The mine meets Environmental Management Agency standards and holds licenses for hazardous substances use, waste generation, and air emissions. It has a comprehensive Environmental Management Plan (EMP) outlining targets and strategies for environmental protection and compliance.
| 17.5.1 | Biodiversity and natural resources |
A Biodiversity Management Plan was developed in their Environmental Management Plan 2025 to limit the Property’s footprint and activities as well as to avoid placement of infrastructure within watercourse, wetlands or flood lines and sensitive areas.
| 17.5.2 | Managing impacts on water |
At the HGM, water used for gold extraction comes from the Gabalozi River and Chimedza Dam. Pollution from ore treatment includes sulphates and manganese, causing low pH and high levels of Electrical Conductivity and Total Dissolved Solids in the water. To tackle this, effluent is directed to No. 5 Slimes Dam before being reused in the plant. Regular monitoring ensures compliance with environmental rules.
Domestic wastewater is treated at a local plant to reduce Biological and Chemical Oxygen Demand, as well as phosphates, using biological treatment and chlorine disinfection. The treated water is reused for irrigation in tailings dam projects.
| 17.5.3 | Acid and metalliferous drainage |
No data regarding Acid and Metalliferous Drainage (AMD).
| 17.5.4 | Erosion and protection of soils |
At the HGM, land degradation stems mainly from tailings facilities spanning 58 hectares. Remediation includes re-mining and re-vegetation, consolidating all dumps into No. 5 slimes dam for rehabilitation. No. 2 Slimes Dam has been re-mined, with ongoing re-vegetation, while plans are in place for No. 3 and No. 4 Slimes Dams. Re-vegetation efforts continue at No. 5 Slimes Dam until mine closure, supported by a tree nursery for indigenous and exotic species. An invasive species eradication program targets environmental degradation prevention, focusing on lantana camara over approximately 13 hectares around the mine.
| 17.5.5 | Noise and vibration |
At the HGM, monitoring will use industry-standard seismographs to measure ground vibration and air blast simultaneously. Positioned strategically at sensitive receptors, these instruments will assess impacts. Sensitive receptors within 1,000 m but outside 500 m blast zones will be evacuated during initial blasting. Monitoring will focus on air blasts, noise, and ground vibrations to ensure they stay within acceptable levels. Differences in impacts outdoors and inside buildings will be observed.
| Project No PS229049 | WSP |
| How Mine | March 2026 |
| S-K 1300 Technical Report Summary | Page 117 |
| Namib Minerals |
| 17.5.6 | Air quality |
Air pollution at the metallurgical and assay plants mainly comes from dust during crushing. Mitigation includes dust suppression sprays and scrubber boxes. Emission sources like laboratories, generators, and incinerators are regularly sampled and analysed. All stacks fall within the blue zone band.
| 17.5.7 | Local climate impacts |
The HGM is located in a natural farming area of Zimbabwe with an average annual rainfall of 638 mm. The majority, around 80%, falls between November and January, with the highest around 120 mm. Monthly rainfall rarely exceeds 140mm, typical of conventional rainfall from the southern Frontier of the Inter-tropical Convergence Zone (ITCZ). Winter sees overcast conditions due to cold, moist air from the southeast. The gentle terrain and low rainfall minimize environmental erosion, making it suitable for mining. However, low rainfall can lead to dust propagation, requiring artificial dust suppression techniques at the mine.
| 17.5.8 | Greenhouse gas emissions |
The HGM has integrated a Greenhouse Gas Emissions Management Plan into its ESG initiatives and Environmental Management Plan Review for 2025. This plan includes developing a greenhouse gas emissions inventory to evaluate yearly emissions. Ongoing investigations seek ways to reduce emissions, with initiatives implemented to minimize greenhouse gas release into the atmosphere.
| 17.5.9 | Resources use and non-mineral waste |
No resources use and non-mineral waste data or information was provided by BMC Zimbabwe for review.
| 17.5.10 | Regulatory accreditation |
The Environmental Management Agency (EMA) oversees the annual licensing of organizations to ensure compliance with environmental laws and regulations. This process is outlined as follows:
The HGM is required to comply with the Environmental Management Act Chapter 20:27 of 2002 and its regulations, including S.I. 7 of 2007 (Environmental Impact Assessment and Ecosystem Protection) of 2007, S.I. 6 of 2007 (Effluent and Solid Waste Disposal), S.I. 10 of 2007 (Hazardous Waste Management), S.I. 268 of 2018 (Control of Hazardous Substances), S.I. 72 of 2009 (Atmospheric Pollution Control). To comply with these regulations and under EMA guidance, BMC Zimbabwe prepared an EMP (in 2023 [BMC (2023a)], given the mine existed prior to the Environmental Management Act of 2002 which required an Environmental Impact Assessment (EIA). The 2025 EMP (BMC (2023a)) comprises specific management plans such as a Waste Management Plan, Effluent Management Plan, and Resource Utilization Plan. The EMP is reviewed annually and the lates update was done in 2025.
On a quarterly basis, reports are submitted to EMA detailing environmental monitoring and progress on the management plans. The EMA also visits the HGM on a quarterly basis to conduct inspections and advise on environmental compliance and best practice. Based on the environmental monitoring results and being guided by the regulations, BMC Zimbabwe applies for annual environmental licenses comprising licenses for effluent disposal, solid waste disposal, emissions, transportation, storage and use of substances, hazardous waste generation and decommissioned TSF’s. All licenses were in good standing for 2025.
| Project No PS229049 | WSP |
| How Mine | March 2026 |
| S-K 1300 Technical Report Summary | Page 118 |
| Namib Minerals |
In cases where there are new projects and exploration outside the boundary of ML 28, BMC Zimbabwe conducts an Environmental and Social Impact Assessment (ESIA) as guided by SI 7 of 2007. An ESIA application is submitted to EMA for review and approval whereupon an ESIA license is issued to the HGM. These are also monitored by quarterly EMA inspections, and in cases where the HGM fails to comply with the license conditions, the license can be revoked.
| 17.6 | Property standards |
No property standards data or information was provided by Namib Minerals for review.
| 17.7 | Waste and tailings disposal plans |
| 17.7.1 | Waste disposal |
How Mine’s underground waste management adheres to government regulations, including the Mining (Management and Safety) Regulations SI 109 of 1990 and Environmental Management Act 20:27 of 2002. The mine prioritises the ’4Rs’ principle: Reduce, Reuse, Recycle, and Recover. Waste rock from development is minimised and used for backfilling old stopes, while tailings are treated and stored in designated facilities. Currently no waste rock is derived from underground mining. Low grade development ore hoisted to surface is stockpiled adjacent the shaft and sent to the process plant on an opportunistic basis. Metal waste is collected, stored, and recycled to recover value. Water is efficiently managed through recycling and treatment. Explosive waste is handled and disposed of safely, and general waste is segregated and disposed of in designated landfills. Human waste is collected and treated in on-site sewage treatment plants. This comprehensive approach ensures the sustainable management of underground waste at How Mine.
| 17.7.2 | Tailings disposal |
The active TSF Dam 5 is located approximately 2.5 km southeast of the processing plant, and has a footprint of 39 ha (Figure 17.2). Recent photographs of the TSF Dam 5 location from satellite imagery are provided in Figure 17.3. Approximately 10.8 Mt of tailings has been disposed into the TSF over a period of 25 years, after dam commissioning in 1998.
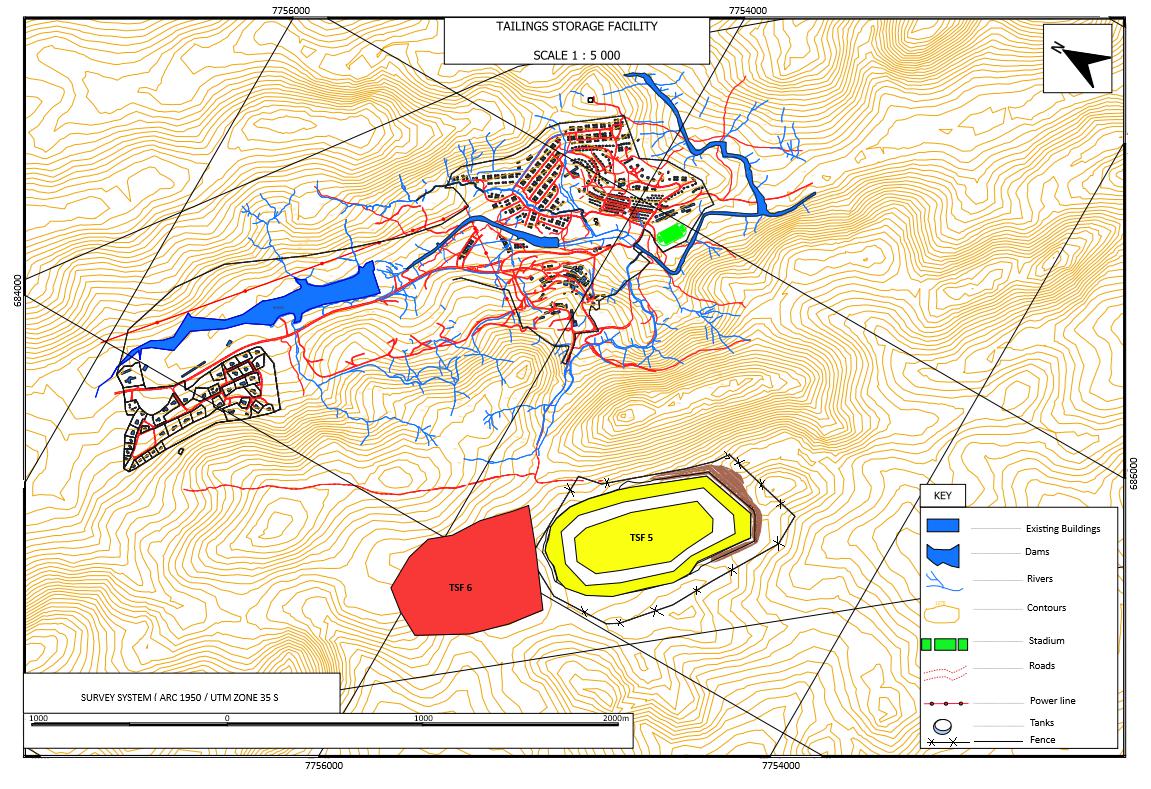
| Figure 17.2 | Site layout for TSF Dam 5 and proposed Dam 6 |
TSF Dam 5 was designed, constructed and operated by Fraser Alexander (Pty) Ltd (Fraser Alexander) until 2019, when operation and groundwater monitoring was taken over by HGM. It is constructed as an upstream paddock design (Figure 17.4) using tailings to construct the walls, a technique commonly applied in Africa.
With a footprint of 39 Ha, the dam is designed to carry 8.9 Mm3 of material, translating to 15 Mt at 1.68 t/m3 dry density. Dam 5 deposition as at December 2025 stood at 10.8 Mt. Remaining design capacity is 2.5 Mm3 volumetric capacity or 4.2 Mt. TSF Dam 5 is licensed on an annual basis, with monitoring on a quarterly basis.
The current available storage exceeds that of both the Mineral reserves only LOM plan and that of the current strategic LOM plan.
Namib has advised that a potential site, with a footprint of 63 Ha, has been identified for a new tailings storage facility, TSF 6, located just northwest of TSF Dam 5. Geotechnical testing is yet to be completed to inform dam designs.
| Project No PS229049 | WSP |
| How Mine | March 2026 |
| S-K 1300 Technical Report Summary | Page 119 |
| Namib Minerals |
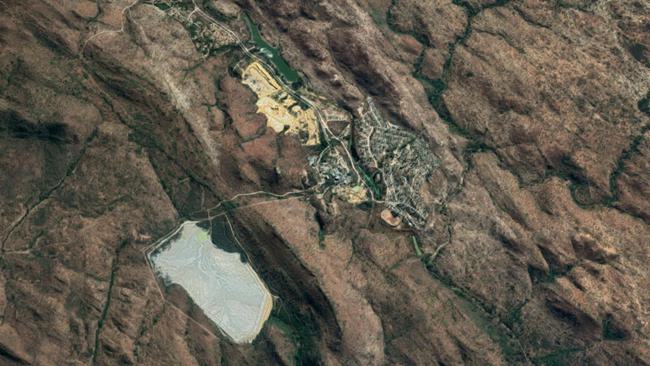
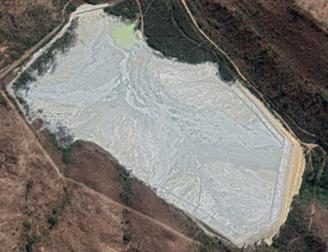 | 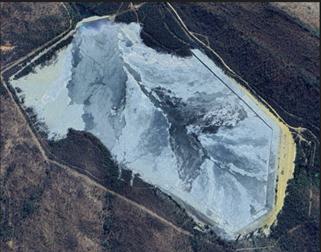 |
| Figure 17.3 | TSF Dam 5 location from satellite imagery |
| Project No PS229049 | WSP |
| How Mine | March 2026 |
| S-K 1300 Technical Report Summary | Page 120 |
| Namib Minerals |
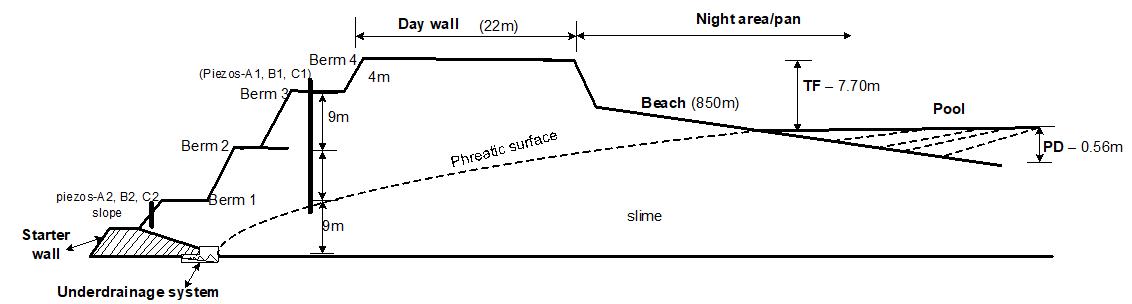
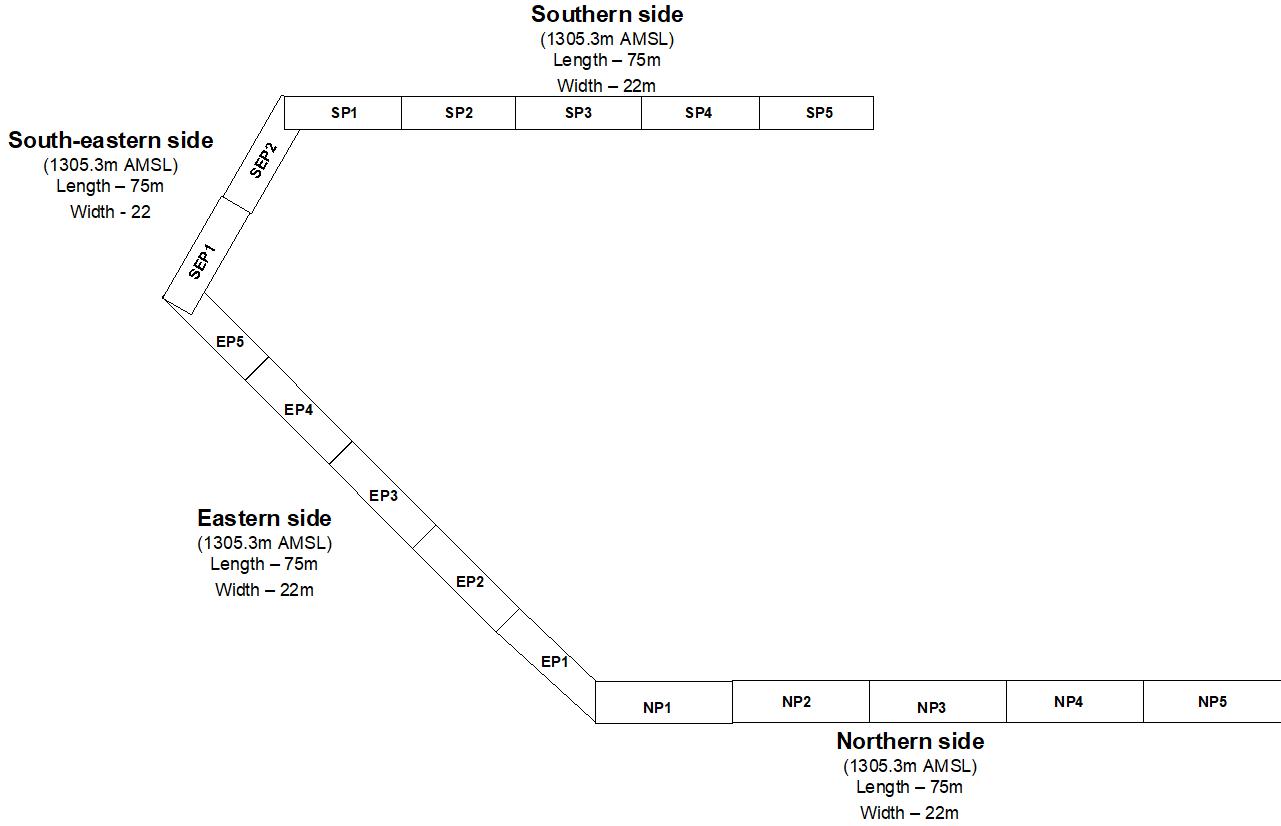
Figure 17.4 Tailings storage facility Dam 5 cross section and plan schematic of construction, December 2023
| 17.8 | Site monitoring |
BMC Zimbabwe undertakes the following site monitoring:
| — | Waste rock disposal. |
| — | Tailings: |
| — | Water inflows and outflows including water in tailings, precipitation, return water recycling, evaporation, seepage losses and interstitial water. |
| — | Dam freeboard monitoring. |
| — | Phreatic surface level monitoring via six piezometers installed on TSF Dam 5. |
| — | Underdrain flow and seepage monitoring. |
| — | General waste. |
| Project No PS229049 | WSP |
| How Mine | March 2026 |
| S-K 1300 Technical Report Summary | Page 121 |
| Namib Minerals |
| — | Sewerage effluent. |
| — | Atmospheric pollution and quality monitoring of all air emission points. |
| — | Water quality monitoring. |
| — | Blast design, implementation and monitoring for fly rock control (if required). |
| 17.9 | Water management |
The EMP covers provisions for water management in terms of pit and underground dewatering; pollution prevention; training and awareness; update of the site wide water balance and groundwater model using dewatering and water quality monitoring data; third party compensation for loss of water supply; monitoring of seepage quality by quarterly sampling of tailings, toe drains and return water dams; containment and emergency response procedures.
Water management also forms part of the mine closure planning detailed under Section 17.12. The mine closure plan covers provisions for modification and repair of site drainage and monitoring of surface water, groundwater, underground mine flooding, the site water balance and tailings dam.
| 17.10 | Stakeholder engagement |
| 17.10.1 | Stakeholder engagement plan |
Stakeholder engagement is conducted by BMC Zimbabwe to understand concerns and values regarding the mine. Key interactions with the environment were identified for consideration during operations and decommissioning. Socio-economic and cultural impacts were assessed through stakeholder consultation using various methods to ensure diverse representation. Anticipated population impacts were evaluated by discussing short and long-term effects with representatives from different stakeholder groups.
| 17.10.2 | Consultation |
Stakeholder consultation at the HGM aims to inform stakeholders about operations, impacts, and environmental plans while collecting their concerns. It assessed direct impacts on communities and sought stakeholders’ perspectives on the mine’s effects. Generally, stakeholders supported the operations, with local leadership mainly concerned about employment opportunities for locals and requested assistance in promoting education for local children.
| 17.11 | Cultural, economic, and social conditions |
| 17.11.1 | Cultural heritage |
The cultural landscape at the HGM reflects its historical roots, dating back to pre-independence Zimbabwe, with workers migrating from neighbouring countries. This has led to a mix of nationalities, each with distinct cultural practices. To manage diversity and prevent conflicts, the mine has appointed chiefs in its eight villages. These nationalities further divide into tribal and ethnic groups, including Tonga, Kalanga, Ndebele, Nyanja, Chewa, and Zezuru, each with unique beliefs. There is also diversity in Christian denominations and African Independent Apostolic churches, contributing to the HGM’s social and ethical dynamics.
| Project No PS229049 | WSP |
| How Mine | March 2026 |
| S-K 1300 Technical Report Summary | Page 122 |
| Namib Minerals |
| 17.11.2 | Contributing to the national and local economy |
The initiative also aims to increase employment opportunities and process more minerals to benefit the nation. Zimbabwe has outlined a series of short- and medium-term plans aimed at restoring and enhancing capacities for sustainable socio-economic growth. Therefore, the HGM aims to foster economic transformation within the country. It will contribute to socio-economic development at both local and national levels by improving infrastructure.
| 17.11.3 | Establishing a social management framework |
BMC Zimbabwe recognises its responsibility to the community and actively engages in Corporate Social Responsibility (CSR) initiatives to address local challenges. Current initiatives include the Manager’s Fund, supporting underprivileged school children with tuition fees; providing primary healthcare services to community members, treating 1,500 to 1,900 patients monthly; offering medical support such as Antiretrovirals (ARV’s) to HIV-positive employees and their families; and facilitating transport for children from nearby communities to the HGM Primary and Secondary Schools, easing their daily commute of up to 15 km each way.
| 17.11.4 | Stakeholder engagement |
BMC aims to maintain and update the stakeholder register, including stakeholders’ needs and expectations, and to ensure that all relevant stakeholder groups are consulted.
The mine’s Management of Interested Parties procedure (BEMS-SP-02) ensures the identification, understanding, and fulfilment of stakeholder requirements. Regular engagement with stakeholders, through various channels including physical meetings and virtual communication, enables the mine to establish plans, negotiate agreements, and address concerns to the satisfaction of all parties involved. This proactive approach strengthens relationships with local communities, regulatory bodies, and other interested parties, fostering a positive and collaborative environment.
| 17.11.5 | Impacts on land use and access |
The Property area is characterised by veldt natural vegetation covering gently undulating hills and slopes, with various mixed woodland species present. Despite historical mining and forestry activities dating back to the 1940s, the natural vegetation remains largely undisturbed. However, there are invader plants like Eucalyptus alongside indigenous species in the area.
| 17.11.6 | Protecting community health and safety |
The Public Health Act regulates activities affecting public health, granting powers to health officials and local authorities. Section 82 prohibits activities causing nuisances or health risks, with local authorities responsible for cleanliness and nuisance prevention. Notices are issued to remedy identified nuisances, with fines imposed for non-compliance per Section 87(3). To maintain standards and enhance waste management in workers’ houses, measures should be taken to reduce disease transmission.
| 17.11.7 | Protecting the workforce |
HGM complies with the relevant Zimbabwean legislation as a minimum.
| 17.11.8 | Commitment to local procurement and hiring |
| 17.11.8.1 | Procurement |
BMC policy is that the procurement of all products and services shall be based on competitive bidding. The competitive procurement process is designed to foster an impartial and comprehensive evaluation of multiple quotes, bids or proposals, leading to the selection of the most responsible supplier who can provide the best value to the business. This procurement method also eliminates corrupt and unethical practices, or the appearance of such, in our procurement and contracting processes.
| Project No PS229049 | WSP |
| How Mine | March 2026 |
| S-K 1300 Technical Report Summary | Page 123 |
| Namib Minerals |
Furthermore, it is BMC’s policy to use, whenever possible and practical, local suppliers or contractors that are able to provide products and services of required quality on a timely basis at competitive prices. The benefits of sourcing locally include:
| — | Promoting the use of local suppliers demonstrates BMC’s investment in the local community |
| — | Close proximity makes it far easier to travel to our suppliers for supplier development and contract management purposes, as well as for site inspections |
| — | The local knowledge of local suppliers means that they are well-placed to appreciate and satisfy local preferences – this is particularly relevant where specialized products and services are concerned |
| — | Supply chains are generally shorter, leading to greater certainty and predictability of delivery times. An associated benefit is that logistics costs (e.g. freight, insurance, duty, etc.) are reduced. |
| — | BMC take pride in local suppliers and reserved certain products to local suppliers, including chemicals, explosives, bolts and nuts, timber products, steel balls, fuel, protective equipment (clothing), security services, contract drilling services, power installations, and fencing services. |
Future plans in support of local procurement include:
| — | Identifying local suppliers from less privileged communities, understanding their challenges and providing support such as machinery to facilitate production |
| — | Preference locally produced products and assist with quality production through technology |
| — | Introducing a quarter system in the budget whereby a certain proportion of procurement expenditure is allocated to the local supplier. |
| 17.11.8.2 | Hiring |
The Zimbabwean Labour Relations Act (Chapter 28:01) Revised Edition 1996 Act is set to, among other things, declare and define the fundamental rights of employees; to define unfair labour practices; to regulate conditions of employment and other related matters; to provide for the control of wages and salaries; to provide for the appointment and functions of workers committees; to regulate the negotiation, scope and enforcement of collective bargaining agreements. It also provides for protection of both the employees and employers. The act provides for recruitment to be conducted without discrimination on grounds of race, tribe, and place of origin, political opinion, colour, creed, gender, pregnancy, HIV/AIDS status or any disability. The mine has an operational works council that negotiates wages on behalf of all stakeholders. The HGM has also managed to mainstream HIV and AIDS in the workplace.
HGM aims to give employment opportunities to local people where appropriate. This covers the following commitments:
| — | Contractors will be required to provide skills training and development of the contractor workforce. Contractors will be required to employ local people where appropriate make use of local goods and services where possible and appropriate. |
| — | Conduct a skills assessment in local communities and receive curricula vitae from local communities on a regular basis using an external employment agent. |
| — | Implement formal training policy and programs that aim to improve skills. Programs should be available for all directly and indirectly employed personnel. |
| — | Conduct a skills assessment of all unskilled and semi-skilled employees and design a portable skills training program for the mine’s employees. Portable skills refer to useful economic skills that an employee could use to augment their livelihoods. Typical training courses are basic fitting and turning, vehicle mechanical work, electricity, plumbing, and many other appropriate income-generating skills. |
| Project No PS229049 | WSP |
| How Mine | March 2026 |
| S-K 1300 Technical Report Summary | Page 124 |
| Namib Minerals |
BMC’s ‘BEMS H-R-P-04 Recruitment and Selection Policy and Procedure’ outlines how BMC will strive to resource the mines with the best talent available on the market. This is done in a manner that also recognises and prioritises locals already living within and around the mining operations.
Recruitment and Selection of members of local community is based on the need to ensure this category of individuals is fairly represented and not excluded from operations of the company. This also ensures that the company directly participates in community development by availing career opportunities to members of local communities and at the same time indirectly addressing other community development issues by helping to deal with poverty.
Our local recruitment is driven by a recognition of the need and commitment to utilise local resources and talents already at our disposal, thus benefiting the local communities which are most impacted by our activities.
| 17.12 | Mine closure |
Zimbabwe’s mining sector is governed by key legislation, including the Mines and Minerals Act, the Minerals Corporation of Zimbabwe Act [Chapter 21:04], and the Environmental Management Act. These laws require mining operations to prioritize rehabilitation and restoration of mined land to its pre-mining state.
To ensure responsible mine closure and minimise community impacts, BMC has developed a comprehensive Mine Closure Plan for the How Mine. This plan outlines BMC’s strategies for:
| — | Decommissioning operational infrastructure |
| — | Rehabilitating the environment |
| — | Releasing the area for future use. |
In compliance with regulatory requirements, the Mine Closure Plan is reviewed and updated every decade. The latest plan was developed in 2025, demonstrating BMC’s commitment to sustainable mining practices and community well-being, please refer to 18.1.2.
The mine closure plan, including remediation and reclamation plans, have recently been updated by Enmin in June 2024, including a detailed outline of closure requirements and costs.
The plan envisages that at the conclusion of mining and processing, the land will be rehabilitated. A mine closure plan has been developed that contemplates site closure that will restore the land to its best future use. Closure planning is an iterative process, and ongoing technical studies as well as consultation with local stakeholders will feed into future refinements of the current closure concepts, prepared on a regular basis by BMC Zimbabwe’s selected external consultant. The implementation and success of the plan will be monitored until the site achieves an environmentally and socially acceptable and sustainable state.
The conceptual mine closure plan indicates that closure will be required after approximately 3 years of mining the remaining Mineral Reserve, although this may extend if additional Mineral Resources are converted to Mineral Reserves as part of an annual update. Studies are ongoing to determine the potential for further extraction. On exhaustion of Mineral Reserves, the underground mine will be closed and the ore handling and processing facilities will be decommissioned. This will entail dismantling, demolition and removal of equipment and buildings, reshaping and re contouring of land surfaces and rehabilitation of occupied areas. Dewatering of the underground mine will cease upon completion of mining and allowed to fill with water. As far as practicable, the land occupied by the mine and its infrastructure will be returned to its former land use. The mine, plant area and waste emplacements and other works will be made safe for the community including the placement of barriers to discourage people from entering the mined-out workings. A public education program on safety issues associated with the mine and any excavated areas will be conducted. A passive water management system will be implemented so that adequate protection for surrounding water resources can be provided without ongoing active management by BMC Zimbabwe.
| Project No PS229049 | WSP |
| How Mine | March 2026 |
| S-K 1300 Technical Report Summary | Page 125 |
| Namib Minerals |
The closure phase will also require the management of social issues including retrenchment of the workforce and managing the implications of loss of local employment and business. To mitigate the social impacts commonly associated with mine closure, the Mine Closure Plan includes components related to social and community impacts. The plan will be developed in consultation with relevant authorities, the workforce, and local communities.
| 17.13 | Translating the ESIA into environmental and social management |
After conduction of ESIA the Mine develops Environmental plans CSR plans to implement commitments, requirements and request made by stakeholders during public consultations. Check 2025 EMP and CSR plans for 2025.
| 17.14 | QP’s opinion |
| 17.14.1 | Legal |
Namib Minerals has advised that it does not have any outstanding legal issues that would affect the capacity to estimate a Mineral Reserve.
| 17.14.2 | Social and environment |
Namib Minerals has advised that there are no social or environmental issues that pose a risk to the operation and that all necessary permits are in place. However, WSP recommends a more detailed audit of TSF capacity over the LOM, compliance monitoring, community and environmental management plans, costs, and liabilities on an ongoing basis. Community and environment issues often require sustained management focus in these jurisdictions.
| 18 | Capital and operating costs |
Capital and operating cost estimates have been prepared by HGM to generate a 4-year Mineral Reserves only plan, plus 1 year for mine closure. WSP has analysed historical physical quantities, operating and capital costs of operation over the past 3 years 2023 – Q1 2026, and estimated an additional 5% contingency which has been applied to all operating and capital costs. Mine closure independently includes a contingency of 15.0%.
| Project No PS229049 | WSP |
| How Mine | March 2026 |
| S-K 1300 Technical Report Summary | Page 126 |
| Namib Minerals |
Capital costs total US$30.0 M comprising sustaining capital of US$27.6 M, growth capital of US$2.4. M (only in CY2025 for underground and process plant production upgrades. Growth capital of US$2.4 M is incurred only in 2025 for underground Mineral Reserve block access and process plant production upgrades. A mine closure cost estimate of US$8.1 M (assuming a planned closure scenario) has been updated December 2025 in a review undertaken by Enmin Consulting (Private) Limited (Enmin).
Operating costs total US$123.5 M (averaging US$77.12/t processed) comprising direct operating C1 costs of US$108.5 M (US$67.81/t processed) and fixed overheads US$14.9 M (US$9.33/t processed).
Given the historical track record of operation of the HGM, and a 5% contingency allowance for both operating and capital costs, WSP views the cost estimates comply with the level of accuracy required by § 229.1302 (Item 1302 of Regulation S–K). The capital and operating cost estimate accuracy is assessed at +15% while a 5% contingency allowance on all costs is consistent with recent historical variability as a provision for any additional, unforeseen costs associated with unanticipated geologic circumstances, engineering conditions and unanticipated geopolitical conditions.
| 18.1 | Capital costs |
Capital costs for growth, sustaining and mine closure are detailed under this Section. Capital costs prepared for the Mineral Reserves LOM plan are provided in Table 18.1. The sustaining and growth capital costs have been adjusted to reflect the tonnage proportion of Mineral Reserves by year in the HGM strategic LOM plan, which includes MII resource inventory material. Mine closure costs have not been adjusted for the proportion of Mineral Reserves tonnage but have been assumed as estimated by Enmin, an external consultant specialising in this area.
A contingency allowance of +5% has been applied for growth and sustaining capital while a contingency of 15.0% has been applied for mine closure capital costs.
| 18.1.1 | Growth and sustaining capital |
Growth and sustaining capital costs for the project over the estimated 4-year LOM are provided in Table 18.1. Capital upgrades mainly relate to projects associated with increasing mine production and plant throughput from 40 ktpm to 55 ktpm:
| — | 10–20 MVA transformer upgrade. |
| — | Underground 33 Level loading station and conveyor. |
| — | CIP tank refurbishment. |
| — | Crushing plant upgrades. |
| — | North shaft conveyor from shaft to ROM feed. |
| — | North shaft winder upgrades. |
| Project No PS229049 | WSP |
| How Mine | March 2026 |
| S-K 1300 Technical Report Summary | Page 127 |
| Namib Minerals |
Table 18-1 Mineral Reserves summary capital expenditure for FY 2026-2029
| LOM Capital Costs US$’000 | |||||
| Category | 2026 | 2027 | 2028 | 2029 | Total |
| Underground Plant & Equipment | 3,437 | 618 | 965 | 1,282 | 6,302 |
| Surface Plant & Equipment | 2,807 | 461 | 82 | 494 | 3,844 |
| Other Surface Costs | 4,829 | 10 | 97 | - | 4,936 |
| Housing & Amenities | 1,032 | 1,315 | 1,315 | 1,315 | 4,976 |
| Furniture & Fittings | 306 | 145 | - | 145 | 597 |
| Insurance Spares | 537 | 704 | 475 | 662 | 2,378 |
| Vehicles | 1,038 | 90 | 336 | 90 | 1,554 |
| Projects and Exploration | 3,586 | 3,130 | 3,380 | 2,661 | 12,757 |
| Subtotal Sustaining Capex | 17,574 | 6,472 | 6,649 | 6,649 | 37,344 |
| Subtotal Growth Capex | - | - | - | - | |
| Contingency +5% | - | - | - | - | - |
| Mine Closure +12.63% contingency | - | - | - | - | |
| GRAND TOTAL | 17,574 | 6,472 | 6,649 | 6,649 | 37,344 |
Source: BMC Financial Model Reserves Feb 2026 20260226
| 18.1.2 | Mine closure costs |
Mine and social closure costs have recently been updated in December 2025 by Enmin. These costs comprise allowances for environmental rehabilitation, social closure, and equipment salvage. The total cost is estimated at US$8.1 M assuming a Planned Closure scenario in accordance with the LOM plan, inclusive of a 15% contingency (Table 18.2), while this increases to US$16.0 M assuming an Unplanned closure scenario. Equipment Salvage cost will only be considered in Unplanned Closure as this cost forms a part of BMC’s operational cost. Social closures costs will only be borne during unplanned closure of the mine. For planned closure, the HGM will have the opportunity to give sufficient notice to its employees on the closure of the HGM, thus avoiding this additional cost. The Planned Closure cost estimate is adopted for cashflow model evaluation.
Table 18-2 HGM present closure obligation (Enmin 2025)
| Item No. | Activity | Cost (US$) | |
| Planned Closure | Unplanned Closure | ||
| 1 | Environmental Liability | 6,656,256 | 6,324,738 |
| 2 | Social Liability | 6,779,300 | |
| 3 | Equipment Salvage | 272,759 | |
| Sub-total | 6,365,468 | 13,376,797 | |
| Operation & Maintenance Costs @6% of Total Closure Cost | 459,281 | 802,608 | |
| Contingency 15% | 998,438 | 1,791,535 | |
| Total Mine Closure Costs | 8,113,976 | 15,970,940 | |
| 18.2 | Operating costs |
Inspection of the breakdown of annual production and cost performance over the past three years (CY2023-CY2025), indicates that operating unit costs have averaged US$80.67/t. BMC Zimbabwe forecast to achieve a reduction in operating costs by 13% to US$72/t as a function of the capital upgrade program to increase throughput from 40 ktpm to 55 ktpm, plus additional business improvement initiatives relating to power and water supply. This is judged as achievable with Q1 2025 costs averaging $79.18/t and a 55%/45% fixed/variable cost analysis confirming the potential cost reduction to these levels.
| Project No PS229049 | WSP |
| How Mine | March 2026 |
| S-K 1300 Technical Report Summary | Page 128 |
| Namib Minerals |
Operating costs have been prepared based on a 4-year Mineral Reserves only schedule assuming unit operating costs that compare well with actual costs from CY2023–CY2025. Operating costs total US$123.5 M (averaging US$77.12/t processed) comprising direct operating C1 costs of US$108.5 M (US$67.81/t processed) and fixed overheads US$14.9 M (US$9.33/t processed).
Direct operating costs cover mining and processing functions. Fixed overheads cover the cost of rehabilitation, non-production power, environment, administration costs (Zimbabwe and UK), employee welfare, sale of scrap, exchange gains/losses, and intercompany balances written off. Exploration costs are generally covered under capital but excluded here for assessment of a Mineral Reserves only LOM plan.
Table 18-3 HGM Mineral Reserves LOM OPEX
| HGM Forecast | ||||||
| Year | Unit | Total | 2026 | 2027 | 2028 | 2029 |
| Ore Milled | kt | 1,601 | 286 | 497 | 505 | 313 |
| Head Grade | g/t | 1.50 | 1.54 | 1.35 | 1.72 | 1.32 |
| Recovery | % | 89 | 89 | 89 | 89 | 89 |
| Au Production | koz | 69 | 13 | 19 | 25 | 12 |
| KPIs | ||||||
| Operating Costs (C1) | US$/tonne | 86 | 71 | 71 | 70 | |
| US$/oz | 2,112 | 2,002 | 1,611 | 2,002 | ||
| AISC | US$/t | 3,031 | 2,520 | 2,019 | 2,854 | |
Source: BMC Financial Model Reserves Feb 2026 20260226
Notes: Operating C1 costs are inclusive of operating costs, royalties, and realisation costs. Fixed overheads averaging US$3.73M per annum or US$9.33/t are excluded. All-In-Sustaining-Costs (AISC) are C1 Costs plus fixed overheads and sustaining capital.
| 18.3 | Contingency |
A 5% contingency allowance for both capital and operating costs has been applied based on a review of costs over the past 3 years CY2023 through to Q1 2026 including strong consideration for the mine being a well-established operation. This estimate has also been applied historically.
Please note that the total capital spend has traditionally been below budget over the past 3 years.
Accordingly, the assumption of a +5% contingency for operating costs is considered conservative and appropriate.
| Project No PS229049 | WSP |
| How Mine | March 2026 |
| S-K 1300 Technical Report Summary | Page 129 |
| Namib Minerals |
| 19 | Economic analysis |
| 19.1 | Summary |
WSP has adopted a conservative approach considering a cashflow model based on a Mineral Reserves only inventory, 1.6Mt at 1.50g/t Au for 77koz gold production (69 koz after the 89.0% metallurgical recovery is applied), scheduled for mining and processing over 4 years at a metallurgical recovery rate of 89%. WSP considered HGM’s operating cost and capital requirements at a cost centre level, and applied 5% contingency to all costs. Mine closure costs have been assumed at US$8.1M in Year 4.
A further 892 kt at 0.89 g/t Au of Probable Reserve in a surface sands (tailings) stockpile has not been incorporated to the cashflow model as it would displace higher grade underground ore. This remains as upside if processed at the conclusion of underground mining.
The economic viability of the sands mining has been included by cut-off grade and pay limit calculations that adopt a mining and processing cost of US$20.54/t, a gold price of US$3,272/oz (US$3,600/oz for the Mineral Resource estimate) and process recovery of 50% (a 0.46 g/t fixed tail). Under these circumstances, a cut-off grade/pay limit has been estimated at 0.66 g/t, below the average Sands Mineral Reserve grade of 0.89 g/t.
| 19.2 | Methodology |
| 19.2.1 | Modelling approach |
| — | HGM uses statistical analysis and economic modelling for the assumptions adopted by the QP in the Mineral Reserves LOM Forecast. |
| — | An after-tax cash flow modelling approach has been adopted that considers direct operating (mining, processing, administration, corporate administration, royalty, refining), capital (sustaining, growth, mine closure), net revenue (inclusive of 5% royalties and realisation costs), depreciation, finance (loan, working capital), investing, dividend and tax costs. Exploration costs are excluded as these activities are not required for the defined Mineral Reserve base. |
| — | Loan and financing costs are excluded, given strong positive cashflows. An annual dividend allowance has been excluded as this will be allocated out of positive discounted cashflow. |
| — | Zimbabwean corporate tax is applied at the rate of 25.75% with allowance for capital depreciation over the 3-year active mine life. |
| — | A gold price of US$3,272/oz is applied based on the average of the trailing 2-year average gold price to end December 2025 and the forecast CY 2026 gold price. |
| — | Royalties are levied at the rate of 5% for a price of gold revenue for a price up to $5,000/oz and 10% above $5,000/oz. |
| — | Realisation costs to cover dore transport and refining is included at the rate of US$0.65/oz. Sale of gold to the Fidelity refiner is mandated by government and revenue received is based on spot pricing, with 70% paid in local currency and 30% paid in ZiG local currency. No discount to account for local currency risks has been applied as these risks are judged to be mitigated for the following reasons: |
| — | The assumed US$3,272/oz gold price is a discount of 2% to the spot pricing levels US$3,322/oz (end December 2025). |
| — | Forecast gold prices are expected to improve (Trading Economics, AXI). |
| Project No PS229049 | WSP |
| How Mine | March 2026 |
| S-K 1300 Technical Report Summary | Page 130 |
| Namib Minerals |
| 19.2.2 | Sources of assumptions |
Cashflow model assumptions are detailed in Table 19.1 and drawn from BMC and industry sources, reviewed and utilised by WSP.
Table 19-1 HGM Mineral Reserve cashflow modelling assumptions
| Parameter | Unit | Total | Source |
| Gold conversion factor | gm to oz | 31.10348 | Standard |
| Metallurgical gold recovery | % | 89.0% | 3-year trailing average |
| USD denominated sales | % | 70% | Zimbabwean Government |
| Royalties | % | 5% (≤ US$5000/oz), 10% (> US$5000/oz). | Zimbabwean Government |
| Realisation (FP&R) | US$ per oz | 0.65 | HGM per Fidelity |
| Cost/t – ROM | US$ per tonne | 77.12 | Average Mineral Reserves LOM estimate |
| Average Overhead cost/annum | US$’000 | 3,338 | WSP from 2025 HGM actuals |
| Corporate income tax | % | 25.75 | HGM |
| Fixed asset depreciation | LOM yrs | 3 | HGM |
| Cost of capital (Discount Rate) | % | 19 | HGM |
| Loan compound interest rate | % | 13 | HGM |
| Loan amount | US$’000 | 3 863 | HGM |
| Loan tenure | Yrs | 3 | HGM |
| Gold price | US$ / oz | 3,272 | As detailed above. Note US$3.332/oz as at end December 2025 |
Source: BMC Financial Model Reserves Feb 2026 20260226
| 19.2.3 | Financial |
Financial details for HGM are presented in Table 19.1. No loan is required as capital can be funded out of positive cashflows.
| 19.2.4 | Pricing and revenue |
Pricing and Revenue used for any computation regarding the project has been addressed in Table 19.1 and detailed in Section 18.
Metal prices adopted for the LOM have been reviewed and aligned to an average of the 2-year trailing average price and the CY2026 forecast estimate for gold as at end December 2025, the reporting date for the Mineral Reserve. A gold price of US$3,272/oz is assumed for the LOM. The net price received has been adjusted in line with the current (RTGS) split of 70/30%. Gold proceeds are paid 70% in USD and 30% in local currency with effect from February 2025 (previously 75% USD and 25% in local currency). Sale of gold under these terms has been mandated by the Zimbabwean Government since the start of 2020.
| Project No PS229049 | WSP |
| How Mine | March 2026 |
| S-K 1300 Technical Report Summary | Page 131 |
| Namib Minerals |
| 19.2.5 | Taxes and royalties |
Government royalties are paid at the rate of 5% (≤ US$5000/oz), 10% (> US$5000/oz) on gross gold revenue.
Realisation costs in terms of refining by Fidelity are paid at the rate of US$0.65/oz. Transport costs are covered separately under Fixed Overhead Indirect costs.
Zimbabwean corporate tax is levied at the rate of 25.75% with allowance for depreciation over the LOM.
| 19.0 | Capital costs |
Capital costs prepared by HGM are detailed in Section 18.1 of this report. An additional 5% contingency has been applied to all capital costs including sustaining and growth capital. A 15.0% contingency has been separately applied for mine closure costs. Growth and sustaining capital cost allocations have been adjusted from the LOMP for the Mineral Reserve Only LOMP. Mine closure capital costs have been assumed at US$8.1M based on an external expert consultant, Enmin (June 2025).
| 19.1 | Operating costs |
WSP utilised the recent (CY2025) operating cost average of US$79.18 for its initial cut-off calculations.
These cut-offs were used to determine the final optimised HGM Mineral Reserve CY2025. The final Mineral Reserve mining schedule was then used to complete the required LOM economic analysis.
The LOM economic analysis calculates discrete, and total, operating costs on a monthly basis for the LOM which differs month to month from the initial estimate used in the cut-off calculations. This is part of the mine planning process and accepted industry practice.
Operating costs prepared by HGM are detailed in Section 18.2 of this report.
| 19.2 | Cash flow |
WSP has prepared a cashflow evaluation to test the economic viability of mining and processing only the Proved and Probable Mineral Reserves as presented in Table 19.2 and the sensitivity graphs in Figure 19.1. This scenario assumes:
| — | A discount rate of 19%. |
| — | Mining and processing representing the scheduled, extractable Mineral Reserve base. |
| — | 4 year mine plan, and 1 year for mine closure. |
| — | Updated mine closure cost estimate of US$8.1 M based on a planned closure scenario and scheduled in the year following completion of processing. These costs have not been discounted for inventory scale. |
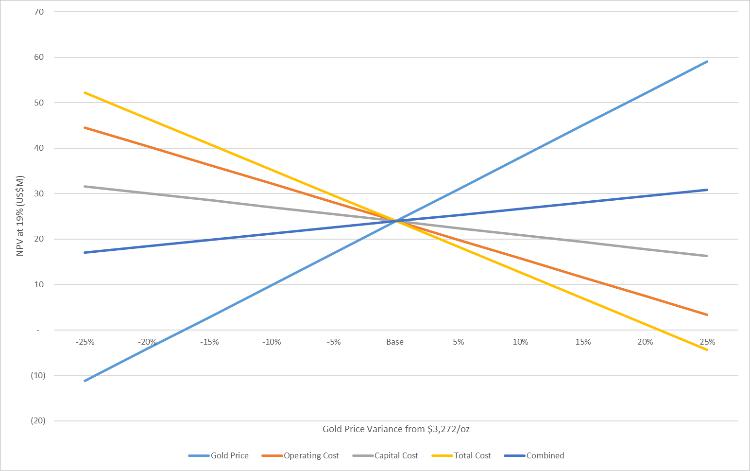 | 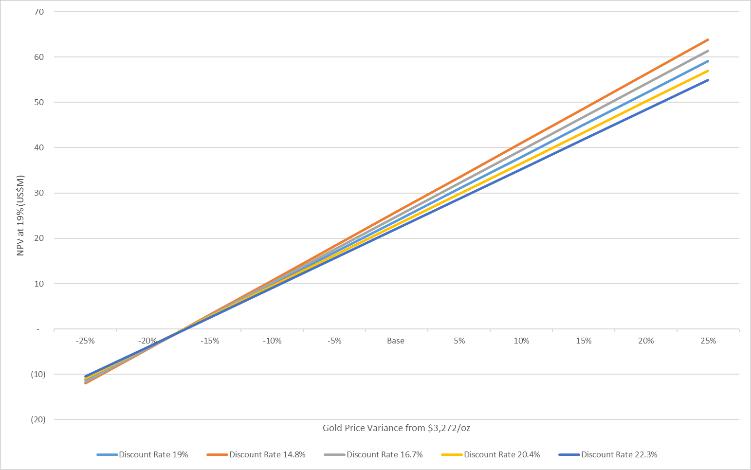 |
| Figure 19.1 | Mineral Reserves only project NPV and sensitivity analysis |
| Project No PS229049 | WSP |
| How Mine | March 2026 |
| S-K 1300 Technical Report Summary | Page 132 |
| Namib Minerals |
Table 19-2 HGM cashflow analysis prior to depreciation, financing, and tax – Mineral Reserves (Proved and Probable only)
| Year | Unit | Total | 2026 | 2027 | 2028 | 2029 |
| Income statement | ||||||
| Revenue USD | [US$ ’000] | 154,953 | 40,710 | 61,979 | 80,421 | 38,251 |
| Revenue ZWG | [US$ ’000] | 66,408 | 12,213 | 18,594 | 24,126 | 11,475 |
| Gross revenue | [US$ ’000] | 221,361 | 40,710 | 61,979 | 80,421 | 38,251 |
| Royalties | [US$ ’000] | -11,068 | -2,036 | -3,099 | -4,021 | -1,913 |
| Realisation | [US$ ’000] | -86 | -16 | -24 | -31 | -15 |
| Net revenue | [US$ ’000] | 210,207 | 38,659 | 58,856 | 76,369 | 36,324 |
| C1 costs | [US$ ’000] | -117,670 | -24,564 | -35,275 | -36,054 | -21,778 |
| Overheads | [US$ ’000] | -13,935 | -3,538 | -3,472 | -3,487 | -3,438 |
| EBITDA | [US$ ’000] | 78,602 | 10,557 | 20,109 | 36,828 | 11,108 |
| Depreciation | [US$ ’000] | -57,097 | -11,305 | -12,985 | -14,258 | -18,549 |
| EBIT | [US$ ’000] | 21,505 | -748 | 7,123 | 22,571 | -7,441 |
| Finance costs | [US$ ’000] | -2,356 | -1,053 | -720 | -301 | -282 |
| PBT | [US$ ’000] | 19,149 | -1,802 | 6,403 | 22,270 | -7,441 |
| Corporate income tax | [US$ ’000] | -8,709 | -2.393 | -1,664 | -5,882 | 1,230 |
| Net income | [US$ ’000] | 10,440 | -4,194 | 4,739 | 16,388 | -6,493 |
| Cash flow statement | ||||||
| EBITDA | [US$ ’000] | 78,602 | 10,557 | 20,109 | 36,828 | 11,108 |
| Corporate income tax | [US$ ’000] | -16,651 | -2,460 | -4,303 | -7,948 | -1,941 |
| Working capital | [US$ ’000] | 21,159 | 14,278 | -3,651 | 8,219 | 2,313 |
| Operating cash flow | [US$ ’000] | 83,109 | 22,375 | 12,155 | 37,099 | 11,480 |
| Sustaining capex | [US$ ’000] | -27,801 | -8,031 | -6,472 | -6,649 | -6,649 |
| Growth capex | [US$ ’000] | -17,302 | -9,543 | 0 | 0 | 0 |
| Mine Closure | [US$ ’000] | 0 | 0 | 0 | 0 | -8,114 |
| Investing cash flow | [US$ ’000] | -45,103 | -17,574 | -6,472 | -6,649 | -14,743 |
| Loan drawdown | [US$ ’000] | 1,500 | 0 | 0 | 0 | 0 |
| Finance costs | [US$ ’000] | -1,228 | -772 | -438 | -19 | 0 |
| Loan repays | [US$ ’000] | -4,631 | -2,055 | -2,397 | -179 | 0 |
| Dividends paid | [US$ ’000] | -66,500 | -9,600 | -9,600 | -31,300 | -16,000 |
| Financing cash flow | [US$ ’000] | -70,859 | -10,927 | -12,435 | -31,498 | -16,000 |
| Opening cash | [US$ ’000] | 765 | 5,567 | 11,250 | 41,699 | |
| Project No PS229049 | WSP |
| How Mine | March 2026 |
| S-K 1300 Technical Report Summary | Page 133 |
| Namib Minerals |
| Year | Unit | Total | 2026 | 2027 | 2028 | 2029 |
| Free cash flow | [US$ ’000] | 4,802 | 5,683 | 30,450 | -3,263 | |
| Closing cash | [US$ ’000] | 5,567 | 11,250 | 41,699 | 38,436 | |
| DCF valuation | ||||||
| Undiscounted cash flow | [US$ ’000] | 1,200 | 4,802 | 5,683 | 30,450 | -3,263 |
| Period | [-] | 1 | 2 | 3 | 4 | |
| Discount factor | [-] | 1.19 | 1.41 | 1.67 | 1.98 | |
| Discounted cash flow | [US$ ’000] | 24 886 | 4,050 | 4,043 | 18,274 | -1,482 |
| UDCF (active) | 38 006 | 4,802 | 5,683 | 30,450 | -3,263 | |
| KPIs | ||||||
| Operating costs (C1) | [US$ / tonne] | 74 | 86 | 71 | 71 | 70 |
| [US$ / oz] | 1 932 | 2,112 | 2,002 | 1,611 | 2.002 | |
| AISC | [US$ / tonne] | 2 606 | 3,031 | 2,520 | 2,019 | 2,854 |
| Spot Price | $/OZ | 3,272 | 3,272 | 3,272 | 3,272 | 3,272 |
| 19.3 | Economic evaluation and sensitivity analysis |
Key outcomes of the cashflow evaluation and sensitivity analysis on an after-tax basis, considering Mineral Reserves only are:
| — | A positive project NPV of US$22.1 M when Mineral Reserves only (PP) are considered over a 4-year LOM. |
| — | The project value is most sensitive to operating costs then gold price, but relatively less sensitive to capital cost. |
| — | The project value is relatively less sensitive to discount rate over a 11% – 20% range and gold price range from -25% (US$2,454/oz) and +25% (US$4,090/oz). |
| — | Project breakeven for the Mineral Reserve inventory is a 24% fall in gold price (US$2,640/oz) or a 37% increase in total cost. |
| — | On this basis, the economic analysis is judged sufficiently robust to provide breakeven economics within a +10% level of accuracy and <15% contingency. |
| Project No PS229049 | WSP |
| How Mine | March 2026 |
| S-K 1300 Technical Report Summary | Page 134 |
| Namib Minerals |
| 20 | Adjacent properties |
There are no other significant mining operations in the immediate vicinity of the HGM, though several small, narrow reef historical mine workings do exist within the HGM ML area.
All these historical workings are currently inactive but are considered targets for exploration.
No data or other information from these historical adjacent properties were used in the preparation of this TRS.
| 21 | Other relevant data and information |
WSP is not aware of any other relevant data or information other than that disclosed in this TRS, that materially affects the information included in this TRS and that all material assumptions and parameters underpinning Mineral Resources and Mineral Reserve estimates continue to apply and have not materially changed since the 2024 MRMR.
Please note that the MRMR utilises a new block model and an improved gold price.
| 22 | Interpretation and conclusions |
| 22.1 | Mineral Resources interpretations and conclusions |
| — | Based on the information presented in this TRS, the QP’s key conclusions are as follows: |
| — | The levels of understanding of the regional geology, local geology and the nature and controls on mineralisation are high, and provide a solid foundation for geological modelling, Mineral Resource estimation, and mining and exploration geology. |
| Project No PS229049 | WSP |
| How Mine | March 2026 |
| S-K 1300 Technical Report Summary | Page 135 |
| Namib Minerals |
| — | The drilling, sampling, assay and Quality Assurance Quality Control (QAQC) techniques used for both exploration and resource estimation are consistent with standard industry practice, and are considered appropriate for the purposes of geological modelling and Mineral Resource estimation. |
| — | The on-site assay laboratory is well-equipped, clean and maintained and is suitable for the work it is being utilised for. |
| — | The Mineral Resource estimate uses ordinary kriging which is considered appropriate for the mineralisation style. |
| — | Grade estimates were constrained to updated mineralisation wireframes during grade estimation and includes mineralisation with a lower cutoff of 0.36 g/t Au. |
| — | Quality Assurance Quality Control (QAQC) techniques used for both exploration and resource estimation are consistent with standard industry practice and are considered appropriate for the purposes of geological modelling and Mineral Resource estimation. |
| — | Estimates utilise all available samples, including channel, sludge and diamond drill core samples and incorporate level mapping where available. |
| — | Dry bulk density of 2.8 tonnes per cubic metre (t/m3) was assigned for all mineralised domains. |
| — | Statistical validation of the Mineral Resource estimate as well as visual validation has been completed and demonstrates a robust estimate which correlates well to the input data. |
| — | RPEE has been considered, and the parameters used are considered reasonable. The Mineral Resource estimate has been reported withing Mineable Stope Optimiser (MSO) shapes demonstrating reasonable prospects of economic extraction. |
| — | The Mineral Resource classification that has been applied is considered appropriate. |
| 22.2 | Mineral Reserves interpretations and conclusions |
The QP is satisfied with the basis for estimation and update of the CY2025 Mineral Reserves. The outlook for the Mineral Reserve and LOMP has improved on a number of fronts being:
| — | Completion of the shaft deepening to the 34L to allow access to target mining blocks and installation of a loading pocket. Further shaft deepening to the 36L is planned and possibly an extension to 38L with sufficient further work and justification. This opens the asset up to further LOMP improvements, and stoping optionality, which de-risks the annual mine plan. |
| — | Process plant capital upgrades and improvements are ongoing to provide improved plant reliability and performance. Based on recent successes WSP is confident these will be implemented successfully. |
| Project No PS229049 | WSP |
| How Mine | March 2026 |
| S-K 1300 Technical Report Summary | Page 136 |
| Namib Minerals |
| — | Increases to the Mineral Resource raises the possibility that further strategic analysis of the asset may improve conversion to a greater Mineral Reserve, including the ability to develop and include low grade mineralisation, resulting in an improved and increased LOMP. WSP recommends completing a strategic analysis for the asset as part of the mine planning improvements based on the developing use of modern mining software and mine planning practices. |
| — | Improvements to the gold price over the last 12 months has significantly strengthened the financial basis of the asset. Further increases to the gold price may further improve the Mineral Reserve and subsequent economic strength. WSP recommends developing a robust and externally reviewed, macro-economic forecast that will be a critical input into the recommended strategic analysis. |
| — | The mining methods are appropriate to the style and type of mineralisation and are based on a history of successful implementation. As mining extends at depth and ground stress fields increases, HGM has taken steps to measure the stress field and provide inhouse and external technical support to the mining method. WSP believes that modern mechanical methods of extraction and extraction practices should form part of any strategic analysis. |
| — | The surface sands Mineral Reserve estimate is appropriately based on a survey solid wireframe, resource model and pay limit estimate (0.89 g/t Au). The sands reserve is not currently included in the LOM plan since it would displace higher grade underground resource but remains as potential project upside at the conclusion of underground mining and processing. |
| — | The economic analysis for the Mineral Reserve showed that HGM is developing and improving their financial models allowing a greater understanding of cost drivers and the ability to discretely assess variable and fixed costs which is key to eventual costs reduction strategies and the ability for HGM to optimise the project. |
| — | Capital and operating costs for the operation are considered appropriate and compare well with historical benchmarks, contracts and quotations. No contingency allowance is included in HGM estimates but subsequently added at the rate of 5% by WSP. |
| — | The site visit undertaken in February 2026 showed a strong focus on safety and a respectable recent safety record. This is a strong positive for the asset as poor safety standards may cause significant production disruption, in addition to the health and safety effects on the workforce. |
| — | The ventilation system underground at HGM is adequate for the current annual extraction schedule. Although the mine is developing into deeper zones, relatively speaking, the number of active headings and the total extraction output remains steady for the forward Mineral Reserve plan. In the QP’s opinion the majority of underground mines have opportunity to improve ventilation network efficiency but the QP does not believe there is a risk to the Mineral Reserves mining plan due to the underground ventilation network. |
| — | WSP is aware of a large, failed section of the mine between 20L and 26L deemed the ‘accumulations’. During the site visit it was communicated to WSP that there may be a possibility of a 60% recovery of this material, but WSP believes further work is needed to verify the ability to extract this material safely and without significant dilution. This material has not been included in the Mineral Reserve at this time but is potentially an upside to the estimate. |
| Project No PS229049 | WSP |
| How Mine | March 2026 |
| S-K 1300 Technical Report Summary | Page 137 |
| Namib Minerals |
| 23 | Recommendations |
Based on the results presented in this TRS, and consistent with Namib’s (formerly BMC Limited’s) long standing operating practices, ongoing technical work will be performed on the Property as part of studies to improve confidence, decrease risk, and enable the conversion of Mineral Resources to Mineral Reserves.
The following items are recommended to sustain Mineral Resources and Mineral Reserves.
| 23.1 | Mineral Resources recommendations |
| — | Data and database management requires additional work to streamline the existing process and remove the current need for manual transcription of assay results and other data and to ensure built in validation of data is performed. It is recommended that HGM invest in a corporate database with inbuild validation routines and reporting functionality to assist with the large amount of geological information currently housed in excel spreadsheets. |
| — | Consider the creation of a lithology and a structural model to help guide the mineralisation modelling and assist in more robust domaining of the mineralisation. |
| — | Further bulk density testwork should be completed to ensure the values used in the Mineral Resource are appropriate and suitable for use across the deposit. It is recommended that BD values are reviewed by lithology and area of the mine to determine whether different values would be more appropriate. |
| — | Consider changing the down hole survey method currently used to a north seeking gyro tool to minimise the impact of magnetic material currently influencing the surveys at depth. |
| — | Include blank material with every laboratory submission to test the amount of contamination between samples through the sample preparation stages at the laboratory. |
| — | Undertaking core photography will provide a lasting record of drilling, particularly useful when mining historic areas where the core has already been disposed of. |
| — | Mineral Resource reconciliation practices should be reviewed, and a system implemented that provides a measure of the estimate’s performance. It is recommended that mined development and production be reconciled monthly, and stope close-out reports be developed for each completed stope. |
| 23.2 | Mineral Reserves recommendations |
| — | Design wireframes should be prepared for all Mineral Reserve blocks that appropriately account for design constraints in terms of resource mineralisation widths, stope widths, crown/sill/rib pillars and any geotechnical constraints particularly as the mining extends at depth. Integrated as-mined and design wireframe models should be prepared with all wireframes flagged to allow ease in reporting. Ore production from development should be monitored, recorded and reconciled on an ongoing basis. Broken ore stocks should be reconciled on a monthly basis, both for underground stopes and surface stockpiles. This will allow reconciliation of the variance between break, hoist and reconciled mill feed (weightometer). The gap observed between claim hoist and process feed should be identified. A complete review of the reconciliation process should be undertaken to confirm the gross level of dilution and ore loss, planned (via stope design), unplanned (operational) and actual. The manner of application of the MCF to grade alone should be reviewed in concert with the reconciliation review. Any remaining manually prepared or AutoCAD plans prepared for the Mineral Resources and Mineral Reserves should be converted to stope wireframe designs allow ease of interrogation and analysis using the consolidated resource model. Recovery factors should be applied to tonnage estimates, as per the WSP TRS work, to derive extractable reserves for all Mineral Reserve blocks. These extractable reserve tonnage and diluted grade estimates should be adopted in scheduling. Dam Sands process amenability should be reviewed with respect to potential for impurities, deleterious elements and pregnant solution robbing materials. Process variability testwork should be revisited. |
| Project No PS229049 | WSP |
| How Mine | March 2026 |
| S-K 1300 Technical Report Summary | Page 138 |
| Namib Minerals |
| — | The use of conversion factors other than the gold grams to troy ounces conversion factor of 31.10348 gm/oz should be avoided as several inconsistencies were corrected in the supplied financial models. |
| — | The potential for blending sands with underground ore treatment to optimise plant throughput, gold recovery, costs and returns should be assessed. |
| — | Subject to capital and ventilation constraints, the QP recommends consideration be given to implementing more modern, mechanised mining techniques to improve productivity and production tonnage per personnel-shift. This will need to take appropriate account of the existing underground infrastructure and ventilation constraints. |
| — | Ore tonnages are reported on a dry basis. Recent inspection in February 2026 indicates that the mine is relatively dry. Density estimates are applied at one significant decimal place. WSP recommends estimating average densities either by interpolation within the resource model by lithology or by reconciliation to derive an average dry density estimate to two significant decimal places. |
| — | Review of application APF, BF, and BCF modifying factors based on gold metal content and applied solely as a grade factor. This should be incorporated into the developing electronic mining schedule. |
| — | Review of average mineralisation width, stope block width and diluent grade to ensure that appropriate account is made for both practically achievable mining widths and dilution estimates. |
| 24 | References |
BMC (2024). Bulawayo Mining Company Corporate Social Responsibility, Policy Document, Report on file at Metallon Management (Private) Limited, Harare, Zimbabwe.
BMC (2023a). How Mine, Environmental Management Plan 2023, Report on file at Metallon Management (Private) Limited, Harare, Zimbabwe.
BMC (2023b). How Mine, Mineral Reserves and Mineral Resources (MRMR) Estimates, 31 December 2023, Report on file at Metallon Management (Private) Limited, Harare, Zimbabwe.
BMC (2023c). How Mine, Sands Re-Treatment Trials Report – July 2023, Report on file at Metallon Management (Private) Limited, Harare, Zimbabwe.
BMC (2021). BMC Sands Mineral Resources, December 2021, Report on file at Metallon Management (Private) Limited, Harare, Zimbabwe.
| Project No PS229049 | WSP |
| How Mine | March 2026 |
| S-K 1300 Technical Report Summary | Page 139 |
| Namib Minerals |
BMC (2020). How Mine, Mineral Resources and Mineral Reserves Estimation, 31 December 2020, Report on file at Metallon Management (Private) Limited, Harare, Zimbabwe.
BMC (2018). How Mine, Mineral Resources and Mineral Reserves Estimation, 31 December 2018, Report on file at Metallon Management (Private) Limited, Harare, Zimbabwe.
Edelrod Consulting (Edelrod) (2024). How Mine Mineral Reserves and Mineral Resources as at 31 December 2023, Independent Competent Persons’ Statement, Report on file at Metallon Management (Private) Limited, Harare, Zimbabwe, 28 pp.
Enmin Consulting (Private) Limited (2024). Mine Closure Plan 2024, Volume I – Executive Summary, June 2024. Report on file at Metallon Management (Private) Limited, Harare, Zimbabwe.
Golder Associates Pty Ltd (Golder) (2021). Competent Person’s Report for the How Gold Mine, Zimbabwe, Prepared for Metallon Corporation Limited (UK), United Kingdom.
Groundwork (2024), Determination of the State of Stress at How Mine, Groundwork Project # MET02966/HOWGMP, submitted February 2024.
Metallon (2024), Mineral Reserves and Mineral Resources (MRMR) Estimates, Report on file at Metallon Management (Private) Limited, Harare, Zimbabwe.
Meteoblue (2026), Climate Mazowe, Available at: https://www.meteoblue.com/en/weather/historyclimate/climatemodelled/mazowe_zimbabwe_886384
Middindi (2022), Addendum to Review Report, Sill Pillar Extraction, How Mine, Middindi Consulting (Pty) Ltd Ref: MDI2022-How01, submitted November 2022.
NRZ (2024a), Freight Services, Available at: https://nrz.co.zw/freight-services/
NRZ (2024b), Passenger Services, Available at: https://nrz.co.zw/passenger-services/
NRZ (2024c), Network System, Available at: https://nrz.co.zw/network-system/
Prendergast, MD (2004), The Bulawayan Supergroup: a late Archaean passive margin-related large igneous province in the Zimbabwe craton, Journal of the Geological Society, vol.161, pp. 431-445.
Reserve Bank of Zimbabwe (RBZ) (2024), The 2024 Monetary Policy Statement at a Glance, 5 April 2024 13pp.
SRK Consulting (South Africa) (Pty) Ltd (SRK) (2017), Investigation of How Mine Rib Pillar Failure, Report Prepared for Metallon Gold Zimbabwe (Private) Limited, Report Number 512843/1, Submitted May 2017. 47 pp.
SRK (2021), How Mine Rock Mechanics Review, Prepared for Metallon Gold Zimbabwe (Private Limited, SRK Ref #539349, submitted December 2021.
WSP (2024), How Mine S-K 1300 Technical Report Summary, Prepared for Metallon Gold Zimbabwe (Private) Limited, Republic of Zimbabwe, submitted August 2024.
Zimbabwe National Institute of Rock Engineering (ZINIRE) (2018), Technical Visit Feedback Report How Mine Metallon Gold Mine, Prepared for Metallon Gold Zimbabwe (Private) Limited, Republic of Zimbabwe, Submitted July 20182, 17 pp.
| Project No PS229049 | WSP |
| How Mine | March 2026 |
| S-K 1300 Technical Report Summary | Page 140 |
| Namib Minerals |
| 25 | Reliance on information provided by the Registrant |
Except for the purposes legislated under Canadian/USA securities law, any use of this report by any third party is at that party’s sole risk. The QPs have wholly relied upon the Registrant for the following:
| — | Macroeconomic trends, data and assumptions, and interest rates as at February 2026 (Sections 18 and 19).R |
| — | Marketing information and plans within the control of the Registrant (Sections 16, 18, and 19).R |
| — | Legal matters outside the expertise of the QPs, such as statutory and regulatory interpretations affecting the mine plan (Sections 3, 13, 15, and 17)R |
| — | Environmental matters outside the expertise of the QPs (Section 17). Accommodations the Registrant commits or plans to provide to local individuals or groups in connection with its mine plan (Section 17). |
| — | Accommodations the Registrant commits or plans to provide to local individuals or groups in connection with its mine plan (Section 17). |
| — | Governmental factors outside the expertise of the QPs (Section 17). |
The QPs consider it reasonable to rely upon the Registrant for the above information, based on the QPs’ past and ongoing interactions with the subject-matter experts in these areas employed or engaged by the Registrant, as well as the Registrant’s considerable experience mining at the Property. Further, the QPs have taken all appropriate steps, in their professional opinion, to ensure that the above information provided by the Registrant is accurate in all material respects and have no reason to believe that any material facts have been withheld or misstated.
| 26 | Date and Signature Page |
This report titled “How Mine S-K 1300 Technical Report Summary” with an effective date of December 31, 2025 was prepared and signed by: WSP Australia Pty Limited (WSP). WSP hereby states that it is the QP Firm responsible for the preparation of this Technical Report Summary.

Colin McVie
Technical Director Mine Advisory
Dated in Melbourne, Australia
Signature Date: 31 March 2026
| Project No PS229049 | WSP |
| How Mine | March 2026 |
| S-K 1300 Technical Report Summary | Page 141 |
| Namib Minerals |

| Project No PS229049 | WSP |
| How Mine | March 2026 |
| S-K 1300 Technical Report Summary | Page 142 |
| Namib Minerals |
This Report is provided by WSP Australia Pty Limited (WSP) for Namib Minerals (Client) in response to specific instructions from the Client and in accordance with WSP’s proposal dated November 2025 and agreement with the Client dated November 2025 (Agreement).
Permitted purpose
This Report is provided by WSP for the purpose described in the Agreement and no responsibility is accepted by WSP for the use of the Report in whole or in part, for any other purpose (Permitted Purpose).
Qualifications and assumptions
The services undertaken by WSP in preparing this Report were limited to those specifically detailed in the Report and are subject to the scope, qualifications, assumptions and limitations set out in the Report or otherwise communicated to the Client.
Except as otherwise stated in the Report and to the extent that statements, opinions, facts, conclusion and / or recommendations in the Report (Conclusions) are based in whole or in part on information provided by the Client and other parties identified in the report (Information), those Conclusions are based on assumptions by WSP of the reliability, adequacy, accuracy and completeness of the Information and have not been verified. WSP accepts no responsibility for the Information.
WSP has prepared the Report without regard to any special interest of any person other than the Client when undertaking the services described in the Agreement or in preparing the Report.
Use and reliance
This Report should be read in its entirety and must not be copied, distributed or referred to in part only. The Report must not be reproduced without the written approval of WSP. WSP will not be responsible for interpretations or conclusions drawn by the reader. This Report (or sections of the Report) should not be used as part of a specification for a project or for incorporation into any other document without the prior agreement of WSP.
WSP is not (and will not be) obliged to provide an update of this Report to include any event, circumstance, revised Information or any matter coming to WSP’s attention after the date of this Report. Data reported and Conclusions drawn are based solely on information made available to WSP at the time of preparing the Report. The passage of time; unexpected variations in ground conditions; manifestations of latent conditions; or the impact of future events (including (without limitation) changes in policy, legislation, guidelines, scientific knowledge; and changes in interpretation of policy by statutory authorities); may require further investigation or subsequent re-evaluation of the Conclusions.
This Report can only be relied upon for the Permitted Purpose and may not be relied upon for any other purpose. The Report does not purport to recommend or induce a decision to make (or not make) any purchase, disposal, investment, divestment, financial commitment or otherwise. It is the responsibility of the Client to accept (if the Client so chooses) any Conclusions contained within the Report and implement them in an appropriate, suitable and timely manner.
In the absence of express written consent of WSP, no responsibility is accepted by WSP for the use of the Report in whole or in part by any party other than the Client for any purpose whatsoever. Without the express written consent of WSP, any use which a third party makes of this Report or any reliance on (or decisions to be made) based on this Report is at the sole risk of those third parties without recourse to WSP. Third parties should make their own enquiries and obtain independent advice in relation to any matter dealt with or Conclusions expressed in the Report.
| Disclaimer |
This report contains the expressions of professional opinions of the Authors based on (i) information available at the time of preparation, (ii) data supplied by BMC [and others], and (iii) the assumptions, conditions, and qualifications set forth in this report. The quality of information, conclusions, and estimates contained herein are consistent with the stated levels of accuracy as well as the circumstances and constraints under which the mandate was performed.
| Project No PS229049 | WSP |
| How Mine | March 2026 |
| S-K 1300 Technical Report Summary | Page 143 |
| Namib Minerals |