v3.26.1
Pay vs Performance Disclosure - USD ($)
12 Months Ended
Dec. 31, 2025
Dec. 31, 2024
Dec. 31, 2023
Dec. 31, 2022
Dec. 31, 2021
Pay vs Performance Disclosure          
Pay vs Performance Disclosure, Table

Pay Versus Performance


Value of Initial Fixed $100 Investment Based on:


Company Selected Measure

Year
(a)

Summary Compensation Table Total for PEO
($)(1)
(b)

Compensation Actually Paid to PEO
($)(2)(3)
(c)

Average Summary Compensation Table Total for Non-PEO NEOs
($)(4)
(d)

Average Compensation Actually Paid to Non-PEO NEOs
($)(2)(4)(5)
(e)

Total Shareholder Return
($)
(f)

Peer Group Total Shareholder Return
($)(6)
(g)

Net Income
($)
(h)

Earnings Per Share - Basic and Diluted
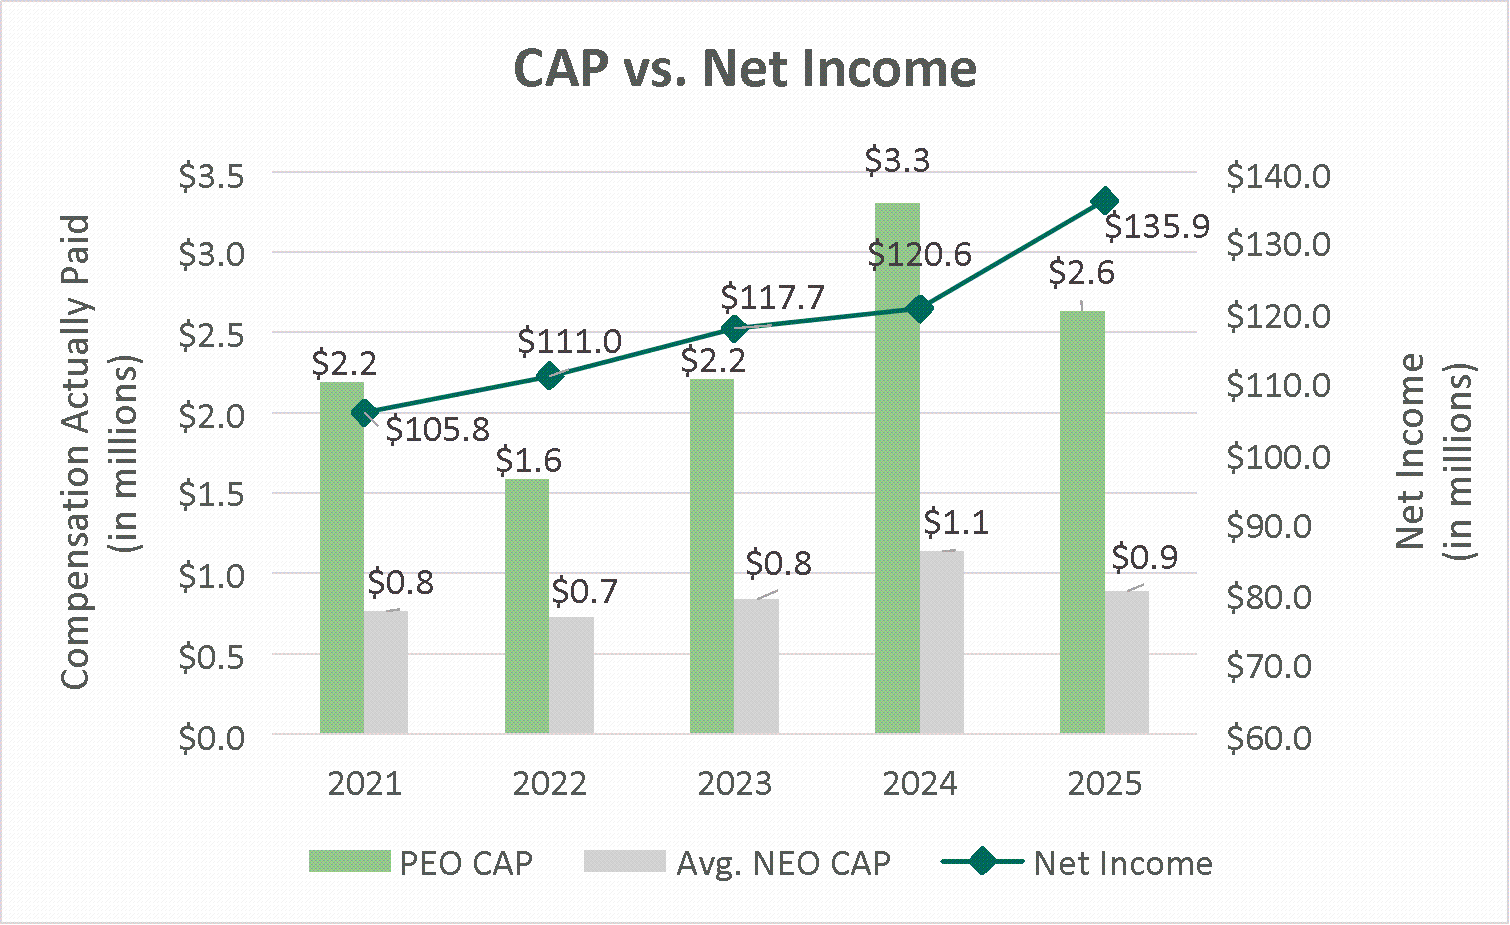
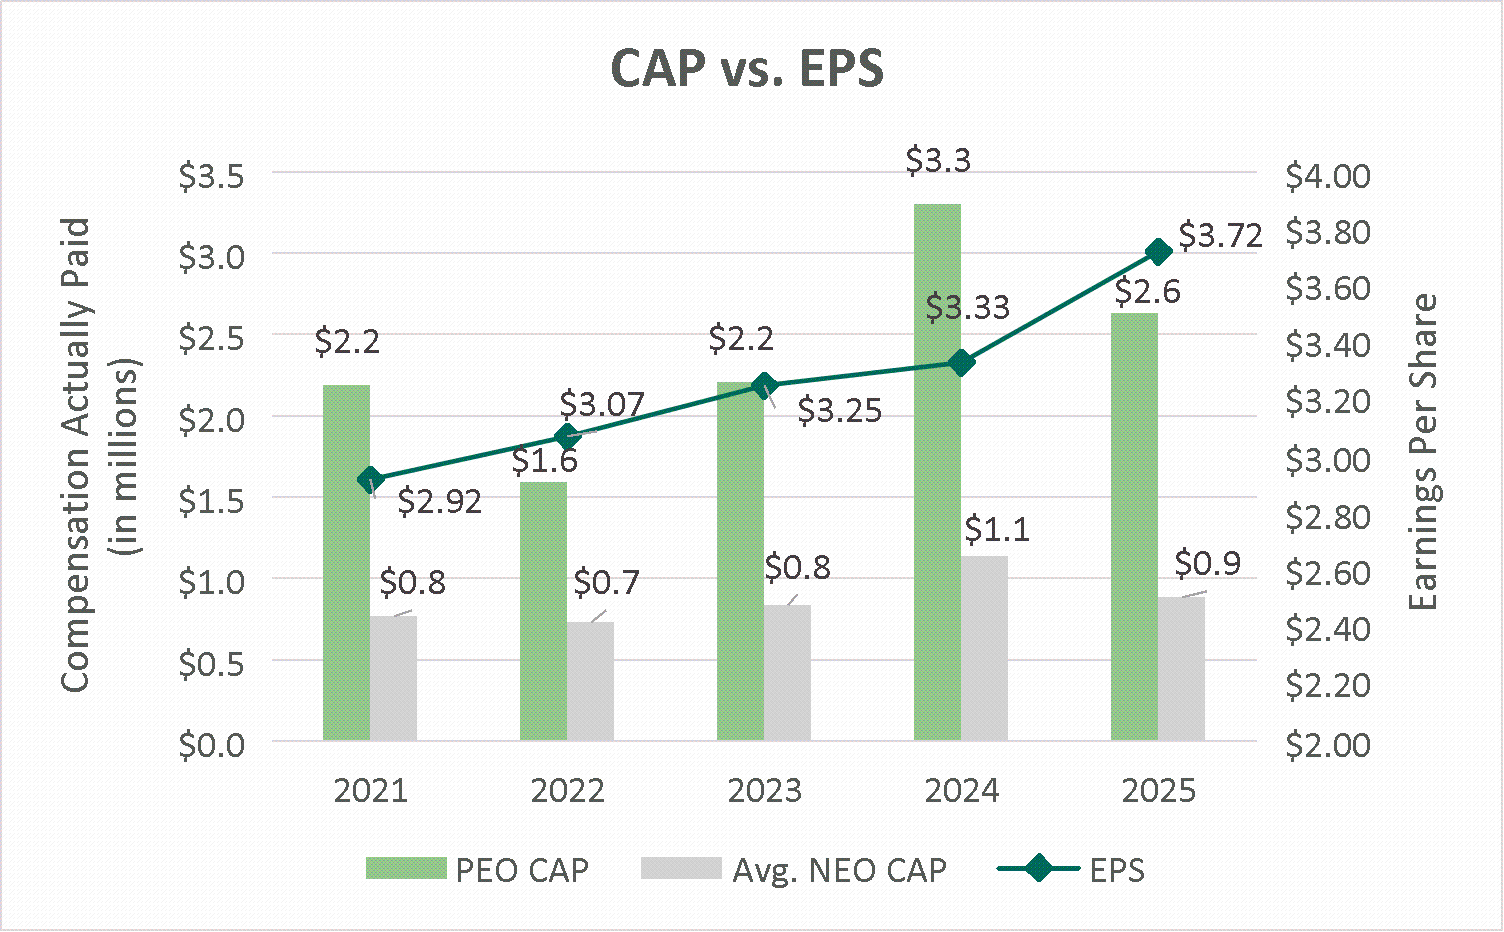
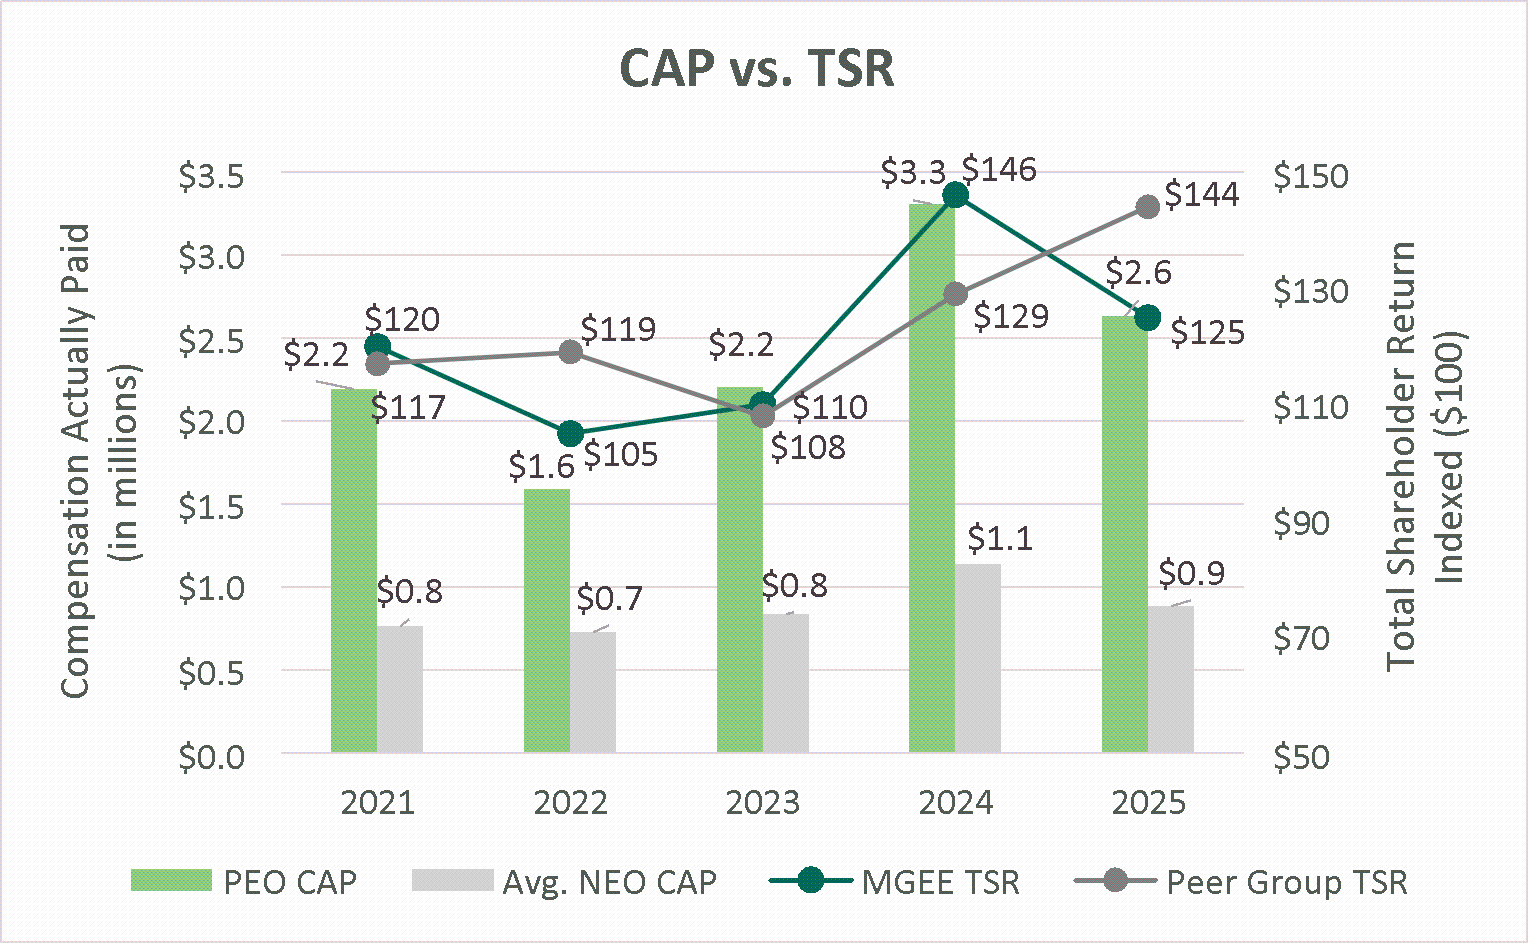
($)(7)
(i)

2025

3,613,508

2,632,179

1,105,725

888,101

125

144

135,889,000

3.72

2024

2,126,131

3,303,145

855,983

1,138,299

146

129

120,569,000

3.33

2023

2,566,797

2,206,732

895,191

838,196

110

108

117,699,000

3.25

2022

1,678,867

1,590,003

797,155

731,318

105

119

110,952,000

3.07

2021

2,628,028

2,189,827

863,501

766,775

120

117

105,761,000

2.92


(1)
Reflects amounts reported in the "Summary Compensation Table" for J. Keebler (PEO).
(2)
Compensation Actually Paid (CAP) includes adjustments in accordance with the SEC methodology to the total executive compensation reported from the summary compensation table. The adjustments include a deduction for actuarial present value of accumulated benefit of all defined benefit and actuarial pension plans reported in the summary compensation table; addition of actuarially determined service costs for services rendered by the executive during the covered fiscal period, deduction of grant date fair value of equity award amounts reported in the summary compensation table; and addition or subtraction of the change in fair value of the equity awards unvested and vested during the fiscal period. The calculation of "compensation actually paid" is prescribed by SEC rules and does not represent the compensation actually received by the named executive officers for any time period shown above.
(3)
To calculate CAP for the PEO, the following adjustments were made to the Summary Compensation Table total compensation, calculated in accordance with the SEC methodology for determining CAP for 2025:


Year

Deduction for Actuarial Pension Present Value

Addition for Service Cost for Pension

Deduction of Grant Date Fair Value of Awards Granted in FY

Addition of Fair Value of Equity Awards Granted in FY

Change in Fair Value of Prior Years’ Unvested Equity Awards

Change in Fair Value of Prior Years’ Awards Vested in FY

Total Adjustment to CAP

2025

(518,771)

153,991

(1,402,881)

1,172,049

(294,621)

(91,096)

(981,329)


(4)
For fiscal years 2021 through 2025, J. Bushek, L. Hobbie, and C.A. Renlund are included as other named executive officers. In addition, J. Lorenz is included for fiscal year 2024 and 2025; T. Johnson is included for fiscal years 2021 through 2023. D. Peterson is included for fiscal year 2021.
(5)
To calculate CAP for the average named executive officers, the following average adjustments were made to Summary Compensation Table total compensation, calculated in accordance with the SEC methodology for determining CAP for 2025:


Year

Deduction for Actuarial Pension Present Value

Addition for Service Cost for Pension

Deduction of Grant Date Fair Value of Awards Granted in FY

Addition of Fair Value of Equity Awards Granted in FY

Change in Fair Value of Prior Years’ Unvested Equity Awards

Change in Fair Value of Prior Years’ Awards Vested in FY

Total Adjustment to CAP

2025

(53,391)

(322,285)

269,256

(82,473)

(28,731)

(217,624)


(6)
Peer Group Total Shareholder Return of the Edison Electric Institute (EEI) Index companies, which is the index used for purposes of the Company’s disclosure under Item 201(e) of Regulation S-K.
(7)
The Company determined that EPS is the most important financial performance measure used to link CAP to Company performance given that it is utilized as a component of the 2025 STI and the 2025 PSU awards granted to the NEOs.
       
Named Executive Officers, Footnote
(4)
For fiscal years 2021 through 2025, J. Bushek, L. Hobbie, and C.A. Renlund are included as other named executive officers. In addition, J. Lorenz is included for fiscal year 2024 and 2025; T. Johnson is included for fiscal years 2021 through 2023. D. Peterson is included for fiscal year 2021.
       
Peer Group Issuers, Footnote Peer Group Total Shareholder Return of the Edison Electric Institute (EEI) Index companies, which is the index used for purposes of the Company’s disclosure under Item 201(e) of Regulation S-K        
PEO Total Compensation Amount [1] $ 3,613,508 $ 2,126,131 $ 2,566,797 $ 1,678,867 $ 2,628,028
PEO Actually Paid Compensation Amount [2],[3] $ 2,632,179 3,303,145 2,206,732 1,590,003 2,189,827
Adjustment To PEO Compensation, Footnote
(3)
To calculate CAP for the PEO, the following adjustments were made to the Summary Compensation Table total compensation, calculated in accordance with the SEC methodology for determining CAP for 2025:


Year

Deduction for Actuarial Pension Present Value

Addition for Service Cost for Pension

Deduction of Grant Date Fair Value of Awards Granted in FY

Addition of Fair Value of Equity Awards Granted in FY

Change in Fair Value of Prior Years’ Unvested Equity Awards

Change in Fair Value of Prior Years’ Awards Vested in FY

Total Adjustment to CAP

2025

(518,771)

153,991

(1,402,881)

1,172,049

(294,621)

(91,096)

(981,329)

       
Non-PEO NEO Average Total Compensation Amount [4] $ 1,105,725 855,983 895,191 797,155 863,501
Non-PEO NEO Average Compensation Actually Paid Amount [2],[4],[5] $ 888,101 1,138,299 838,196 731,318 766,775
Adjustment to Non-PEO NEO Compensation Footnote
(5)
To calculate CAP for the average named executive officers, the following average adjustments were made to Summary Compensation Table total compensation, calculated in accordance with the SEC methodology for determining CAP for 2025:


Year

Deduction for Actuarial Pension Present Value

Addition for Service Cost for Pension

Deduction of Grant Date Fair Value of Awards Granted in FY

Addition of Fair Value of Equity Awards Granted in FY

Change in Fair Value of Prior Years’ Unvested Equity Awards

Change in Fair Value of Prior Years’ Awards Vested in FY

Total Adjustment to CAP

2025

(53,391)

(322,285)

269,256

(82,473)

(28,731)

(217,624)

       
Compensation Actually Paid vs. Net Income

The chart below illustrates the relationship of executive compensation actually paid and Net Income.


img199400622_123.gif

       
Compensation Actually Paid vs. Company Selected Measure

The chart below illustrates the relationship of executive compensation actually paid and Earnings Per Share (EPS).


img199400622_122.gif

       
Total Shareholder Return Vs Peer Group

The chart below illustrates the relationship of executive compensation actually paid and MGE Energy Total Shareholder Return (TSR). Also included is the relationship of MGE Energy TSR and peer group TSR.


img199400622_121.gif

       
Tabular List, Table

The following table identifies the financial and non-financial most important performance measures used by our Human Resources and Compensation Committee to link compensation actually paid to our NEOs to Company performance. See further discussion in the Compensation Discussion and Analysis for description of metrics and impact to executive compensation.


Performance Measures

Earnings Per Share

Return on Equity

Relative Total Shareholder Return

Customer Satisfaction Rating

Service Reliability

       
Total Shareholder Return Amount $ 125 146 110 105 120
Peer Group Total Shareholder Return Amount [6] 144 129 108 119 117
Net Income (Loss) $ 135,889,000 $ 120,569,000 $ 117,699,000 $ 110,952,000 $ 105,761,000
Company Selected Measure Amount [7] 3.72 3.33 3.25 3.07 2.92
PEO Name J. Keebler (PEO)        
Measure:: 1          
Pay vs Performance Disclosure          
Name Earnings Per Share        
Measure:: 2          
Pay vs Performance Disclosure          
Name Return on Equity        
Measure:: 3          
Pay vs Performance Disclosure          
Name Relative Total Shareholder Return        
Measure:: 4          
Pay vs Performance Disclosure          
Name Customer Satisfaction Rating        
Measure:: 5          
Pay vs Performance Disclosure          
Name Service Reliability        
PEO          
Pay vs Performance Disclosure          
Adjustment to Compensation, Amount $ (981,329)        
PEO | Deduction for Actuarial Pension Present Value [Member]          
Pay vs Performance Disclosure          
Adjustment to Compensation, Amount (518,771)        
PEO | Addition for Service Cost for Pension [Member]          
Pay vs Performance Disclosure          
Adjustment to Compensation, Amount 153,991        
PEO | Deduction Grant Date Fair Value of Awards Granted in FY [Member]          
Pay vs Performance Disclosure          
Adjustment to Compensation, Amount (1,402,881)        
PEO | Addition of Fair Value of Equity Awards Granted in FY [Member]          
Pay vs Performance Disclosure          
Adjustment to Compensation, Amount 1,172,049        
PEO | Change in Fair Value of Prior Years Unvested Equity Awards [Member]          
Pay vs Performance Disclosure          
Adjustment to Compensation, Amount (294,621)        
PEO | Change in Fair Value of Prior Years Awards Vested in FY [Member]          
Pay vs Performance Disclosure          
Adjustment to Compensation, Amount (91,096)        
Non-PEO NEO          
Pay vs Performance Disclosure          
Adjustment to Compensation, Amount (217,624)        
Non-PEO NEO | Deduction for Actuarial Pension Present Value [Member]          
Pay vs Performance Disclosure          
Adjustment to Compensation, Amount (53,391)        
Non-PEO NEO | Addition for Service Cost for Pension [Member]          
Pay vs Performance Disclosure          
Adjustment to Compensation, Amount 0        
Non-PEO NEO | Deduction Grant Date Fair Value of Awards Granted in FY [Member]          
Pay vs Performance Disclosure          
Adjustment to Compensation, Amount (322,285)        
Non-PEO NEO | Addition of Fair Value of Equity Awards Granted in FY [Member]          
Pay vs Performance Disclosure          
Adjustment to Compensation, Amount 269,256        
Non-PEO NEO | Change in Fair Value of Prior Years Unvested Equity Awards [Member]          
Pay vs Performance Disclosure          
Adjustment to Compensation, Amount (82,473)        
Non-PEO NEO | Change in Fair Value of Prior Years Awards Vested in FY [Member]          
Pay vs Performance Disclosure          
Adjustment to Compensation, Amount $ (28,731)        
[1] Reflects amounts reported in the "Summary Compensation Table" for J. Keebler (PEO).
[2] Compensation Actually Paid (CAP) includes adjustments in accordance with the SEC methodology to the total executive compensation reported from the summary compensation table. The adjustments include a deduction for actuarial present value of accumulated benefit of all defined benefit and actuarial pension plans reported in the summary compensation table; addition of actuarially determined service costs for services rendered by the executive during the covered fiscal period, deduction of grant date fair value of equity award amounts reported in the summary compensation table; and addition or subtraction of the change in fair value of the equity awards unvested and vested during the fiscal period. The calculation of "compensation actually paid" is prescribed by SEC rules and does not represent the compensation actually received by the named executive officers for any time period shown above.
[3] To calculate CAP for the PEO, the following adjustments were made to the Summary Compensation Table total compensation, calculated in accordance with the SEC methodology for determining CAP for 2025:


Year

Deduction for Actuarial Pension Present Value

Addition for Service Cost for Pension

Deduction of Grant Date Fair Value of Awards Granted in FY

Addition of Fair Value of Equity Awards Granted in FY

Change in Fair Value of Prior Years’ Unvested Equity Awards

Change in Fair Value of Prior Years’ Awards Vested in FY

Total Adjustment to CAP

2025

(518,771)

153,991

(1,402,881)

1,172,049

(294,621)

(91,096)

(981,329)


[4] For fiscal years 2021 through 2025, J. Bushek, L. Hobbie, and C.A. Renlund are included as other named executive officers. In addition, J. Lorenz is included for fiscal year 2024 and 2025; T. Johnson is included for fiscal years 2021 through 2023. D. Peterson is included for fiscal year 2021.
[5] To calculate CAP for the average named executive officers, the following average adjustments were made to Summary Compensation Table total compensation, calculated in accordance with the SEC methodology for determining CAP for 2025:


Year

Deduction for Actuarial Pension Present Value

Addition for Service Cost for Pension

Deduction of Grant Date Fair Value of Awards Granted in FY

Addition of Fair Value of Equity Awards Granted in FY

Change in Fair Value of Prior Years’ Unvested Equity Awards

Change in Fair Value of Prior Years’ Awards Vested in FY

Total Adjustment to CAP

2025

(53,391)

(322,285)

269,256

(82,473)

(28,731)

(217,624)

[6] Peer Group Total Shareholder Return of the Edison Electric Institute (EEI) Index companies, which is the index used for purposes of the Company’s disclosure under Item 201(e) of Regulation S-K.
[7] The Company determined that EPS is the most important financial performance measure used to link CAP to Company performance given that it is utilized as a component of the 2025 STI and the 2025 PSU awards granted to the NEOs.