Pay Versus Performance
Pay Versus Performance Table
In accordance with rules adopted by the Securities and Exchange Commission as required by Section 953(a) of the Dodd-Frank Wall Street Reform and Consumer Protection Act and Item 402(v) of Regulation S-K, we provide the following disclosure regarding executive compensation for our principal executive officer (“PEO”) and Non-PEO named executive officers (“NEOs”) and Company performance for the fiscal years listed below. The Compensation Committee did not consider the pay versus performance disclosure below in making its pay decisions for any of the years shown.
Year |
|
Summary Compensation Table Total for PEO |
|
|
Compensation Actually Paid to PEO |
|
|
Average Summary Compensation Table Total for Non-PEO NEOs |
|
|
Average Compensation Actually Paid to Non-PEO NEOs |
|
|
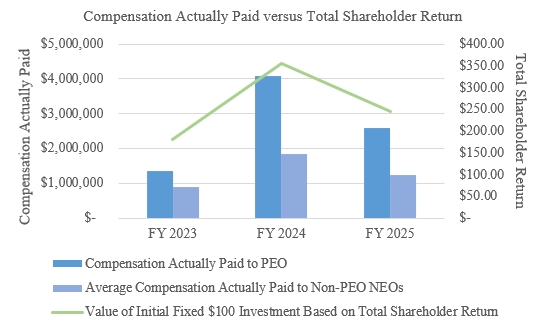
Value of Initial Fixed $100 Investment Based on Total Shareholder Return |
|
|
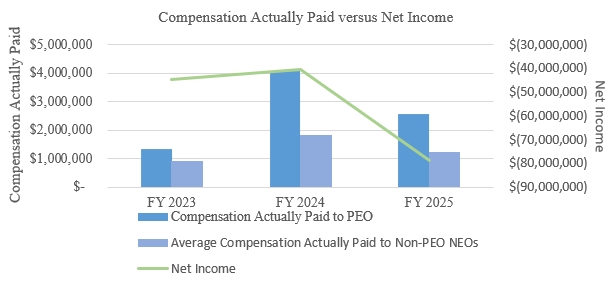
Net Loss (in thousands) |
|
||||||
2025 |
|
$ |
3,750,125 |
|
|
$ |
2,589,305 |
|
|
$ |
1,794,782 |
|
|
$ |
1,231,438 |
|
|
$ |
244.44 |
|
|
$ |
(78,537 |
) |
2024 |
|
$ |
4,245,438 |
|
|
$ |
4,068,073 |
|
|
$ |
2,661,239 |
|
|
$ |
1,833,326 |
|
|
$ |
354.35 |
|
|
$ |
(40,209 |
) |
2023 |
|
$ |
1,137,622 |
|
|
$ |
1,355,540 |
|
|
$ |
778,561 |
|
|
$ |
887,228 |
|
|
$ |
181.38 |
|
|
$ |
(44,604 |
) |
(1) |
The dollar amounts reported are the amounts of total compensation reported for Dr. Cohen (our Chief Executive Officer / PEO) for each corresponding year in the “Total” column of the Summary Compensation Table. Refer to “Executive Compensation-Summary Compensation Table.” |
|
|
(2) |
The dollar amounts reported represent the average of the amounts reported for our company’s Non-PEO NEOs as a group (excluding Dr. Cohen) in the “Total” column of the Summary Compensation Table in each applicable year. The names of each of the named executive officers (excluding Dr. Cohen) included for purposes of calculating the average amounts in each applicable year are Dr. Smethurst and Mr. Moran. |
|
|
(3) |
The dollar amounts reported represent the amount of “compensation actually paid” to our PEO and Non-PEO NEOs as computed in accordance with Item 402(v) of Regulation S-K. The dollar amounts do not reflect the actual amount of compensation earned by or paid during the applicable year. In accordance with the requirements of Item 402(v) of Regulation S-K, the following adjustments were made to total compensation for each year to determine the compensation actually paid: |
|
|
2025 |
|
|
2024 |
|
|
2023 |
|
|||||||||||||||
|
|
PEO |
|
|
Average Non-PEO NEOs |
|
|
PEO |
|
|
Average Non-PEO NEOs |
|
|
PEO |
|
|
Average Non-PEO NEOs |
|
||||||
Summary Compensation Table Totals |
|
$ |
3,750,125 |
|
|
$ |
1,794,782 |
|
|
$ |
4,245,438 |
|
|
$ |
2,661,239 |
|
|
$ |
1,137,622 |
|
|
$ |
778,561 |
|
Add (Subtract): |
|
|
|
|
|
|
|
|
|
|
|
|
|
|
|
|
|
|
||||||
Fair value of equity awards granted during the year from the Summary Compensation Table |
|
|
(2,705,993 |
) |
|
|
(1,086,416 |
) |
|
|
(3,219,652 |
) |
|
|
(2,109,207 |
) |
|
|
(229,842 |
) |
|
|
(134,855 |
) |
Fair value at year end of equity awards granted during the year |
|
|
2,222,273 |
|
|
|
892,210 |
|
|
|
1,627,344 |
|
|
|
989,895 |
|
|
|
353,176 |
|
|
|
207,220 |
|
Change in fair value of equity awards granted in prior years that were unvested as of the end of the year |
|
|
(452,132 |
) |
|
|
(243,938 |
) |
|
|
17,082 |
|
|
|
6,356 |
|
|
|
19,077 |
|
|
|
9,752 |
|
Change in fair value of equity awards granted in prior years that vested during the year |
|
|
(224,968 |
) |
|
|
(125,200 |
) |
|
|
1,397,861 |
|
|
|
285,043 |
|
|
|
75,507 |
|
|
|
26,550 |
|
Equity awards granted in prior years that were forfeited during the year |
|
|
- |
|
|
|
- |
|
|
|
- |
|
|
|
- |
|
|
|
- |
|
|
|
- |
|
Compensation Actually Paid Totals |
|
$ |
2,589,305 |
|
|
$ |
1,231,438 |
|
|
$ |
4,068,073 |
|
|
$ |
1,833,326 |
|
|
$ |
1,355,540 |
|
|
$ |
887,228 |
|
(4) |
Cumulative TSR is calculated by dividing the sum of the cumulative amount of dividends for the measurement period, assuming dividend reinvestment, and the difference between our company’s share price at the end and the beginning of the measurement period by our company’s share price at the beginning of the measurement period. No dividends were paid on stock or option awards in 2025, 2024 or 2023. |
|
|
(5) |
The dollar amounts reported represent the amount of net loss reflected in our consolidated audited financial statements for the applicable year. |
(1) |
The dollar amounts reported are the amounts of total compensation reported for Dr. Cohen (our Chief Executive Officer / PEO) for each corresponding year in the “Total” column of the Summary Compensation Table. Refer to “Executive Compensation-Summary Compensation Table.” |
|
|
(2) |
The dollar amounts reported represent the average of the amounts reported for our company’s Non-PEO NEOs as a group (excluding Dr. Cohen) in the “Total” column of the Summary Compensation Table in each applicable year. The names of each of the named executive officers (excluding Dr. Cohen) included for purposes of calculating the average amounts in each applicable year are Dr. Smethurst and Mr. Moran. |
|
|
(3) |
The dollar amounts reported represent the amount of “compensation actually paid” to our PEO and Non-PEO NEOs as computed in accordance with Item 402(v) of Regulation S-K. The dollar amounts do not reflect the actual amount of compensation earned by or paid during the applicable year. In accordance with the requirements of Item 402(v) of Regulation S-K, the following adjustments were made to total compensation for each year to determine the compensation actually paid: |
|
|
2025 |
|
|
2024 |
|
|
2023 |
|
|||||||||||||||
|
|
PEO |
|
|
Average Non-PEO NEOs |
|
|
PEO |
|
|
Average Non-PEO NEOs |
|
|
PEO |
|
|
Average Non-PEO NEOs |
|
||||||
Summary Compensation Table Totals |
|
$ |
3,750,125 |
|
|
$ |
1,794,782 |
|
|
$ |
4,245,438 |
|
|
$ |
2,661,239 |
|
|
$ |
1,137,622 |
|
|
$ |
778,561 |
|
Add (Subtract): |
|
|
|
|
|
|
|
|
|
|
|
|
|
|
|
|
|
|
||||||
Fair value of equity awards granted during the year from the Summary Compensation Table |
|
|
(2,705,993 |
) |
|
|
(1,086,416 |
) |
|
|
(3,219,652 |
) |
|
|
(2,109,207 |
) |
|
|
(229,842 |
) |
|
|
(134,855 |
) |
Fair value at year end of equity awards granted during the year |
|
|
2,222,273 |
|
|
|
892,210 |
|
|
|
1,627,344 |
|
|
|
989,895 |
|
|
|
353,176 |
|
|
|
207,220 |
|
Change in fair value of equity awards granted in prior years that were unvested as of the end of the year |
|
|
(452,132 |
) |
|
|
(243,938 |
) |
|
|
17,082 |
|
|
|
6,356 |
|
|
|
19,077 |
|
|
|
9,752 |
|
Change in fair value of equity awards granted in prior years that vested during the year |
|
|
(224,968 |
) |
|
|
(125,200 |
) |
|
|
1,397,861 |
|
|
|
285,043 |
|
|
|
75,507 |
|
|
|
26,550 |
|
Equity awards granted in prior years that were forfeited during the year |
|
|
- |
|
|
|
- |
|
|
|
- |
|
|
|
- |
|
|
|
- |
|
|
|
- |
|
Compensation Actually Paid Totals |
|
$ |
2,589,305 |
|
|
$ |
1,231,438 |
|
|
$ |
4,068,073 |
|
|
$ |
1,833,326 |
|
|
$ |
1,355,540 |
|
|
$ |
887,228 |
|
|
|
2025 |
|
|
2024 |
|
|
2023 |
|
|||||||||||||||
|
|
PEO |
|
|
Average Non-PEO NEOs |
|
|
PEO |
|
|
Average Non-PEO NEOs |
|
|
PEO |
|
|
Average Non-PEO NEOs |
|
||||||
Summary Compensation Table Totals |
|
$ |
3,750,125 |
|
|
$ |
1,794,782 |
|
|
$ |
4,245,438 |
|
|
$ |
2,661,239 |
|
|
$ |
1,137,622 |
|
|
$ |
778,561 |
|
Add (Subtract): |
|
|
|
|
|
|
|
|
|
|
|
|
|
|
|
|
|
|
||||||
Fair value of equity awards granted during the year from the Summary Compensation Table |
|
|
(2,705,993 |
) |
|
|
(1,086,416 |
) |
|
|
(3,219,652 |
) |
|
|
(2,109,207 |
) |
|
|
(229,842 |
) |
|
|
(134,855 |
) |
Fair value at year end of equity awards granted during the year |
|
|
2,222,273 |
|
|
|
892,210 |
|
|
|
1,627,344 |
|
|
|
989,895 |
|
|
|
353,176 |
|
|
|
207,220 |
|
Change in fair value of equity awards granted in prior years that were unvested as of the end of the year |
|
|
(452,132 |
) |
|
|
(243,938 |
) |
|
|
17,082 |
|
|
|
6,356 |
|
|
|
19,077 |
|
|
|
9,752 |
|
Change in fair value of equity awards granted in prior years that vested during the year |
|
|
(224,968 |
) |
|
|
(125,200 |
) |
|
|
1,397,861 |
|
|
|
285,043 |
|
|
|
75,507 |
|
|
|
26,550 |
|
Equity awards granted in prior years that were forfeited during the year |
|
|
- |
|
|
|
- |
|
|
|
- |
|
|
|
- |
|
|
|
- |
|
|
|
- |
|
Compensation Actually Paid Totals |
|
$ |
2,589,305 |
|
|
$ |
1,231,438 |
|
|
$ |
4,068,073 |
|
|
$ |
1,833,326 |
|
|
$ |
1,355,540 |
|
|
$ |
887,228 |
|
A portion of our NEOs’ compensation consists of equity awards. As a result, the change between the values disclosed in our Summary Compensation Table and Compensation Actually Paid tends to be directionally aligned with changes in our TSR.