Pay vs Performance Disclosure - USD ($)
Dec. 31, 2025
Dec. 31, 2024
Dec. 31, 2023
Dec. 31, 2022
Dec. 31, 2021
Pay-Versus-Performance
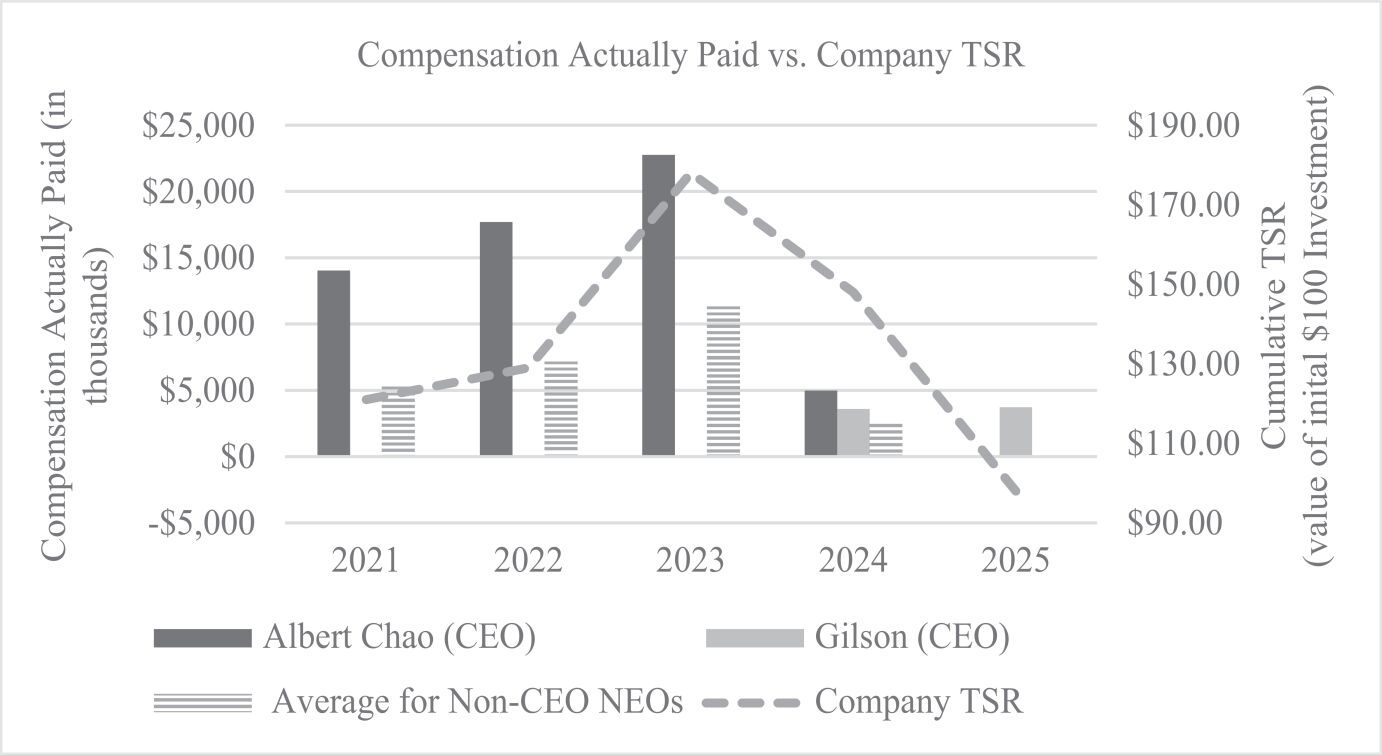
Compensation Table Summary Compensation Table Total for Albert Chao (CEO)($) |
Summary Compensation Table Total for Gilson (CEO)($) |
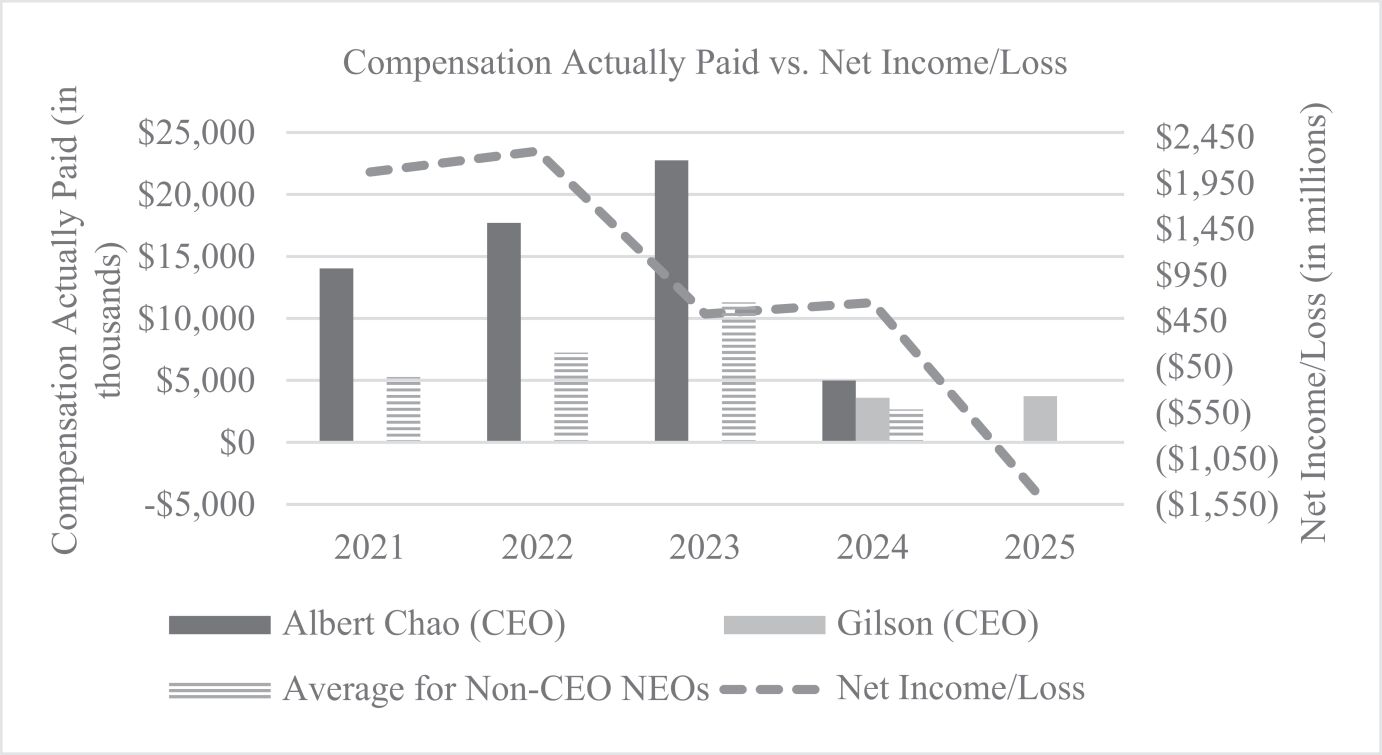
Compensation Actually Paid to Albert Chao (CEO)($) |
Compensation Actually Paid to Gilson (CEO)($) (3) |
Avg. Summary Compensation Table Total for Non-CEO NEOs($) |
Avg. Compensation Actually Paid to Non-CEO NEOs($) (4) |
Value of Initial Fixed $100 Investment Based On: |
Net Income/ Loss (in millions) ($) (6) |
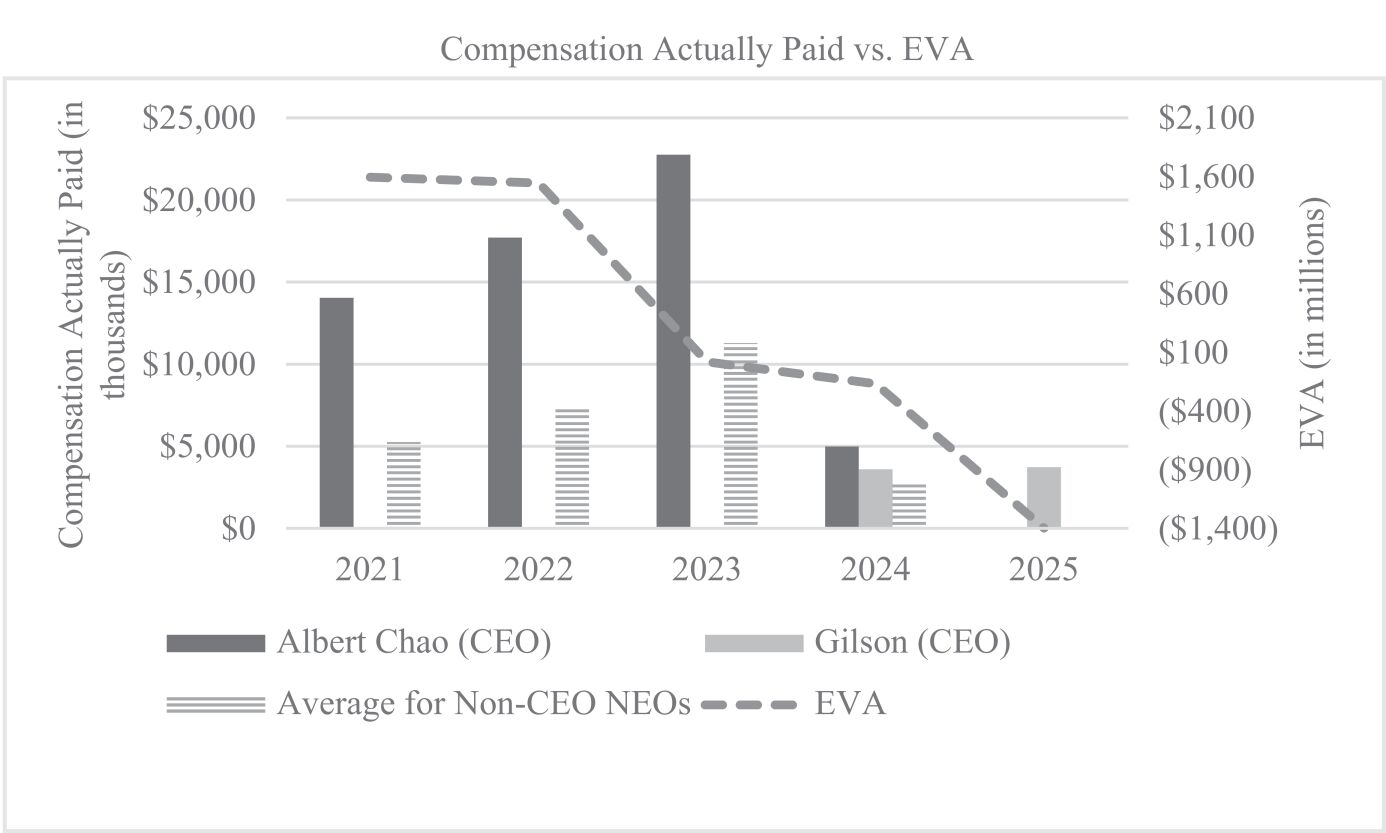
Economic Value Added (EVA) (in millions) ($) (7) |
||||||||||||||||||||||||||||||||
Year (1) |
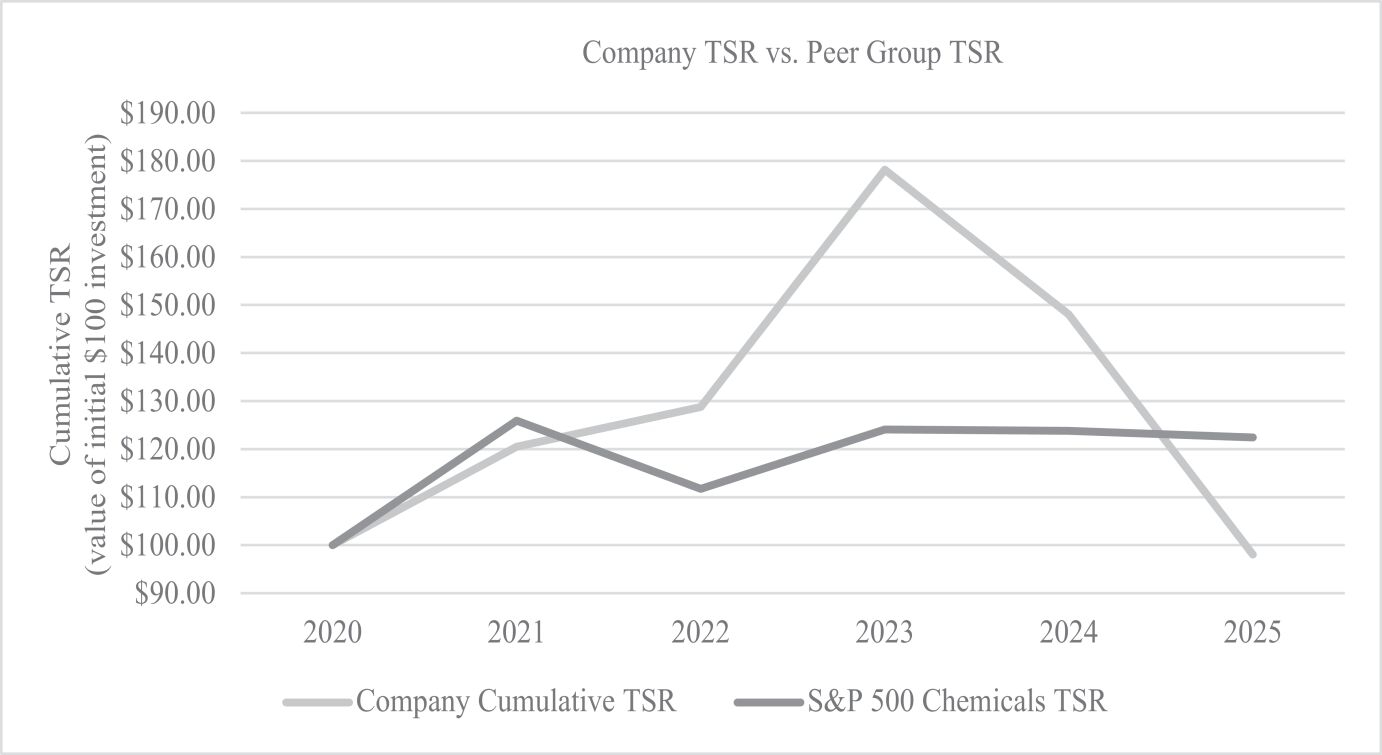
Total Shareholder Return($) |
Peer Group Total Shareholder Return($) (5) |
||||||||||||||||||||||||||||||||||||||
2025 |
— | 6,423,651 | — | 3,727,754 | 5,172,918 | 17,948 | 98.05 | 122.44 | (1,471 | ) | (1,398 | ) | ||||||||||||||||||||||||||||
2024 |
10,923,881 | 4,259,975 | (2) |
4,981,732 | 3,600,950 | 4,631,593 | 2,632,294 | 148.06 | 123.81 | 647 | (168 | ) | ||||||||||||||||||||||||||||
2023 |
11,971,486 | — | 22,752,624 | — | 6,043,960 | 11,301,095 | 178.15 | 124.07 | 522 | 18 | ||||||||||||||||||||||||||||||
2022 |
12,242,340 | — | 17,700,713 | — | 5,431,437 | 7,237,933 | 128.74 | 111.73 | 2,297 | 1,545 | ||||||||||||||||||||||||||||||
2021 |
10,401,407 | — | 14,034,003 | — | 4,029,808 | 5,271,240 | 120.51 | 125.91 | 2,070 | 1,594 | ||||||||||||||||||||||||||||||
| (1) | For each respective year, our CEOs and Non-CEO NEOs included in the table above reflect the following individuals: |
Year |
CEO |
Non-CEO NEOs | ||
| 2025 | Jean-Marc Gilson |
Albert Chao, James Chao, M. Steven Bender and Robert F. Buesinger | ||
| 2024 | Albert Chao and Jean-Marc Gilson |
James Chao, M. Steven Bender, L. Benjamin Ederington and Robert F. Buesinger | ||
| 2023 | Albert Chao |
James Chao, M. Steven Bender, L. Benjamin Ederington and Robert F. Buesinger | ||
| 2022 | Albert Chao |
James Chao, M. Steven Bender, L. Benjamin Ederington and Roger L. Kearns | ||
| 2021 | Albert Chao |
James Chao, M. Steven Bender, Robert F. Buesinger and Roger L. Kearns |
| (2) | This amount has been revised to align with the amount reported in the Summary Compensation Table. |
| (3) | The table below details the adjustments made to the Summary Compensation Table totals for the CEO, Mr. Gilson, to arrive at the “compensation actually paid to the CEO” for 2025. Stock option fair values are calculated at each measurement date using a Black-Scholes valuation model, consistent with the approach used to value the awards at the grant date. Stock option fair values as of each measurement date were determined using updated assumptions (the closing stock price of our Common Stock as of the measurement date (ranging from $74.36 to $116.76 for the measurement dates used to calculate compensation actually paid for 2025), risk-free interest rate (ranging from 3.60% to 4.32% for the measurement dates used to calculate compensation actually paid for 2025), expected life (ranging from 1.88 to 5.36 years for the measurement dates used to calculate compensation actually paid for 2025), expected volatility of the price of our Common Stock (ranging from 31.6% to 37.4% for the measurement dates used to calculate compensation actually paid for 2025), and expected dividend yield (ranging from 1.8% to 2.8% for the measurement dates used to calculate compensation actually paid for 2025). Restricted stock unit fair values are calculated at each measurement date based on the closing stock price of our Common Stock as of the measurement date (ranging from $6.12 to $29.86 for the measurement dates used to calculate compensation actually paid for 2025). Performance stock unit fair values are calculated using a Monte Carlo simulation model, consistent with the approach used to value the awards at the grant date. Performance stock unit fair values as of each measurement date were determined using updated assumptions (risk-free interest rate (ranging from 3.47% to 3.48% for the measurement dates used to calculate compensation actually paid for 2025), volatility of the price of our Common Stock (35% for the measurement dates used to calculate compensation actually paid for 2025), the closing price of our Common Stock on the measurement date ($73.94 for the measurement dates used to calculate compensation actually paid for 2025), volatilities of the prices of the stocks of the peer group companies, and the correlations of returns of our Common Stock and the stocks of the peer group companies to simulate total shareholder returns and their resulting impact on the payout percentages). |
Adjustments to Determine Compensation Actually Paid for Gilson (CEO) |
2025($) |
|||
Deduction for amounts reported under the “Stock Awards” column in the Summary Compensation Table |
(3,000,205 | ) | ||
Deduction for amounts reported under the “Option Awards” column in the Summary Compensation Table |
(963,799 | ) | ||
Increase for fair value of awards granted during year that remain unvested as of year-end |
2,098,632 | |||
Increase for fair value of awards granted during year that vested during year |
— | |||
Increase/deduction for change in fair value from prior year-end to current year-end of awards granted prior to year that were outstanding and unvested as of year-end |
(830,525 | ) | ||
Increase/deduction for change in fair value from prior year-end to vesting date of awards granted prior to year that vested during year |
— | |||
Deduction of fair value of awards granted prior to year that were forfeited during year |
— | |||
Increase based on dividends or other earnings paid during year prior to vesting date of award |
— | |||
Total Adjustments |
(2,695,897 | ) | ||
| (4) | The average Summary Compensation Table totals for Non-CEO NEOs are adjusted to arrive at the average compensation actually paid to the Non-CEO NEOs each year using the same methodology as described for the CEOs and as indicated in the table below for 2025. Stock option fair values, restricted stock unit fair values, and performance stock unit fair values are calculated using the same methodology as described for the CEOs. |
Adjustments to Determine Average Compensation Actually Paid for Non-CEO NEOs |
2025($) |
|||
Deduction for amounts reported under the “Stock Awards” column in the Summary Compensation Table |
(2,397,806 | ) | ||
Deduction for amounts reported under the “Option Awards” column in the Summary Compensation Table |
(974,755 | ) | ||
Increase for fair value of awards granted during year that remain unvested as of year-end |
1,677,864 | |||
Increase for fair value of awards granted during year that vest during year |
— | |||
Increase/deduction for change in fair value from prior year-end to current year-end of awards granted prior to year that were outstanding and unvested as of year-end |
(3,520,024 | ) | ||
Increase/deduction for change in fair value from prior year-end to vesting date of awards granted prior to year that vested during year |
59,751 | |||
Deduction of fair value of awards granted prior to year that were forfeited during year |
— | |||
Increase based on dividends or other earnings paid during year prior to vesting date of award |
— | |||
Total Adjustments |
(5,154,970 | ) | ||
| (5) | Peer group is the S&P 500 Chemicals Industry GICS Level 3 Index (“S&P 500 Chemicals”) |
| (6) | Amounts shown reflect consolidated net income, including net income attributable to noncontrolling interests, as reported in the Company’s audited financial statements for the applicable fiscal year. |
| (7) | EVA generated by the Company was determined by subtracting from the Company’s net operating profit after taxes (“NOPAT”) a charge of 8.75% of the capital employed to generate the profit. The 8.75% capital charge represents the Company’s estimate of its weighted average cost of debt and equity capital. EVA is solely a measure used by the Company under its compensation programs. It is not the same as the corresponding accounting measures calculated in accordance with U.S. GAAP for financial reporting purposes and is not intended to reflect the Company’s performance for any purpose other than determination of bonuses awarded under the AIP, the QIP and the amount of performance stock units earned. NOPAT is adjusted to account for any amortization of intangibles, acquisition-related integration and transaction costs, adjustments associated with acquisitions, impairment and restructuring costs (together, “non-operating impacts”) amortized over a period commensurate with the period which the Company realizes benefits, and noncontrolling interests. Capital employed represents the Company’s total assets minus cash, restricted cash, current liabilities (but excluding the current portion of long-term debt) and pensions and other post-retirement benefits. Capital employed is adjusted to remove the impact of significant capital projects, non-controlling interests, the difference between an acquired company’s opening balance sheet and the purchase price for such acquired company, any impact based on the Company’s actual taxes paid as compared to the long-term expected cash tax rate used for NOPAT and adding back historical adjustments to NOPAT based on non-operating impacts. |
| (1) | For each respective year, our CEOs and Non-CEO NEOs included in the table above reflect the following individuals: |
Year |
CEO |
Non-CEO NEOs | ||
| 2025 | Jean-Marc Gilson |
Albert Chao, James Chao, M. Steven Bender and Robert F. Buesinger | ||
| 2024 | Albert Chao and Jean-Marc Gilson |
James Chao, M. Steven Bender, L. Benjamin Ederington and Robert F. Buesinger | ||
| 2023 | Albert Chao |
James Chao, M. Steven Bender, L. Benjamin Ederington and Robert F. Buesinger | ||
| 2022 | Albert Chao |
James Chao, M. Steven Bender, L. Benjamin Ederington and Roger L. Kearns | ||
| 2021 | Albert Chao |
James Chao, M. Steven Bender, Robert F. Buesinger and Roger L. Kearns |
Adjustments to Determine Compensation Actually Paid for Gilson (CEO) |
2025($) |
|||
Deduction for amounts reported under the “Stock Awards” column in the Summary Compensation Table |
(3,000,205 | ) | ||
Deduction for amounts reported under the “Option Awards” column in the Summary Compensation Table |
(963,799 | ) | ||
Increase for fair value of awards granted during year that remain unvested as of year-end |
2,098,632 | |||
Increase for fair value of awards granted during year that vested during year |
— | |||
Increase/deduction for change in fair value from prior year-end to current year-end of awards granted prior to year that were outstanding and unvested as of year-end |
(830,525 | ) | ||
Increase/deduction for change in fair value from prior year-end to vesting date of awards granted prior to year that vested during year |
— | |||
Deduction of fair value of awards granted prior to year that were forfeited during year |
— | |||
Increase based on dividends or other earnings paid during year prior to vesting date of award |
— | |||
Total Adjustments |
(2,695,897 | ) | ||
Adjustments to Determine Average Compensation Actually Paid for Non-CEO NEOs |
2025($) |
|||
Deduction for amounts reported under the “Stock Awards” column in the Summary Compensation Table |
(2,397,806 | ) | ||
Deduction for amounts reported under the “Option Awards” column in the Summary Compensation Table |
(974,755 | ) | ||
Increase for fair value of awards granted during year that remain unvested as of year-end |
1,677,864 | |||
Increase for fair value of awards granted during year that vest during year |
— | |||
Increase/deduction for change in fair value from prior year-end to current year-end of awards granted prior to year that were outstanding and unvested as of year-end |
(3,520,024 | ) | ||
Increase/deduction for change in fair value from prior year-end to vesting date of awards granted prior to year that vested during year |
59,751 | |||
Deduction of fair value of awards granted prior to year that were forfeited during year |
— | |||
Increase based on dividends or other earnings paid during year prior to vesting date of award |
— | |||
Total Adjustments |
(5,154,970 | ) | ||
2025 Key Performance Measures
The table below contains an unranked list of the most important financial performance measures used by the Company to link executive compensation actually paid to the Company’s fiscal year 2025 performance.
Key Performance Measures
Economic Value Added (“EVA”)
Total Shareholder Return (“TSR”)
EVA Rate of Return
Relative TSR