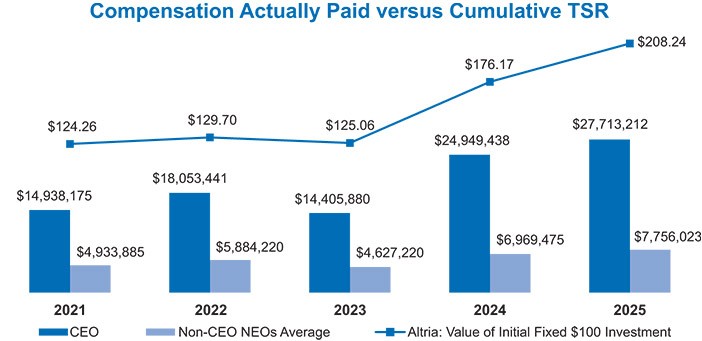
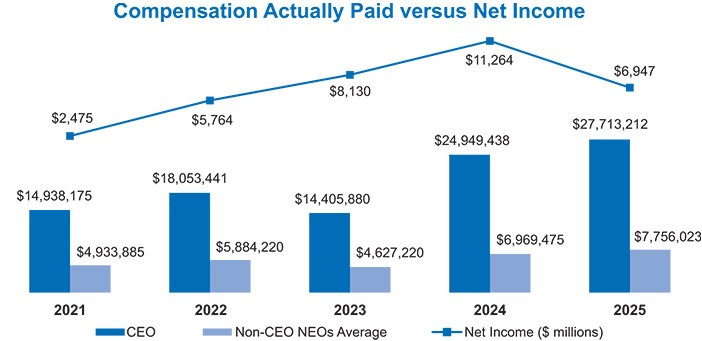
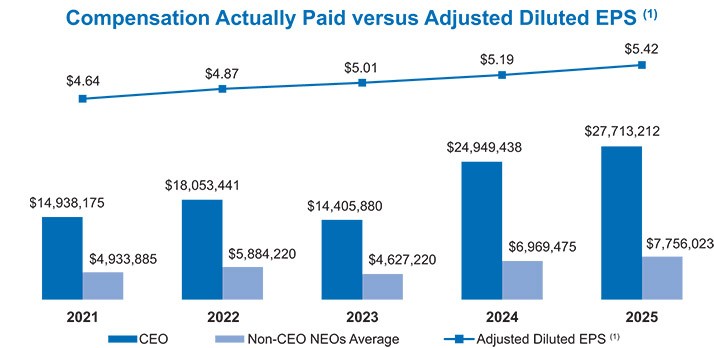
Set forth below is information about the relationship between “compensation actually paid” to our NEOs and certain financial performance measures. For further information concerning our pay-for-performance philosophy and how we align executive compensation with our performance, refer to “Compensation Discussion and Analysis” beginning on page 38.
| | | | | Value of Initial Fixed $100 | | | |||||||||
Investment Based on: | ||||||||||||||||
Average | | |||||||||||||||
Summary | Average | |||||||||||||||
Summary | Compensation | Compensation | Altria | Peer Group | ||||||||||||
Compensation | Compensation | Table Total | Actually Paid | Total | Total | Adjusted | ||||||||||
Table Total | Actually Paid | for Non-CEO | to Non-CEO | Shareholder | Shareholder | Net | Diluted | |||||||||
for CEO | to CEO (1) | NEOs (2) | NEOs (2) | Return | Return (3) | Income (4) | EPS (5) | |||||||||
Year | ($) | ($) | ($) | ($) | ($) | ($) | ($ in millions) | ($) | ||||||||
2025 |
| 24,561,180 |
| 27,713,212 |
| 7,651,544 |
| 7,756,023 |
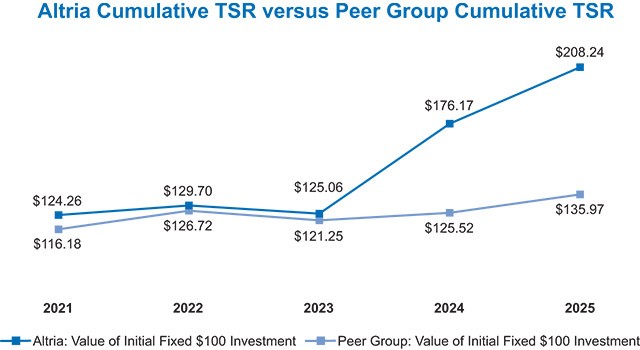
| 208.24 |
| 135.97 |
| 6,947 |
| 5.42 |
2024 | 26,788,612 |
| 24,949,438 |
| 5,414,614 | (6) | 6,969,475 | (6) | 176.17 |
| 125.52 |
| 11,264 |
| 5.19 | |
2023 |
| 18,528,628 |
| 14,405,880 |
| 5,705,089 |
| 4,627,220 |
| 125.06 |
| 121.25 |
| 8,130 |
| 5.01 |
2022 | 16,199,700 |
| 18,053,441 |
| 5,304,553 |
| 5,884,220 |
| 129.70 |
| 126.72 |
| 5,764 |
| 4.87 | |
2021 |
| 12,626,972 |
| 14,938,175 |
| 3,917,487 |
| 4,933,885 |
| 124.26 |
| 116.18 |
| 2,475 |
| 4.64 |
(1) | The dollar amounts represent the amount of compensation actually paid to each NEO, as computed in accordance with applicable SEC rules. The dollar amounts do not reflect the actual amount of compensation earned by or paid to each NEO during the applicable year. For 2025, the following adjustments were made to the amounts shown in the “Total” column of the Summary Compensation Table (“SCT”) to calculate the compensation actually paid amounts: |
| Deductions from SCT Total | | Additions to SCT Total (a) | |||||||||||||
| | Change in | | | Prior-Year | | | |||||||||
Value | Fair Value for | Fair Value | ||||||||||||||
for Outstanding | Outstanding | Change in | for Forfeited | |||||||||||||
Grant Date Fair | Change in | Awards | Awards | Fair Value | Awards | Dividend | Pension | |||||||||
Value of Equity | Pension | Granted This | Granted in | for Vested | Granted in any | Equivalents | Service | |||||||||
Awards (b) | Value (c) | Year (d) | Prior Years (e) | Awards (f) | Prior Year (g) | Paid (h) | Costs (i) | |||||||||
Year | ($) | ($) | ($) | ($) | ($) | ($) | ($) | ($) | ||||||||
CEO Adjustments |
| 9,350,079 | 4,935,823 | 9,885,536 | 2,953,365 | 1,163,944 | — | 1,102,047 | 2,333,042 | |||||||
Average Non-CEO NEOs Adjustments |
| 2,453,822 | 2,228,526 | 2,546,397 | 743,531 | 522,061 | — | 355,492 | 619,345 | |||||||
(a) | Fair values shown apply updated assumptions from the grant date assumptions described in Note 11 “Stock Plans” to our consolidated financial statements included in our 2025 Form 10-K. Fair values for PSUs take into account the probable outcome of the performance conditions as of the last day of 2025 or, if earlier, the vesting date. Fair values for RSUs use the price of Altria common stock as of the last day of 2025 or, if earlier, the vesting date. |
(b) | Each amount shown is the aggregate grant date fair value of stock awards determined pursuant to FASB Codification Topic 718. |
(c) | The amounts show the change in the present value of each NEO’s pension benefits for 2025 from December 31, 2024 to December 31, 2025. |
(d) | Reflects the fair value as of December 31 for outstanding and unvested grants awarded during 2025. |
(e) | For awards granted before 2025, reflects the change in fair value between the end of 2024 and 2025 for outstanding and unvested awards. |
(f) | For awards that vested, reflects the change in fair value between the end of 2024 and the vest date. |
(g) | Reflects the fair value as of the end of 2024 for awards forfeited during the year. |
(h) | Reflects the sum of all dividend equivalents on unvested RSUs that were paid during the year. |
(i) | Reflects the actuarial present value of benefits attributed by the pension benefit formula to services rendered by each NEO during that period. |
(2) | The non-CEO NEOs included in the 2025 average compensation are Salvatore Mancuso, Jody L. Begley, Heather A. Newman and Charles N. Whitaker. The non-CEO NEOs included in the 2024 average compensation are Salvatore Mancuso, Jody L. Begley, Robert A. McCarter III and Heather A. Newman. The non-CEO NEOs included in the 2021, 2022 and 2023 average compensation are Salvatore Mancuso, Murray R. Garnick, Jody L. Begley and Heather A. Newman. |
(3) | The peer group is the S&P 500 Food, Beverage & Tobacco Index, which is the same peer group used in the performance graph in Part II, Item 5 of our 2025 Form 10-K. |
(4) | Net income represents net earnings attributable to Altria as disclosed in the applicable year’s Annual Report on Form 10-K. |
(5) | Adjusted diluted EPS is a non-GAAP financial measure. See Exhibit A to this Proxy Statement for information regarding non-GAAP financial measures and reconciliations of these non-GAAP financial measures to the most directly comparable GAAP financial measures. |
(6) | Reflects a correction from the amount disclosed in the Proxy Statement for our 2025 Annual Meeting. |
(2) | The non-CEO NEOs included in the 2025 average compensation are Salvatore Mancuso, Jody L. Begley, Heather A. Newman and Charles N. Whitaker. The non-CEO NEOs included in the 2024 average compensation are Salvatore Mancuso, Jody L. Begley, Robert A. McCarter III and Heather A. Newman. The non-CEO NEOs included in the 2021, 2022 and 2023 average compensation are Salvatore Mancuso, Murray R. Garnick, Jody L. Begley and Heather A. Newman. |
(3) | The peer group is the S&P 500 Food, Beverage & Tobacco Index, which is the same peer group used in the performance graph in Part II, Item 5 of our 2025 Form 10-K. |
| | | | | Value of Initial Fixed $100 | | | |||||||||
Investment Based on: | ||||||||||||||||
Average | | |||||||||||||||
Summary | Average | |||||||||||||||
Summary | Compensation | Compensation | Altria | Peer Group | ||||||||||||
Compensation | Compensation | Table Total | Actually Paid | Total | Total | Adjusted | ||||||||||
Table Total | Actually Paid | for Non-CEO | to Non-CEO | Shareholder | Shareholder | Net | Diluted | |||||||||
for CEO | to CEO (1) | NEOs (2) | NEOs (2) | Return | Return (3) | Income (4) | EPS (5) | |||||||||
Year | ($) | ($) | ($) | ($) | ($) | ($) | ($ in millions) | ($) | ||||||||
2025 |
| 24,561,180 |
| 27,713,212 |
| 7,651,544 |
| 7,756,023 |
| 208.24 |
| 135.97 |
| 6,947 |
| 5.42 |
2024 | 26,788,612 |
| 24,949,438 |
| 5,414,614 | (6) | 6,969,475 | (6) | 176.17 |
| 125.52 |
| 11,264 |
| 5.19 | |
2023 |
| 18,528,628 |
| 14,405,880 |
| 5,705,089 |
| 4,627,220 |
| 125.06 |
| 121.25 |
| 8,130 |
| 5.01 |
2022 | 16,199,700 |
| 18,053,441 |
| 5,304,553 |
| 5,884,220 |
| 129.70 |
| 126.72 |
| 5,764 |
| 4.87 | |
2021 |
| 12,626,972 |
| 14,938,175 |
| 3,917,487 |
| 4,933,885 |
| 124.26 |
| 116.18 |
| 2,475 |
| 4.64 |
(1) | The dollar amounts represent the amount of compensation actually paid to each NEO, as computed in accordance with applicable SEC rules. The dollar amounts do not reflect the actual amount of compensation earned by or paid to each NEO during the applicable year. For 2025, the following adjustments were made to the amounts shown in the “Total” column of the Summary Compensation Table (“SCT”) to calculate the compensation actually paid amounts: |
| Deductions from SCT Total | | Additions to SCT Total (a) | |||||||||||||
| | Change in | | | Prior-Year | | | |||||||||
Value | Fair Value for | Fair Value | ||||||||||||||
for Outstanding | Outstanding | Change in | for Forfeited | |||||||||||||
Grant Date Fair | Change in | Awards | Awards | Fair Value | Awards | Dividend | Pension | |||||||||
Value of Equity | Pension | Granted This | Granted in | for Vested | Granted in any | Equivalents | Service | |||||||||
Awards (b) | Value (c) | Year (d) | Prior Years (e) | Awards (f) | Prior Year (g) | Paid (h) | Costs (i) | |||||||||
Year | ($) | ($) | ($) | ($) | ($) | ($) | ($) | ($) | ||||||||
CEO Adjustments |
| 9,350,079 | 4,935,823 | 9,885,536 | 2,953,365 | 1,163,944 | — | 1,102,047 | 2,333,042 | |||||||
Average Non-CEO NEOs Adjustments |
| 2,453,822 | 2,228,526 | 2,546,397 | 743,531 | 522,061 | — | 355,492 | 619,345 | |||||||
(a) | Fair values shown apply updated assumptions from the grant date assumptions described in Note 11 “Stock Plans” to our consolidated financial statements included in our 2025 Form 10-K. Fair values for PSUs take into account the probable outcome of the performance conditions as of the last day of 2025 or, if earlier, the vesting date. Fair values for RSUs use the price of Altria common stock as of the last day of 2025 or, if earlier, the vesting date. |
(b) | Each amount shown is the aggregate grant date fair value of stock awards determined pursuant to FASB Codification Topic 718. |
(c) | The amounts show the change in the present value of each NEO’s pension benefits for 2025 from December 31, 2024 to December 31, 2025. |
(d) | Reflects the fair value as of December 31 for outstanding and unvested grants awarded during 2025. |
(e) | For awards granted before 2025, reflects the change in fair value between the end of 2024 and 2025 for outstanding and unvested awards. |
(f) | For awards that vested, reflects the change in fair value between the end of 2024 and the vest date. |
(g) | Reflects the fair value as of the end of 2024 for awards forfeited during the year. |
(h) | Reflects the sum of all dividend equivalents on unvested RSUs that were paid during the year. |
(i) | Reflects the actuarial present value of benefits attributed by the pension benefit formula to services rendered by each NEO during that period. |
|
|
| (1) | Adjusted diluted EPS is a non-GAAP financial measure. See Exhibit A to this Proxy Statement for information regarding non-GAAP financial measures and reconciliations of these non-GAAP financial measures to the most directly comparable GAAP financial measures. |
|
The following table lists the most important performance measures that Altria used to link company performance to compensation actually paid to the NEOs for the most recently completed fiscal year. The first five items listed are financial performance measures. Strategic initiatives are non-financial performance measures that are defined by the Committee with respect to awards under the cash-based annual incentive award and LTIP programs.
Most Important Performance Measures |
Adjusted Diluted EPS (1) |
Adjusted Discretionary Cash Flow (1) |
Total Adjusted OCI (1) |
Cash Conversion (1) |
Relative TSR |
Strategic Initiatives |
(1) | Adjusted diluted EPS, adjusted discretionary cash flow, total adjusted OCI and cash conversion are non-GAAP financial measures. See Exhibit A to this Proxy Statement for information regarding non-GAAP financial measures. |
(5) | Adjusted diluted EPS is a non-GAAP financial measure. See Exhibit A to this Proxy Statement for information regarding non-GAAP financial measures and reconciliations of these non-GAAP financial measures to the most directly comparable GAAP financial measures. |
(6) | Reflects a correction from the amount disclosed in the Proxy Statement for our 2025 Annual Meeting. |