Pay vs Performance Disclosure - USD ($)
Dec. 31, 2025
Dec. 31, 2024
Dec. 31, 2023
Dec. 31, 2022
Pay Versus Performance
As required by Section 953(a) of the Dodd-Frank Wall Street Reform and Consumer Protection Act, and Item 402(v) of Regulation philosophy and how the Company aligns executive compensation with the Company’s performance, refer to “Executive Compensation.”
S-K,
we are providing the following information about the relationship between executive “compensation actually paid” (as computed in accordance with Item 402 of Regulation S-K)
and certain financial performance of the Company. “Compensation actually paid” does not reflect the actual amount of compensation earned or paid to an executive officer, and may differ significantly because of the impact of equity awards. For further information concerning the Company’s variable pay-for-performance
Value of Initial Fixed $100 Investment Based on: |
||||||||||||||||||||||||||||||||||||||||
Fiscal Year |
Summary Compensation Table Total for PEO (1) |
Compensation Actually Paid to PEO (2) |
Average Summary Compensation Table Total for Non-PEO NEOs (3) |
Average Compensation Actually Paid to Non-PEOs (4) |
Total Shareholder Return (5) |
Peer Group Total Shareholder Return (6) |
Net Income (millions) (7) |
Adjusted EBITDA (millions) (8) | ||||||||||||||||||||||||||||||||
(a) |
(b) |
(c) |
(d) |
(e) |
(f) |
(g) |
(h) |
(i) | ||||||||||||||||||||||||||||||||
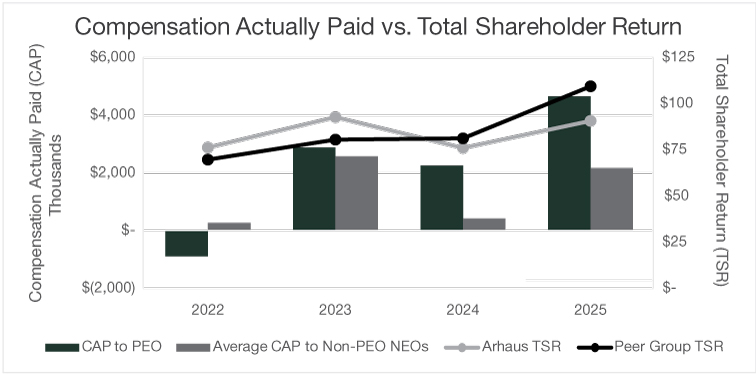
2025 |
$ |
4,649,751 |
$ |
4,649,751 |
$ |
2,957,987 |
$ |
2,169,919 |
$ |
90.59 |
$ |
109.38 |
$ |
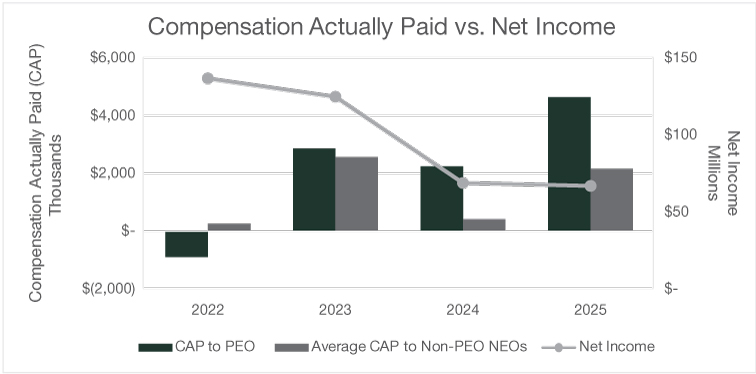
67 |
$ |
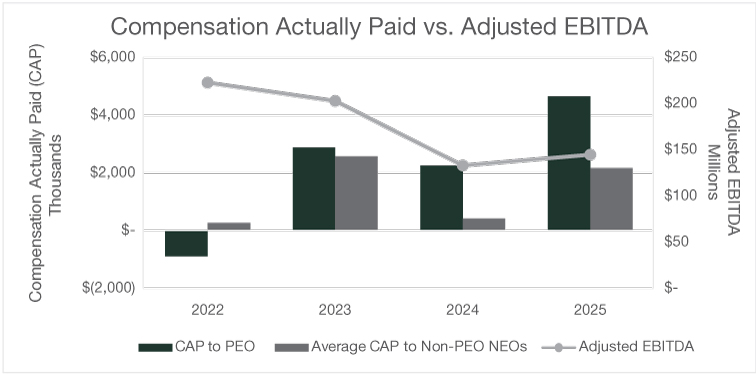
145 |
||||||||||||||||||||||||
2024 |
$ |
2,257,528 |
$ |
2,257,528 |
$ |
880,058 |
$ |
432,075 |
$ |
75.97 |
$ |
81.11 |
$ |
69 |
$ |
133 |
||||||||||||||||||||||||
2023 |
$ |
2,873,977 |
$ |
2,873,977 |
$ |
1,734,494 |
$ |
2,573,925 |
$ |
92.58 |
$ |
80.60 |
$ |
125 |
$ |
203 |
||||||||||||||||||||||||
2022 |
$ |
3,599,838 |
$ |
(886,579 |
) |
$ |
1,261,987 |
$ |
263,241 |
$ |
76.17 |
$ |
69.59 |
$ |
137 |
$ |
223 |
|||||||||||||||||||||||
| (1) | The dollar amounts reported in column (b) are the amounts of total compensation reported for Mr. Reed (our Chief Executive Officer) for each corresponding year in the “Total” column of the Summary Compensation Table. Refer to “Executive Compensation—Summary Compensation Table.” |
| (2) | The dollar amounts reported in column (c) represent the amount of “compensation actually paid” to Mr. Reed, as computed in accordance with Item 402(v) of Regulation S-K. The dollar amounts do not reflect the actual amount of compensation earned by or paid to Mr. Reed during the applicable year. In accordance with the requirements of Item 402(v) of Regulation S-K, the following adjustments were made to Mr. Reed’s total compensation for each year to determine the compensation actually paid: |
Fiscal Year |
Reported Summary Compensation Table Total for PEO |
Average Reported Value of Equity Awards (a) |
Average Equity Award Adjustments (b) |
Compensation Actually Paid to PEO | ||||||||||||||||
2025 |
$ |
4,649,751 |
$— |
$ — |
$ |
4,649,751 |
||||||||||||||
2024 |
$ |
2,257,528 |
$— |
$ — |
$ |
2,257,528 |
||||||||||||||
2023 |
$ |
2,873,977 |
$— |
$ — |
$ |
2,873,977 |
||||||||||||||
2022 |
$ |
3,599,838 |
$— |
$(4,486,417 |
) |
$ |
(886,579 |
) | ||||||||||||
| (a) | The grant date fair value of equity awards represents the amounts reported in the “Stock Awards” column in the Summary Compensation Table for the applicable year. |
| (b) | Mr. Reed did not receive equity awards during 2025, 2024, 2023 or 2022. The average equity award adjustment of $(4,486,417) made in 2022 relates to the change in the fair value (from prior year-end to vesting date) of all Stock Awards granted in any prior fiscal year that vested. |
| (3) | The dollar amounts reported in column (d) represent the average of the amounts reported for the Company’s named executive officers as a group (excluding Mr. Reed) in the “Total” column of the Summary Compensation Table in each applicable year. The names of each of the named executive officers (excluding Mr. Reed) included for purposes of calculating the average amounts in each applicable year are as follows: (i) for 2025, Michael Lee, Christian Sedor, Kathy Veltri, |
| Jennifer Porter, Allison Sutley, Dawn Phillipson, and Lisa Chi; (ii) for 2024, Dawn Phillipson, Kathy Veltri, Jennifer Porter and Lisa Chi; (iii) for 2023, Dawn Phillipson, Kathy Veltri, Lisa Chi and Venkat Nachiappan; and (iv) for 2022, Dawn Phillipson and Kathy Veltri. |
| (4) | The dollar amounts reported in column (e) represent the average amount of “compensation actually paid” to the named executive officers as a group (excluding Mr. Reed), as computed in accordance with Item 402(v) of Regulation S-K. The dollar amounts do not reflect the actual average amount of compensation earned by or paid to the named executive officers as a group (excluding Mr. Reed) during the applicable year. In accordance with the requirements of Item 402(v) of Regulation S-K, the following adjustments were made to average total compensation for the named executive officers as a group (excluding Mr. Reed) for each year to determine the compensation actually paid, using the same methodology described above: |
Fiscal Year |
Average Reported Summary Compensation Table Total For Non-PEO NEOs |
Average Reported Value of Equity Awards(a) |
Average Equity Award Adjustments(b) |
Average Compensation Actually Paid to NEO-PEO NEOs | ||||||||||||||||
2025 |
$2,957,987 |
$ |
2,416,120 |
$ |
(788,068) |
$ |
2,169,919 |
|||||||||||||
2024 |
$ 880,058 |
$ |
284,789 |
$ |
(447,983) |
$ |
432,075 |
|||||||||||||
2023 |
$1,734,494 |
$ |
1,067,786 |
$ |
839,431 |
$ |
2,573,925 |
|||||||||||||
2022 |
$1,261,987 |
$ |
287,500 |
$ |
(998,746) |
$ |
263,241 |
|||||||||||||
| (a) | The grant date fair value of equity awards represents the amounts reported in the “Stock Awards” column in the Summary Compensation Table for the applicable year. |
| (b) | Description of average equity award adjustments: |
2025 |
2024 |
2023 |
2022 |
|||||||||||||
Deduction of the grant date fair value of awards reported in the “Stock Awards” column of the Summary Compensation Table (Stock Awards) for the covered year |
$ | (2,416,120 | ) | $ | (284,789 | ) | $ | (1,067,786 | ) | $ | (287,500 | ) | ||||
Addition of the year-end fair value of all Stock Awards granted during the covered fiscal year that are outstanding and unvested |
2,025,665 | 170,619 | 1,501,066 | 487,500 | ||||||||||||
Change in the year-end fair value (from prior year-end) of all Stock Awards granted in any prior fiscal year that are outstanding and unvested |
19,827 | (235,231 | ) | 165,917 | (608,698 | ) | ||||||||||
Change in the fair value (from prior year-end to vesting date) of all Stock Awards granted in any prior fiscal year that vested |
4,368 | (98,582 | ) | 240,234 | (590,048 | ) | ||||||||||
Deduction of the beginning of the year fair value of all Stock Awards granted in any prior fiscal year that were forfeited |
(421,808 | ) | — | — | — | |||||||||||
Total Adjustments |
$ | (788,068 | ) | $ | (447,983 | ) | $ | 839,431 | $ | (998,746 | ) | |||||
| (5) | Cumulative TSR is calculated by dividing the sum of the cumulative amount of dividends for the measurement period, assuming dividend reinvestment, and the difference between the Company’s share price at the end and the beginning of the measurement period by the Company’s share price at the beginning of the measurement period. |
| (6) | Cumulative Peer Group TSR is calculated by dividing the sum of the cumulative amount of dividends for the measurement period, assuming dividend reinvestment, and the difference between the Dow Jones U.S. Furnishings index’s share price at the end and the beginning of the measurement period by the Dow Jones U.S. Furnishings index’s share price at the beginning of the measurement period. |
| (7) | The dollar amounts reported represent the amount of net income reflected in the Company’s audited financial statements for the applicable year. |
| (8) | The dollar amounts reported represent the amount of adjusted EBITDA, which is a non-GAAP measure. We believe that adjusted EBITDA is a useful measure of operating performance as the adjustments eliminate items that we believe are not reflective of underlying operating performance in a particular period. Adjusted EBITDA facilitates a comparison of our operating performance on a consistent basis from period-to-period 10-K for the applicable year. |
| (3) | The dollar amounts reported in column (d) represent the average of the amounts reported for the Company’s named executive officers as a group (excluding Mr. Reed) in the “Total” column of the Summary Compensation Table in each applicable year. The names of each of the named executive officers (excluding Mr. Reed) included for purposes of calculating the average amounts in each applicable year are as follows: (i) for 2025, Michael Lee, Christian Sedor, Kathy Veltri, |
| Jennifer Porter, Allison Sutley, Dawn Phillipson, and Lisa Chi; (ii) for 2024, Dawn Phillipson, Kathy Veltri, Jennifer Porter and Lisa Chi; (iii) for 2023, Dawn Phillipson, Kathy Veltri, Lisa Chi and Venkat Nachiappan; and (iv) for 2022, Dawn Phillipson and Kathy Veltri. |
| (2) | The dollar amounts reported in column (c) represent the amount of “compensation actually paid” to Mr. Reed, as computed in accordance with Item 402(v) of Regulation S-K. The dollar amounts do not reflect the actual amount of compensation earned by or paid to Mr. Reed during the applicable year. In accordance with the requirements of Item 402(v) of Regulation S-K, the following adjustments were made to Mr. Reed’s total compensation for each year to determine the compensation actually paid: |
Fiscal Year |
Reported Summary Compensation Table Total for PEO |
Average Reported Value of Equity Awards (a) |
Average Equity Award Adjustments (b) |
Compensation Actually Paid to PEO | ||||||||||||||||
2025 |
$ |
4,649,751 |
$— |
$ — |
$ |
4,649,751 |
||||||||||||||
2024 |
$ |
2,257,528 |
$— |
$ — |
$ |
2,257,528 |
||||||||||||||
2023 |
$ |
2,873,977 |
$— |
$ — |
$ |
2,873,977 |
||||||||||||||
2022 |
$ |
3,599,838 |
$— |
$(4,486,417 |
) |
$ |
(886,579 |
) | ||||||||||||
| (a) | The grant date fair value of equity awards represents the amounts reported in the “Stock Awards” column in the Summary Compensation Table for the applicable year. |
| (b) | Mr. Reed did not receive equity awards during 2025, 2024, 2023 or 2022. The average equity award adjustment of $(4,486,417) made in 2022 relates to the change in the fair value (from prior year-end to vesting date) of all Stock Awards granted in any prior fiscal year that vested. |
| (3) | The dollar amounts reported in column (d) represent the average of the amounts reported for the Company’s named executive officers as a group (excluding Mr. Reed) in the “Total” column of the Summary Compensation Table in each applicable year. The names of each of the named executive officers (excluding Mr. Reed) included for purposes of calculating the average amounts in each applicable year are as follows: (i) for 2025, Michael Lee, Christian Sedor, Kathy Veltri, |
| Jennifer Porter, Allison Sutley, Dawn Phillipson, and Lisa Chi; (ii) for 2024, Dawn Phillipson, Kathy Veltri, Jennifer Porter and Lisa Chi; (iii) for 2023, Dawn Phillipson, Kathy Veltri, Lisa Chi and Venkat Nachiappan; and (iv) for 2022, Dawn Phillipson and Kathy Veltri. |
| (4) | The dollar amounts reported in column (e) represent the average amount of “compensation actually paid” to the named executive officers as a group (excluding Mr. Reed), as computed in accordance with Item 402(v) of Regulation S-K. The dollar amounts do not reflect the actual average amount of compensation earned by or paid to the named executive officers as a group (excluding Mr. Reed) during the applicable year. In accordance with the requirements of Item 402(v) of Regulation S-K, the following adjustments were made to average total compensation for the named executive officers as a group (excluding Mr. Reed) for each year to determine the compensation actually paid, using the same methodology described above: |
Fiscal Year |
Average Reported Summary Compensation Table Total For Non-PEO NEOs |
Average Reported Value of Equity Awards(a) |
Average Equity Award Adjustments(b) |
Average Compensation Actually Paid to NEO-PEO NEOs | ||||||||||||||||
2025 |
$2,957,987 |
$ |
2,416,120 |
$ |
(788,068) |
$ |
2,169,919 |
|||||||||||||
2024 |
$ 880,058 |
$ |
284,789 |
$ |
(447,983) |
$ |
432,075 |
|||||||||||||
2023 |
$1,734,494 |
$ |
1,067,786 |
$ |
839,431 |
$ |
2,573,925 |
|||||||||||||
2022 |
$1,261,987 |
$ |
287,500 |
$ |
(998,746) |
$ |
263,241 |
|||||||||||||
| (a) | The grant date fair value of equity awards represents the amounts reported in the “Stock Awards” column in the Summary Compensation Table for the applicable year. |
| (b) | Description of average equity award adjustments: |
2025 |
2024 |
2023 |
2022 |
|||||||||||||
Deduction of the grant date fair value of awards reported in the “Stock Awards” column of the Summary Compensation Table (Stock Awards) for the covered year |
$ | (2,416,120 | ) | $ | (284,789 | ) | $ | (1,067,786 | ) | $ | (287,500 | ) | ||||
Addition of the year-end fair value of all Stock Awards granted during the covered fiscal year that are outstanding and unvested |
2,025,665 | 170,619 | 1,501,066 | 487,500 | ||||||||||||
Change in the year-end fair value (from prior year-end) of all Stock Awards granted in any prior fiscal year that are outstanding and unvested |
19,827 | (235,231 | ) | 165,917 | (608,698 | ) | ||||||||||
Change in the fair value (from prior year-end to vesting date) of all Stock Awards granted in any prior fiscal year that vested |
4,368 | (98,582 | ) | 240,234 | (590,048 | ) | ||||||||||
Deduction of the beginning of the year fair value of all Stock Awards granted in any prior fiscal year that were forfeited |
(421,808 | ) | — | — | — | |||||||||||
Total Adjustments |
$ | (788,068 | ) | $ | (447,983 | ) | $ | 839,431 | $ | (998,746 | ) | |||||
Financial Performance Measures
The following is a list of financial performance measures, which we believe, represent the most important performance used by the Company to link compensation actually paid to our named executive officers, for fiscal year 2025, to Company performance. The written sales (demand) and adjusted EBITDA measures are further described above in “Executive Compensation”.
• |
Written Sales (Demand) |
• |
Adjusted EBITDA |
• |
Net Income |
| (8) | The dollar amounts reported represent the amount of adjusted EBITDA, which is a non-GAAP measure. We believe that adjusted EBITDA is a useful measure of operating performance as the adjustments eliminate items that we believe are not reflective of underlying operating performance in a particular period. Adjusted EBITDA facilitates a comparison of our operating performance on a consistent basis from period-to-period 10-K for the applicable year. |