Pay vs Performance Disclosure
Dec. 31, 2025
USD ($)
Dec. 31, 2024
USD ($)
Dec. 31, 2023
USD ($)
Dec. 31, 2022
USD ($)
Dec. 31, 2021
USD ($)
PAY VS. PERFORMANCE |
As required by Section 953(a) of the Dodd-Frank Wall Street Reform and Consumer Protection Act and Item 402(v) of Regulation
S-K,
we are providing the following information about the relationship between executive compensation and the Company’s financial performance. The following required table discloses information on “compensation actually paid” (referred to as “CAP” throughout this section), as defined by Item 402(v) of Regulation
S-K,
to our principal executive officer (“PEO”) and (on average) to our other NEOs (“Non-PEO
NEOs”) during the specified years with TSR and net income financial measures, as well as a Company-selected measure of one-year
relative TSR. The Company selected this measure as the most important in linking CAP to our NEOs for 2025 to Company performance, as relative TSR was the financial measure used for the majority of our 2023-2025 performance awards (totaling two-thirds
of target long-term incentive awards granted to our executives for that performance cycle), as described in more detail on page 44. Value of Initial Fixed $100 Investment Based On: |
||||||||||||||||||||||||
Year (a) |
Summary Compensation Table Total for PEO ($) (b) (1) |
Compensation Actually Paid to PEO ($) (c) (1)(2) |
Average Summary Compensation Table Total for Non-PEO NEOs ($) (d) (3) |
Average Compensation Actually Paid to Non-PEO NEOs ($) (e) (3)(4) |
Total Shareholder Return ($) (f) (5) |
Peer Group Total Shareholder Return ($) (g) (5)(6) |
Net Income ($ millions) (h) (7) |
One-Year Total Shareholder Return Percentile Rank (%) (i) (8) | ||||||||||||||||
2025 |
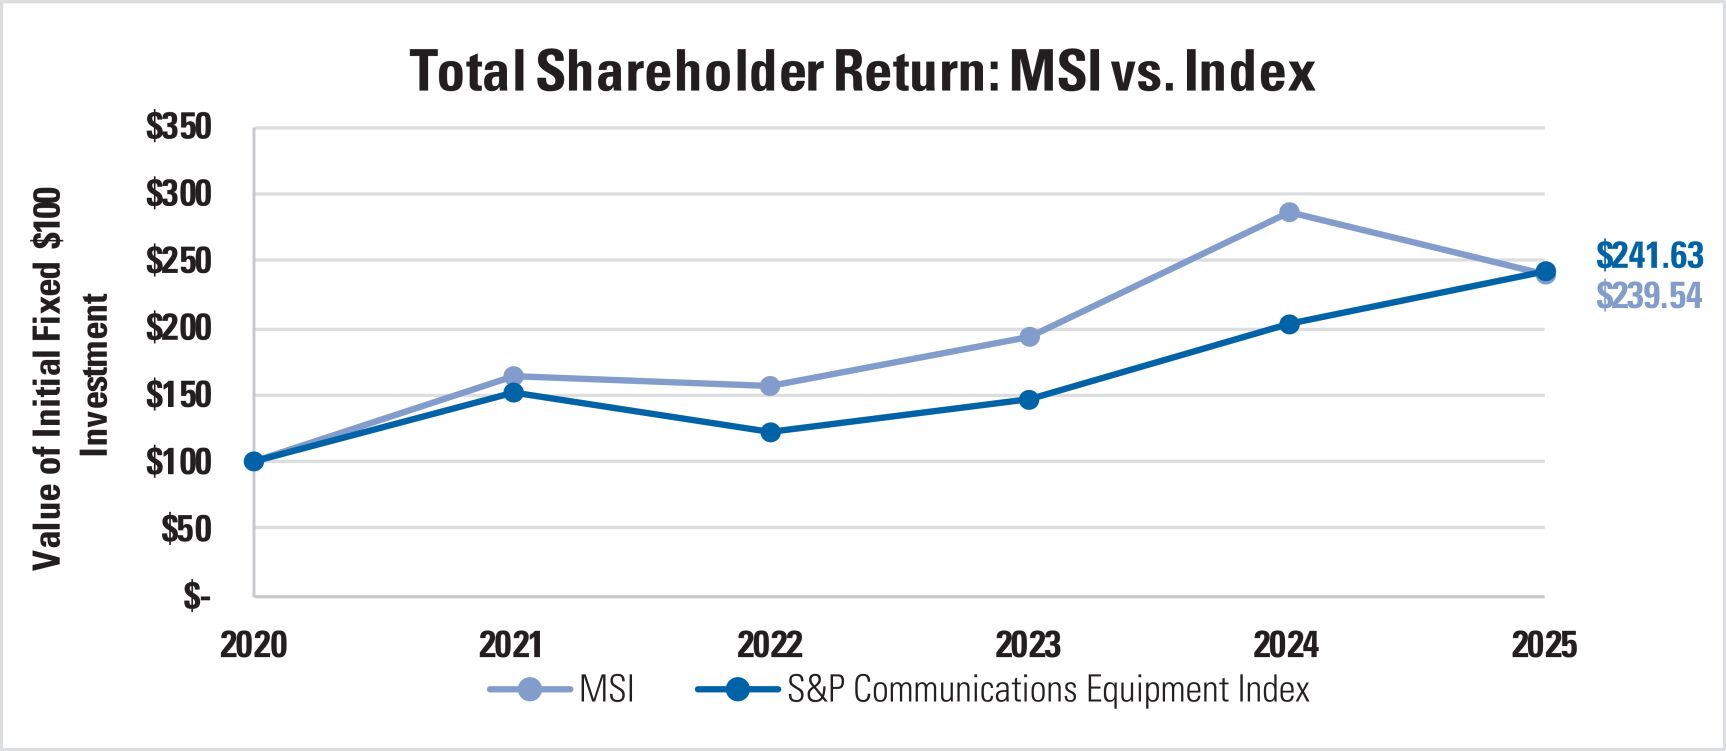
$34,453,481 | $(34,855,292) | $6,758,119 | $(11,029,579) | $239.54 | $241.63 | $2,154 | 13.6% | ||||||||||||||||
2024 |
$30,853,387 | $145,495,803 | $17,519,302 | $37,512,833 | $285.73 | $201.64 | $1,557 | 89.6% | ||||||||||||||||
2023 |
$28,178,498 | $57,776,736 | $6,206,675 | $11,216,832 | $191.61 | $146.05 | $1,709 | 69.9% | ||||||||||||||||
2022 |
$21,016,481 | $19,817,153 | $5,745,113 | $6,254,463 | $155.74 | $121.24 | $1,363 | 65.4% | ||||||||||||||||
2021 |
$19,980,639 | $86,440,713 | $4,923,478 | $13,731,315 | $161.91 | $151.31 | $1,245 | 89.8% | ||||||||||||||||
| (1) | Gregory Q. Brown served as our PEO for the full year for each of 2025, 2024, 2023, 2022 and 2021. The amounts in columns (b) and (c) include Mr. Brown’s compensation for 2021-2025. |
| (2) | The dollar amounts shown in column (c) reflect “compensation actually paid” to Mr. Brown, calculated in accordance with SEC rules. As required, the dollar amounts include (among other items) unpaid amounts of equity compensation that may be realizable in future periods, and as such, the dollar amounts shown do not fully represent the actual final amount of compensation earned or actually paid to Mr. Brown during the applicable years. The amounts deducted and added to the PEO’s 2025 Summary Compensation Table total in order to determine the PEO’s 2025 CAP are as follows: |
PEO – Reconciliation of SCT Total to CAP Total (column (c)) |
2025 |
|||
SCT Total |
34,453,481 | |||
Less SCT Change in Present Value of Pension Plan (a) |
(9,796 | ) | ||
Less SCT Stock Awards (b) |
(18,964,846 | ) | ||
Less SCT Option Awards (b) |
(9,121,534 | ) | ||
Plus Pension Programs Service Cost (c) |
0 | |||
Plus Pension Programs Prior Service Cost (c) |
0 | |||
Plus Value of New Stock and Option Awards Granted in Current Year and Unvested as of Year End (d) |
17,243,538 | |||
Plus Change in Value of Stock and Option Awards Granted in Prior Years and Unvested as of Year End (d) |
(46,210,856 | ) | ||
Plus New Stock and Option Award Grants Value as of Vesting Date (d) |
0 | |||
Plus Change in Value of Stock and Option Awards Granted in Prior Years as of Vesting Date (d) |
(12,245,279 | ) | ||
Less Prior Year Value of Stock and Option Awards Forfeited or Cancelled (d) |
0 | |||
Compensation Actually Paid |
(34,855,292 |
) | ||
| (a) | Represents the aggregate change in actuarial present value of the PEO’s benefits under all pension plans for each year, as previously reported in the applicable SCT. |
| (b) | Represents the aggregate grant date fair value of equity-based awards granted each year as computed in accordance with ASC Topic 718, as previously reported in the applicable SCT. |
| (c) | There was no service cost or prior service cost for our defined benefit pension plans because our executives who participate in those plans ceased accruing service credit under those plans when they were frozen in early 2009. |
| (d) | Reflects the fair value or change in fair value of equity-based awards, calculated in accordance with Regulation S-K Item 402(v)(2)(iii)(C). |
| (3) | For 2021, our Non-PEO NEOs included Messrs. Winkler and Molloy and Dr. Saptharishi, and former executives Mark Hacker and Kelly Mark. For 2022, our Non-PEO NEOs included Messrs. Winkler and Molloy and Dr. Saptharishi and former executive Mark Hacker. For 2023, 2024 and 2025, our Non-PEO NEOs included Messrs. Winkler and Molloy, and Drs. Saptharishi and Naik. |
| (4) | The dollar amounts shown in column (e) reflect average CAP to our Non-PEO NEOs, calculated in accordance with SEC rules. As required, the dollar amounts include (among other items) unpaid amounts of equity compensation that may be realizable in future periods, and as such, the dollar amounts shown do not fully represent the actual final amount of compensation earned or actually paid to our Non-PEO NEOs during the applicable years. The amounts deducted and added to the Non-PEO NEOs’ 2025 SCT total in order to determine the Non-PEO NEOs’ 2025 CAP are as follows: |
Non-PEO NEOs (Average) – Reconciliation of SCT Total to CAP Total (column (e)) |
2025 Average |
|||
SCT Total |
6,758,119 | |||
Less SCT Change in Present Value of Pension Plan (a) |
(4,905 | ) | ||
Less SCT Stock Awards (b) |
(2,971,144 | ) | ||
Less SCT Option Awards (b) |
(1,429,036 | ) | ||
Plus Pension Programs Service Cost (c) |
0 | |||
Plus Pension Programs Prior Service Cost (c) |
0 | |||
Plus Value of New Stock and Option Awards Granted in Current Year and Unvested as of Year End (d) |
2,701,472 | |||
Plus Change in Value of Stock and Option Awards Granted in Prior Years and Unvested as of Year End (d) |
(13,775,211 | ) | ||
Plus New Stock and Option Award Grants Value as of Vesting Date (d) |
0 | |||
Plus Change in Value of Stock and Option Awards Granted in Prior Years as of Vesting Date (d) |
(2,308,874 | ) | ||
Less Prior Year Value of Stock and Option Awards Forfeited or Cancelled (d) |
0 | |||
Compensation Actually Paid |
(11,029,579 |
) | ||
| (a) | Represents the aggregate change in actuarial present value of the Non-PEO NEOs’ benefits under all pension plans for each year, as previously reported in the applicable SCT. |
| (b) | Represents the aggregate grant date fair value of equity-based awards granted each year as computed in accordance with ASC Topic 718, as previously reported in the applicable SCT. |
| (c) | There was no service cost or prior service cost for our defined benefit pension plans because our executives who participate in those plans ceased accruing service credit under those plans when they were frozen in early 2009. |
| (d) | Reflects the fair value or change in fair value of equity-based awards, calculated in accordance with Regulation S-K Item 402(v)(2)(iii)(C). |
| (5) | Pursuant to SEC rules, the TSR figures assume an initial investment of $100 on December 31, 2020. For 2025, reflects the cumulative total shareholder return from December 31, 2020-December 31, 2025. For 2024, reflects the cumulative total shareholder return from December 31, 2020-December 31, 2024. For 2023, reflects the cumulative total shareholder return from December 31, 2020-December 31, 2023. For 2022, reflects the cumulative total shareholder return from December 31, 2020-December 31, 2022. For 2021, reflects the cumulative total shareholder return from December 31, 2020-December 31, 2021. |
| (6) | Reflects the market cap weighted total shareholder return of the S&P Communications Equipment Index. As permitted by SEC rules, the peer group referenced for purpose of the TSR comparison is the group of companies included in the S&P Communications Equipment Index, which is the industry peer group used for purposes of Item 201(e) of Regulation S-K. For a description of the separate peer group used by the Compensation and Leadership Committee, for purposes of determining compensation paid to our executive officers, refer to the section of this Proxy Statement on page 52 titled “Comparative Market Data – 2025 Peer Group.” |
| (7) | Reflects after-tax net income attributable to shareholders prepared in accordance with GAAP for each of the years shown. We do not use net income in our compensation programs. |
| (8) | Reflects the Company’s percentile rank based on one-year TSR relative to the S&P 500, which, for 2025, represents, in the Company’s assessment, the most important financial performance measure used to link NEO compensation actually paid to company performance for the most recently completed fiscal year. We have included one-year relative TSR in the table in accordance with applicable SEC guidance. However, percentile rank based on three-year TSR relative to the S&P 500 is the measure actually used in the Company’s compensation programs. The Company’s three-year percentile rank was 70th for 2025, 92nd for 2024, 89th for 2023, 78th for 2022 and 79th for 2021. This three-year measure represented 57% of 2025 target total compensation for Mr. Brown and an average of 47% of 2025 target total compensation for other NEOs. For additional detail regarding the calculation of this three-year measure, refer to the section of this Proxy Statement on page 51 titled “2025 Annual Compensation Elements – Long-Term Incentives – LTI Components.” |
Non-PEO
NEOs included Messrs. Winkler and Molloy and Dr. Saptharishi, and former executives Mark Hacker and Kelly Mark. For 2022, our Non-PEO
NEOs included Messrs. Winkler and Molloy and Dr. Saptharishi and former executive Mark Hacker. For 2023, 2024 and 2025, our Non-PEO
NEOs included Messrs. Winkler and Molloy, and Drs. Saptharishi and Naik.
S-K.
For a description of the separate peer group used by the Compensation and Leadership Committee, for purposes of determining compensation paid to our executive officers, refer to the section of this Proxy Statement on page 52 titled “Comparative Market Data – 2025 Peer Group.”
| (2) | The dollar amounts shown in column (c) reflect “compensation actually paid” to Mr. Brown, calculated in accordance with SEC rules. As required, the dollar amounts include (among other items) unpaid amounts of equity compensation that may be realizable in future periods, and as such, the dollar amounts shown do not fully represent the actual final amount of compensation earned or actually paid to Mr. Brown during the applicable years. The amounts deducted and added to the PEO’s 2025 Summary Compensation Table total in order to determine the PEO’s 2025 CAP are as follows: |
PEO – Reconciliation of SCT Total to CAP Total (column (c)) |
2025 |
|||
SCT Total |
34,453,481 | |||
Less SCT Change in Present Value of Pension Plan (a) |
(9,796 | ) | ||
Less SCT Stock Awards (b) |
(18,964,846 | ) | ||
Less SCT Option Awards (b) |
(9,121,534 | ) | ||
Plus Pension Programs Service Cost (c) |
0 | |||
Plus Pension Programs Prior Service Cost (c) |
0 | |||
Plus Value of New Stock and Option Awards Granted in Current Year and Unvested as of Year End (d) |
17,243,538 | |||
Plus Change in Value of Stock and Option Awards Granted in Prior Years and Unvested as of Year End (d) |
(46,210,856 | ) | ||
Plus New Stock and Option Award Grants Value as of Vesting Date (d) |
0 | |||
Plus Change in Value of Stock and Option Awards Granted in Prior Years as of Vesting Date (d) |
(12,245,279 | ) | ||
Less Prior Year Value of Stock and Option Awards Forfeited or Cancelled (d) |
0 | |||
Compensation Actually Paid |
(34,855,292 |
) | ||
| (a) | Represents the aggregate change in actuarial present value of the PEO’s benefits under all pension plans for each year, as previously reported in the applicable SCT. |
| (b) | Represents the aggregate grant date fair value of equity-based awards granted each year as computed in accordance with ASC Topic 718, as previously reported in the applicable SCT. |
| (c) | There was no service cost or prior service cost for our defined benefit pension plans because our executives who participate in those plans ceased accruing service credit under those plans when they were frozen in early 2009. |
| (d) | Reflects the fair value or change in fair value of equity-based awards, calculated in accordance with Regulation S-K Item 402(v)(2)(iii)(C). |
| (4) | The dollar amounts shown in column (e) reflect average CAP to our Non-PEO NEOs, calculated in accordance with SEC rules. As required, the dollar amounts include (among other items) unpaid amounts of equity compensation that may be realizable in future periods, and as such, the dollar amounts shown do not fully represent the actual final amount of compensation earned or actually paid to our Non-PEO NEOs during the applicable years. The amounts deducted and added to the Non-PEO NEOs’ 2025 SCT total in order to determine the Non-PEO NEOs’ 2025 CAP are as follows: |
Non-PEO NEOs (Average) – Reconciliation of SCT Total to CAP Total (column (e)) |
2025 Average |
|||
SCT Total |
6,758,119 | |||
Less SCT Change in Present Value of Pension Plan (a) |
(4,905 | ) | ||
Less SCT Stock Awards (b) |
(2,971,144 | ) | ||
Less SCT Option Awards (b) |
(1,429,036 | ) | ||
Plus Pension Programs Service Cost (c) |
0 | |||
Plus Pension Programs Prior Service Cost (c) |
0 | |||
Plus Value of New Stock and Option Awards Granted in Current Year and Unvested as of Year End (d) |
2,701,472 | |||
Plus Change in Value of Stock and Option Awards Granted in Prior Years and Unvested as of Year End (d) |
(13,775,211 | ) | ||
Plus New Stock and Option Award Grants Value as of Vesting Date (d) |
0 | |||
Plus Change in Value of Stock and Option Awards Granted in Prior Years as of Vesting Date (d) |
(2,308,874 | ) | ||
Less Prior Year Value of Stock and Option Awards Forfeited or Cancelled (d) |
0 | |||
Compensation Actually Paid |
(11,029,579 |
) | ||
| (a) | Represents the aggregate change in actuarial present value of the Non-PEO NEOs’ benefits under all pension plans for each year, as previously reported in the applicable SCT. |
| (b) | Represents the aggregate grant date fair value of equity-based awards granted each year as computed in accordance with ASC Topic 718, as previously reported in the applicable SCT. |
| (c) | There was no service cost or prior service cost for our defined benefit pension plans because our executives who participate in those plans ceased accruing service credit under those plans when they were frozen in early 2009. |
| (d) | Reflects the fair value or change in fair value of equity-based awards, calculated in accordance with Regulation S-K Item 402(v)(2)(iii)(C). |
Relationship Between Pay And Performance
The following narrative and graphical comparisons provide descriptions of the relationship between certain figures included in the Pay vs. Performance table for each of 2025, 2024, 2023, 2022, and 2021, including: (a) a comparison of each financial performance measure (TSR, net income and the Company-selected measure) and the compensation actually paid to the PEO and to the other
Non-PEO
NEOs; and (b) the relationship between the Company’s TSR and the peer group TSR. PEO
|
From 2024 to 2025, compensation actually paid to the CEO decreased by $180.4 million or 124%. Over this same period, the Company’s TSR decreased by 16%, net income increased by 38%, and one-year relative TSR percentile rank decreased by 85% (from 89.6th percentile rank to 13.6th percentile rank). |
|
From 2023 to 2024, compensation actually paid to the CEO increased by $87.7 million or 152%. Over this same period, the Company’s TSR increased by 49%, net income decreased by 8.9%, and one-year relative TSR percentile rank increased by 28% (from 69.9th percentile rank to 89.6th percentile rank). |
|
From 2022 to 2023, compensation actually paid to the CEO increased by $38.0 million or 192%. Over this same period, the Company’s TSR increased by 23%, net income increased by 25.4%, and one-year relative TSR percentile rank increased by 7% (from 65.4th percentile rank to 69.9th percentile rank). |
|
From 2021 to 2022, compensation actually paid to the CEO decreased by $66.6 million or 77%. Over this same period, the Company’s TSR decreased by 4%, net income increased by 9.5%, and one-year relative TSR percentile rank decreased by 27% (from 89.8th percentile rank to 65.4th percentile rank). |
Non-PEO
NEOs |
From 2024 to 2025, compensation actually paid to the Non-PEO NEOs decreased by $48.5 million or 129%. Over this same period, the Company’s TSR decreased by 16%, net income increased by 38%, and one-year relative TSR percentile rank decreased by 85% (from 89.6th percentile rank to 13.6th percentile rank). |
|
From 2023 to 2024, compensation actually paid to the Non-PEO NEOs increased by $26.3 million or 234%. Over this same period, the Company’s TSR increased by 49%, net income decreased by 8.9%, and one-year relative TSR percentile rank increased by 28% (from 69.9th percentile rank to 89.6th percentile rank). |
|
From 2022 to 2023, compensation actually paid to the Non-PEO NEOs increased by $5.0 million or 79%. Over this same period, the Company’s TSR increased by 23%, net income increased by 25.4%, and one-year relative TSR percentile rank increased by 7% (from 65.4th percentile rank to 69.9th percentile rank). |
|
From 2021 to 2022, compensation actually paid to the Non-PEO NEOs decreased by $7.5 million or 54%. Over this same period, the Company’s TSR decreased by 4%, net income increased by 9.5%, and one-year relative TSR percentile rank decreased by 27% (from 89.8th percentile rank to 65.4th percentile rank). |
Relationship Between Pay And Performance
The following narrative and graphical comparisons provide descriptions of the relationship between certain figures included in the Pay vs. Performance table for each of 2025, 2024, 2023, 2022, and 2021, including: (a) a comparison of each financial performance measure (TSR, net income and the Company-selected measure) and the compensation actually paid to the PEO and to the other
Non-PEO
NEOs; and (b) the relationship between the Company’s TSR and the peer group TSR. Compensation Actually Paid versus Company Performance.
PEO
|
From 2024 to 2025, compensation actually paid to the CEO decreased by $180.4 million or 124%. Over this same period, the Company’s TSR decreased by 16%, net income increased by 38%, and one-year relative TSR percentile rank decreased by 85% (from 89.6th percentile rank to 13.6th percentile rank). |
|
From 2023 to 2024, compensation actually paid to the CEO increased by $87.7 million or 152%. Over this same period, the Company’s TSR increased by 49%, net income decreased by 8.9%, and one-year relative TSR percentile rank increased by 28% (from 69.9th percentile rank to 89.6th percentile rank). |
|
From 2022 to 2023, compensation actually paid to the CEO increased by $38.0 million or 192%. Over this same period, the Company’s TSR increased by 23%, net income increased by 25.4%, and one-year relative TSR percentile rank increased by 7% (from 65.4th percentile rank to 69.9th percentile rank). |
|
From 2021 to 2022, compensation actually paid to the CEO decreased by $66.6 million or 77%. Over this same period, the Company’s TSR decreased by 4%, net income increased by 9.5%, and one-year relative TSR percentile rank decreased by 27% (from 89.8th percentile rank to 65.4th percentile rank). |
Non-PEO
NEOs |
From 2024 to 2025, compensation actually paid to the Non-PEO NEOs decreased by $48.5 million or 129%. Over this same period, the Company’s TSR decreased by 16%, net income increased by 38%, and one-year relative TSR percentile rank decreased by 85% (from 89.6th percentile rank to 13.6th percentile rank). |
|
From 2023 to 2024, compensation actually paid to the Non-PEO NEOs increased by $26.3 million or 234%. Over this same period, the Company’s TSR increased by 49%, net income decreased by 8.9%, and one-year relative TSR percentile rank increased by 28% (from 69.9th percentile rank to 89.6th percentile rank). |
|
From 2022 to 2023, compensation actually paid to the Non-PEO NEOs increased by $5.0 million or 79%. Over this same period, the Company’s TSR increased by 23%, net income increased by 25.4%, and one-year relative TSR percentile rank increased by 7% (from 65.4th percentile rank to 69.9th percentile rank). |
|
From 2021 to 2022, compensation actually paid to the Non-PEO NEOs decreased by $7.5 million or 54%. Over this same period, the Company’s TSR decreased by 4%, net income increased by 9.5%, and one-year relative TSR percentile rank decreased by 27% (from 89.8th percentile rank to 65.4th percentile rank). |
Company TSR versus S&P Communications Equipment TSR.
The following table lists the three financial performance measures we believe
represent th
e most important financial performance
measures we use to link executive compensation actually paid to our NEOs for 2025 to Company performance: 2025 Most Important Performance Measures |
Relative TSR Percentile Rank |
Stock Price |
Non-GAAP Operating Earnings |
For more information about how we use these financial performance measures in our compensation programs, see the section of this Proxy Statement titled “Compensation Discussion and Analysis” beginning on page 34.