Pay vs Performance Disclosure
|
12 Months Ended |
|
Dec. 31, 2025
USD ($)
|
Dec. 31, 2024
USD ($)
|
Dec. 31, 2023
USD ($)
|
Dec. 31, 2022
USD ($)
|
Dec. 31, 2021
USD ($)
|
| Pay vs Performance Disclosure |
|
|
|
|
|
| Pay vs Performance Disclosure, Table |
| | | | | | | | | | | | | | | | | | | | | | | | | | | | | | | | Value of Initial
Fixed $100
Investment Based On: | | | | Year | Summary Compensation Table for CEO($)(1) | Compensation Actually Paid to CEO(1)(3) ($) | Average Summary Compensation Table Total for Non-CEO Named Executive Officers ($)(2) | Average Compensation Actually Paid to Non-CEO Named Executive Officers(2)(3) ($) | Cumulative
TSR ($) | Peer Group Cumulative TSR(4) ($) | Net Earnings ($, in thousands) | Company Selected Measure - Adjusted Non-GAAP ROIC(5) | 2025 | 10,498,947 | | 684,103 | | 3,310,194 | | 2,127,847 | | 107.07 | | 186.96 | | 157,347 | | 15.15 | % | | 2024 | 8,658,843 | | (3,178,281) | | 2,358,193 | | (573,947) | | 216.39 | | 192.86 | | 249,691 | | 15.28 | % | | 2023 | 10,693,722 | | 21,050,619 | | 3,991,384 | | 7,306,108 | | 252.08 | | 154.93 | | 281,309 | | 17.27 | % | | 2022 | 6,217,650 | | 5,877,012 | | 3,233,865 | | 3,191,053 | | 142.65 | | 122.55 | | 280,608 | | 15.94 | % | | 2021 | 6,638,325 | | 10,466,880 | | 2,212,425 | | 3,158,776 | | 151.66 | | 152.67 | | 219,345 | | 14.01 | % | | | | | | | | | |
|
|
|
|
|
| Company Selected Measure Name |
Adjusted non-GAAP ROIC
|
|
|
|
|
| Named Executive Officers, Footnote |
Joyce A. Mullen served as our CEO in 2025, 2024, 2023 and 2022 and Kenneth T. Lamneck was our CEO in 2021. 2.For 2025, our non-CEO Named Executive Officers were James A. Morgado, Adrian Gregory, Jennifer Vasin and Robert Green. For 2024 and 2023, our non-CEO Named Executive Officers were Glynis A. Bryan, Dee Burger, Adrian Gregory, and Samuel C. Cowley. For 2022, our non-CEO Named Executive Officers were Glynis A. Bryan, Dee Burger, James A. Morgado and Samuel C. Cowley. For 2021, our non-CEO Named Executive Officers were Glynis A. Bryan, Joyce A. Mullen, Emma de Sousa and Samuel C. Cowley.
|
|
|
|
|
| Peer Group Issuers, Footnote |
The Peer Group TSR set forth in this table utilizes an industry benchmark index, the Nasdaq US Benchmark Computer Hardware TR Index, which we also utilize in the stock performance graph required by Item 201(e) of SEC Regulation S-K included in our Annual Report on Form 10-K for the year ended December 31, 2025.
|
|
|
|
|
| PEO Total Compensation Amount |
$ 10,498,947
|
$ 8,658,843
|
$ 10,693,722
|
$ 6,217,650
|
$ 6,638,325
|
| PEO Actually Paid Compensation Amount |
$ 684,103
|
(3,178,281)
|
21,050,619
|
5,877,012
|
10,466,880
|
| Adjustment To PEO Compensation, Footnote |
For each of 2025, 2024, 2023, 2022, and 2021, the values included in this column for the compensation actually paid to our CEO and the average compensation actually paid to our non-CEO Named Executive Officers have been calculated in accordance with Item 402(v) of Regulation S-K and do not reflect compensation actually earned, realized, or received by the CEO or other Named Executive Officers. These amounts reflect the Summary Compensation Table Total with certain adjustments in accordance with Item 402(v) of Regulation S-K as described in the tables below. | | | | | | | | | | | | | | | | | | | | CEO | | Kenneth T. Lamneck | Joyce A. Mullen | Joyce A. Mullen | Joyce A. Mullen | Joyce A. Mullen | | Year | | 2021 | 2022 | 2023 | 2024 | 2025 | | Summary Compensation Table Total for CEO | | $ | 6,638,325 | | $ | 6,217,650 | | $ | 10,693,722 | | $ | 8,658,843 | | $ | 10,498,947 | | | Equity values reported in SCT | | (3,750,037) | | (3,258,530) | | (8,218,464) | | (6,902,996) | | (8,085,326) | | | | | | | | | | Fair value of equity compensation granted in current year - value at year end | | 4,424,646 | | 3,259,344 | | 14,035,476 | | 5,026,258 | | 2,926,292 | | | | | | | | | | Awards made in prior fiscal years that were unvested at the end of the current fiscal year, add/subtract change in fair value from end of prior fiscal year to end of current fiscal year | | 2,555,090 | | (187,001) | | 3,436,806 | | (2,840,216) | | (4,944,130) | | | Awards made in prior fiscal years that vested during current fiscal year, add/subtract change in fair value from end of prior fiscal year to vesting date | | 598,856 | | (154,451) | | 1,103,079 | | 89,223 | | 288,320 | | Awards made in prior fiscal years that were forfeited during current fiscal years, subtract fair value of forfeited awards determined at the end of prior year | | $ | — | | $ | — | | $ | — | | $ | (7,209,393) | | $ | — | | | Compensation Actually Paid to CEO | | $ | 10,466,880 | | $ | 5,877,012 | | $ | 21,050,619 | | $ | (3,178,281) | | $ | 684,103 | |
|
|
|
|
|
| Non-PEO NEO Average Total Compensation Amount |
$ 3,310,194
|
2,358,193
|
3,991,384
|
3,233,865
|
2,212,425
|
| Non-PEO NEO Average Compensation Actually Paid Amount |
$ 2,127,847
|
(573,947)
|
7,306,108
|
3,191,053
|
3,158,776
|
| Adjustment to Non-PEO NEO Compensation Footnote |
For each of 2025, 2024, 2023, 2022, and 2021, the values included in this column for the compensation actually paid to our CEO and the average compensation actually paid to our non-CEO Named Executive Officers have been calculated in accordance with Item 402(v) of Regulation S-K and do not reflect compensation actually earned, realized, or received by the CEO or other Named Executive Officers. These amounts reflect the Summary Compensation Table Total with certain adjustments in accordance with Item 402(v) of Regulation S-K as described in the tables below. | | | | | | | | | | | | | | | | | | | | Average for Non-CEO NEOs | | 2021 | 2022 | 2023 | 2024 | 2025 | | Average SCT Total for Non-CEO NEOs | | $ | 2,212,425 | | $ | 3,233,865 | | $ | 3,991,384 | | $ | 2,358,193 | | $ | 3,310,194 | | | Equity values reported in SCT | | (1,112,583) | | (1,892,846) | | (2,464,121) | | (1,393,010) | | (2,361,155) | | | | | | | | | | Fair value of equity compensation granted in current year - value at year end | | 1,251,910 | | 1,957,516 | | 4,074,844 | | 1,004,538 | | 1,761,724 | | | | | | | | | | Awards made in prior fiscal years that were unvested at the end of the current fiscal year, add/subtract change in fair value from end of prior fiscal year to end of current fiscal year | | 596,432 | | (55,134) | | 1,323,977 | | (883,107) | | (573,287) | | | Awards made in prior fiscal years that vested during current fiscal year, add/subtract change in fair value from end of prior fiscal year to vesting date | | 210,592 | | (52,348) | | 380,024 | | 104,356 | | 72,201 | | Awards made in prior fiscal years that were forfeited during current fiscal years, subtract fair value of forfeited awards determined at the end of prior year | | $ | — | | $ | — | | $ | — | | $ | (1,764,917) | | $ | (81,830) | | | Average Compensation Actually Paid to Non-CEO NEOs | | $ | 3,158,776 | | $ | 3,191,053 | | $ | 7,306,108 | | $ | (573,947) | | $ | 2,127,847 | |
|
|
|
|
|
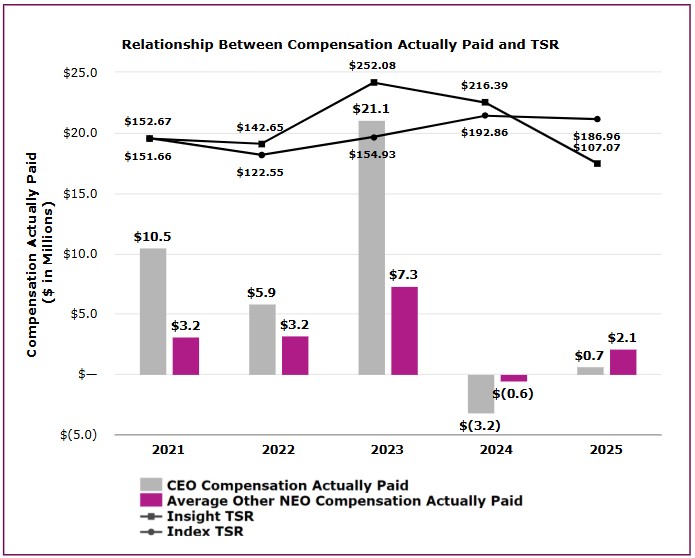
| Compensation Actually Paid vs. Total Shareholder Return |
Description of Relationship Between CEO and Non-CEO Named Executive Officers Compensation Actually Paid and Insight TSR, and Comparison of Insight TSR and Peer Group TSR The following chart sets forth the relationship between Compensation Actually Paid to our CEO, the average of Compensation Actually Paid to our non-CEO Named Executive Officers, and the Company’s cumulative TSR over the five most recently completed fiscal years. The following chart also sets forth a comparison of the Company’s cumulative TSR and cumulative Peer Group TSR.
|
|
|
|
|
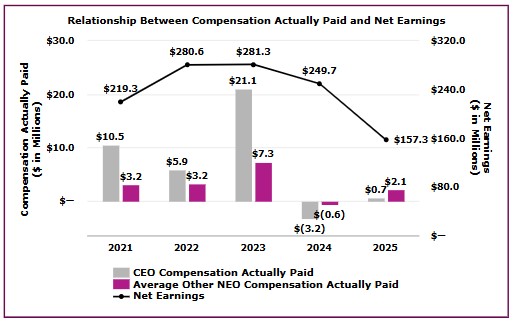
| Compensation Actually Paid vs. Net Income |
Description of Relationship Between CEO and Non-CEO Named Executive Officers Compensation Actually Paid and Net Earnings
The following chart sets forth the relationship between Compensation Actually Paid to our CEO, the average of Compensation Actually Paid to our non-CEO Named Executive Officers and our Net Earnings during the five most recently completed fiscal years.
|
|
|
|
|
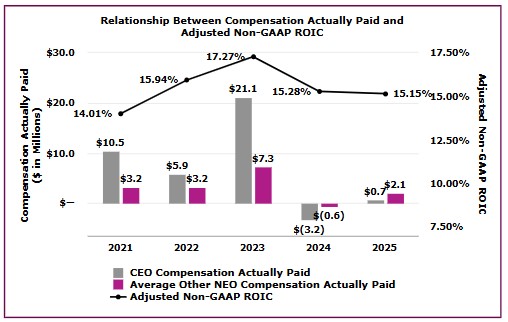
| Compensation Actually Paid vs. Company Selected Measure |
Description of Relationship Between CEO and Non-CEO Named Executive Officers Compensation Actually Paid and Adjusted Non-GAAP ROIC The following chart sets forth the relationship between Compensation Actually Paid to our CEO, the average of Compensation Actually Paid to our non-CEO Named Executive Officers, and the Company selected financial measure - Adjusted non-GAAP ROIC over the five most recently completed fiscal years.
|
|
|
|
|
| Total Shareholder Return Vs Peer Group |
Description of Relationship Between CEO and Non-CEO Named Executive Officers Compensation Actually Paid and Insight TSR, and Comparison of Insight TSR and Peer Group TSR The following chart sets forth the relationship between Compensation Actually Paid to our CEO, the average of Compensation Actually Paid to our non-CEO Named Executive Officers, and the Company’s cumulative TSR over the five most recently completed fiscal years. The following chart also sets forth a comparison of the Company’s cumulative TSR and cumulative Peer Group TSR.
|
|
|
|
|
| Tabular List, Table |
| | | | Performance Measures | | Adjusted Non-GAAP ROIC from Adjusted Non-GAAP EFO | | Adjusted Non-GAAP EFO | Cloud and Core Services GP |
|
|
|
|
|
| Total Shareholder Return Amount |
$ 107.07
|
216.39
|
252.08
|
142.65
|
151.66
|
| Peer Group Total Shareholder Return Amount |
186.96
|
192.86
|
154.93
|
122.55
|
152.67
|
| Net Income (Loss) |
$ 157,347,000
|
$ 249,691,000
|
$ 281,309,000
|
$ 280,608,000
|
$ 219,345,000
|
| Company Selected Measure Amount |
0.1515
|
0.1528
|
0.1727
|
0.1594
|
0.1401
|
| PEO Name |
1.Joyce A. Mullen
|
1.Joyce A. Mullen
|
1.Joyce A. Mullen
|
1.Joyce A. Mullen
|
Kenneth T. Lamneck
|
| Additional 402(v) Disclosure |
As required by Section 953(a) of the Dodd-Frank Wall Street Reform and Consumer Protection Act, and Item 402(v) of Regulation S-K, we are providing the following information about the relationship between “compensation actually paid” to our President and CEO and to our non-CEO Named Executive Officers and certain financial performance of the Company. Compensation actually paid, as determined under SEC requirements, does not reflect the actual amount of compensation earned by or paid to our Named Executive Officers during a covered year. For further information concerning the Company’s pay-for-performance philosophy and how the Company aligns executive compensation with the Company’s performance, refer to the Compensation Discussion and Analysis. Tabular List The following table presents the financial performance measures that the Company considers having been the most important in linking compensation actually paid to our CEO and non-CEO Named Executive Officers during 2025 to Company performance.
|
|
|
|
|
| Measure:: 1 |
|
|
|
|
|
| Pay vs Performance Disclosure |
|
|
|
|
|
| Name |
Adjusted Non-GAAP ROIC from Adjusted Non-GAAP EFO
|
|
|
|
|
| Non-GAAP Measure Description |
Please see Appendix A for Adjusted non-GAAP ROIC from Adjusted consolidated EFO calculation. In 2021, the Adjusted non-GAAP EFO used in the Adjusted non-GAAP ROIC calculation did not exclude amortization of intangible assets of $32.0 million.
|
|
|
|
|
| Measure:: 2 |
|
|
|
|
|
| Pay vs Performance Disclosure |
|
|
|
|
|
| Name |
Adjusted Non-GAAP EFO
|
|
|
|
|
| Measure:: 3 |
|
|
|
|
|
| Pay vs Performance Disclosure |
|
|
|
|
|
| Name |
Cloud and Core Services GP
|
|
|
|
|
| Kennet T. Lamneck [Member] |
|
|
|
|
|
| Pay vs Performance Disclosure |
|
|
|
|
|
| PEO Total Compensation Amount |
|
|
|
|
$ 6,638,325
|
| PEO Actually Paid Compensation Amount |
|
|
|
|
10,466,880
|
| Joyce A. Mullen [Member] |
|
|
|
|
|
| Pay vs Performance Disclosure |
|
|
|
|
|
| PEO Total Compensation Amount |
$ 10,498,947
|
$ 8,658,843
|
$ 10,693,722
|
$ 6,217,650
|
|
| PEO Actually Paid Compensation Amount |
684,103
|
(3,178,281)
|
21,050,619
|
5,877,012
|
|
| PEO | Kennet T. Lamneck [Member] | Aggregate Grant Date Fair Value of Equity Award Amounts Reported in Summary Compensation Table |
|
|
|
|
|
| Pay vs Performance Disclosure |
|
|
|
|
|
| Adjustment to Compensation, Amount |
|
|
|
|
(3,750,037)
|
| PEO | Kennet T. Lamneck [Member] | Year-end Fair Value of Equity Awards Granted in Covered Year that are Outstanding and Unvested |
|
|
|
|
|
| Pay vs Performance Disclosure |
|
|
|
|
|
| Adjustment to Compensation, Amount |
|
|
|
|
4,424,646
|
| PEO | Kennet T. Lamneck [Member] | Year-over-Year Change in Fair Value of Equity Awards Granted in Prior Years That are Outstanding and Unvested |
|
|
|
|
|
| Pay vs Performance Disclosure |
|
|
|
|
|
| Adjustment to Compensation, Amount |
|
|
|
|
2,555,090
|
| PEO | Kennet T. Lamneck [Member] | Change in Fair Value as of Vesting Date of Prior Year Equity Awards Vested in Covered Year |
|
|
|
|
|
| Pay vs Performance Disclosure |
|
|
|
|
|
| Adjustment to Compensation, Amount |
|
|
|
|
598,856
|
| PEO | Kennet T. Lamneck [Member] | Prior Year End Fair Value of Equity Awards Granted in Any Prior Year that Fail to Meet Applicable Vesting Conditions During Covered Year |
|
|
|
|
|
| Pay vs Performance Disclosure |
|
|
|
|
|
| Adjustment to Compensation, Amount |
|
|
|
|
0
|
| PEO | Joyce A. Mullen [Member] | Aggregate Grant Date Fair Value of Equity Award Amounts Reported in Summary Compensation Table |
|
|
|
|
|
| Pay vs Performance Disclosure |
|
|
|
|
|
| Adjustment to Compensation, Amount |
(8,085,326)
|
(6,902,996)
|
(8,218,464)
|
(3,258,530)
|
|
| PEO | Joyce A. Mullen [Member] | Year-end Fair Value of Equity Awards Granted in Covered Year that are Outstanding and Unvested |
|
|
|
|
|
| Pay vs Performance Disclosure |
|
|
|
|
|
| Adjustment to Compensation, Amount |
2,926,292
|
5,026,258
|
14,035,476
|
3,259,344
|
|
| PEO | Joyce A. Mullen [Member] | Year-over-Year Change in Fair Value of Equity Awards Granted in Prior Years That are Outstanding and Unvested |
|
|
|
|
|
| Pay vs Performance Disclosure |
|
|
|
|
|
| Adjustment to Compensation, Amount |
(4,944,130)
|
(2,840,216)
|
3,436,806
|
(187,001)
|
|
| PEO | Joyce A. Mullen [Member] | Change in Fair Value as of Vesting Date of Prior Year Equity Awards Vested in Covered Year |
|
|
|
|
|
| Pay vs Performance Disclosure |
|
|
|
|
|
| Adjustment to Compensation, Amount |
288,320
|
89,223
|
1,103,079
|
(154,451)
|
|
| PEO | Joyce A. Mullen [Member] | Prior Year End Fair Value of Equity Awards Granted in Any Prior Year that Fail to Meet Applicable Vesting Conditions During Covered Year |
|
|
|
|
|
| Pay vs Performance Disclosure |
|
|
|
|
|
| Adjustment to Compensation, Amount |
0
|
(7,209,393)
|
0
|
0
|
|
| Non-PEO NEO | Aggregate Grant Date Fair Value of Equity Award Amounts Reported in Summary Compensation Table |
|
|
|
|
|
| Pay vs Performance Disclosure |
|
|
|
|
|
| Adjustment to Compensation, Amount |
(2,361,155)
|
(1,393,010)
|
(2,464,121)
|
(1,892,846)
|
(1,112,583)
|
| Non-PEO NEO | Year-end Fair Value of Equity Awards Granted in Covered Year that are Outstanding and Unvested |
|
|
|
|
|
| Pay vs Performance Disclosure |
|
|
|
|
|
| Adjustment to Compensation, Amount |
1,761,724
|
1,004,538
|
4,074,844
|
1,957,516
|
1,251,910
|
| Non-PEO NEO | Year-over-Year Change in Fair Value of Equity Awards Granted in Prior Years That are Outstanding and Unvested |
|
|
|
|
|
| Pay vs Performance Disclosure |
|
|
|
|
|
| Adjustment to Compensation, Amount |
(573,287)
|
(883,107)
|
1,323,977
|
(55,134)
|
596,432
|
| Non-PEO NEO | Change in Fair Value as of Vesting Date of Prior Year Equity Awards Vested in Covered Year |
|
|
|
|
|
| Pay vs Performance Disclosure |
|
|
|
|
|
| Adjustment to Compensation, Amount |
72,201
|
104,356
|
380,024
|
(52,348)
|
210,592
|
| Non-PEO NEO | Prior Year End Fair Value of Equity Awards Granted in Any Prior Year that Fail to Meet Applicable Vesting Conditions During Covered Year |
|
|
|
|
|
| Pay vs Performance Disclosure |
|
|
|
|
|
| Adjustment to Compensation, Amount |
$ (81,830)
|
$ (1,764,917)
|
$ 0
|
$ 0
|
$ 0
|