v3.26.1
Pay vs Performance Disclosure - USD ($)
12 Months Ended
Dec. 31, 2025
Dec. 31, 2024
Dec. 31, 2023
Dec. 31, 2022
Dec. 31, 2021
Pay vs Performance Disclosure          
Pay vs Performance Disclosure, Table

Pay Versus Performance (PVP)3

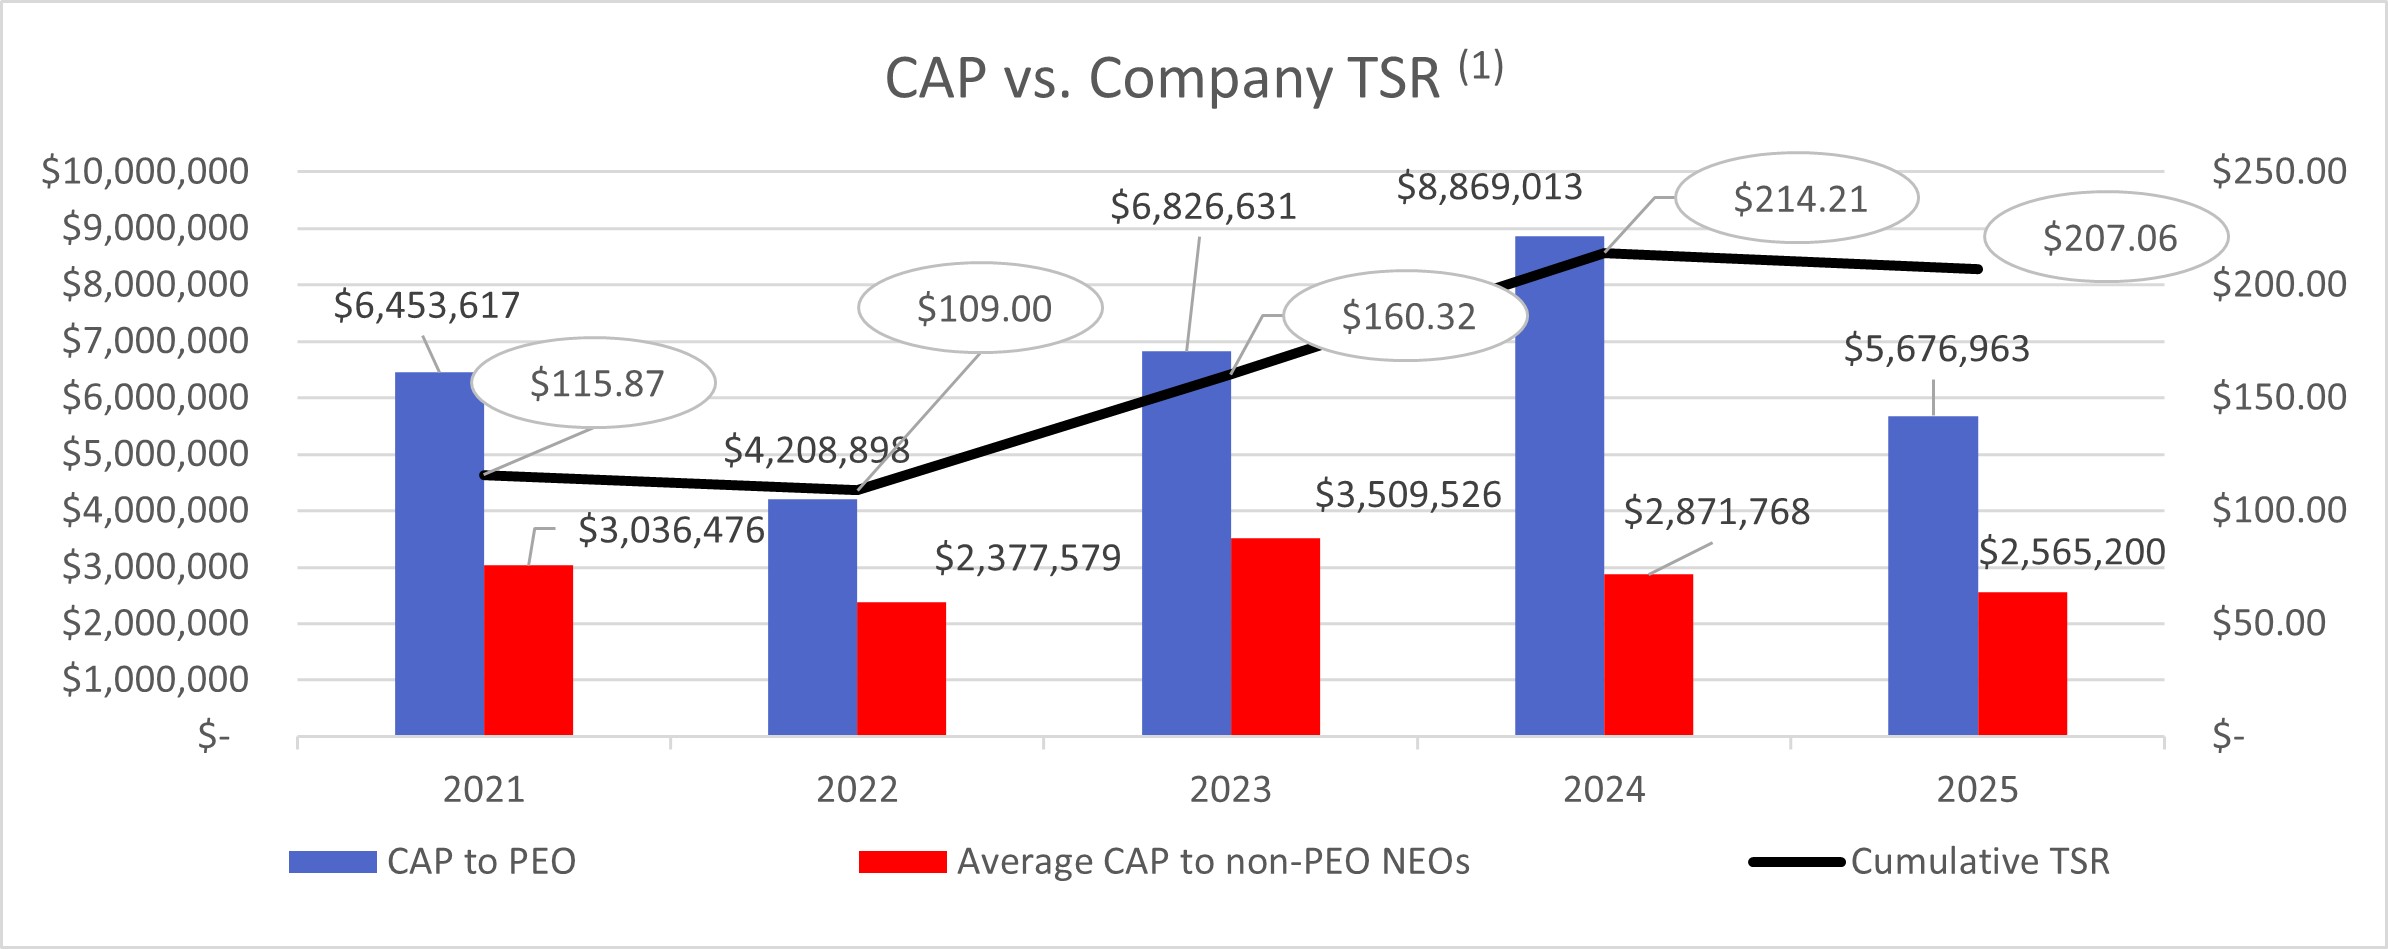
The following table is required by the SEC and shows, for the years presented: (i) the total compensation for our Chief Executive Officer (who is our Principal Executive Officer (“PEO”)) and the average total compensation for our other named executive officers, with total compensation in each case as reported in Column J of the Summary Compensation Table located under “— Compensation Tables – Summary Compensation Table” (the “SCT Total”); and (ii) a calculated Compensation Actually Paid (“CAP”) value. The table also shows TSR for the Company and the S&P 500 Insurance Index, net income and a Company-selected financial performance measure of adjusted net operating income. See “Reconciliation of GAAP and Non-GAAP Financial Measures” in Exhibit A to this Proxy Statement for a reconciliation of net income to adjusted net operating income.


Summary


Average
Summary
Compensation
Table (SCT)


Average
Compensation
Actually Paid


Value of Initial Fixed
$100 Investment Based On:


Year

Compensation
Table (SCT) Total
for PEO ($)
 (1)


Compensation
Actually Paid
to PEO ($)
(2)(3)


Total for Non-
PEO Named
Executive
Officers ($)
 (4)


(CAP) to Non-
PEO Named
Executive
Officers ($)
 (2)(4)(5)


Cumulative
Company
TSR ($)
 (6)


Cumulative
Peer Group
TSR ($)
(6)(7)


Net Income
($)
(8) (9)


Adjusted Net
Operating
Income
 (8) (9)


(A)

(B)


(C)


(D)


(E)


(F)


(G)


(H)


(I)


2025

$

5,638,658


$

5,676,963


$

3,305,026


$

2,565,200


$

207.06


$

209.86


$

751.2


$

751.4


2024

$

7,190,309


$

8,869,013


$

2,393,458


$

2,871,768


$

214.21


$

201.62


$

470.5


$

680.9


2023

$

4,179,560


$

6,826,631


$

2,272,719


$

3,509,526


$

160.32


$

158.98


$

576.6


$

596.0


2022

$

4,793,457


$

4,208,898


$

2,606,419


$

2,377,579


$

109.00


$

145.50


$

467.0


$

536.9


2021

$

5,055,625


$

6,453,617


$

2,449,063


$

3,036,476


$

115.87


$

132.12


$

476.0


$

566.2


(1)
For all fiscal years presented, the PEO was Glenn J. Williams, our Chief Executive Officer.
(2)
We did not report a change in pension value for any of the years presented; therefore, no deduction from the SCT Total was made with respect to pension plan value. In addition, all dividends paid are reflected in the SCT Total.
(3)
To calculate the CAP to our PEO, the amounts set forth in the table below were deducted from or added to the SCT Total as indicated. During the years presented: (a) our PEO did not participate in a pension plan; and (b) no options were granted, no awards granted in a prior fiscal year were forfeited in the covered fiscal year, no equity awards were granted and vested in the same fiscal year, and no equity awards failed to meet vesting conditions in the year.


3 The material in this Pay Versus Performance (PVP) section shall not be deemed incorporated by reference by any general statement incorporating by reference this Proxy Statement or any portion hereof into any filing under the Securities Act or the Exchange Act, except to the extent that the Company specifically incorporates this information by reference, and shall not otherwise be deemed filed under such acts.


Reconciliation of PEO SCT Total to CAP:


Year

Summary
Compensation
Table (SCT) Total


DEDUCT Grant
Date Fair Value
of Equity Awards
Granted in the
Year as Reported
in Summary
Compensation
Table


ADD Year End
Fair Value of
Equity Awards
Granted in the
Year that are
Unvested as of
Year End
(i)


ADD Year over
Year Change in
Fair Value of
Equity Awards
Granted in
Prior Years
that are
Unvested as of
Year End
(i)


ADD Year over
Year Change in
Fair Value of
Equity Awards
Granted in
Prior Years
that Vested in
the Year
 (ii)


Total Adjustments


CAP


(a)


(b)


(c)


(d)


(e)


(f) = (b) + (c) + (d) + (e)


(a) + (f)


2025

$

5,638,658


$

(2,749,907

)

$

2,500,408


$

(316,601

)

$

604,405


$

38,305


$

5,676,963


2024

$

7,190,309


$

(4,699,536

)

$

4,836,976


$

1,459,753


$

81,511


$

1,678,704


$

8,869,013


2023

$

4,179,560


$

(2,199,910

)

$

2,443,606


$

1,762,634


$

640,741


$

2,647,071


$

6,826,631


2022

$

4,793,457


$

(2,749,851

)

$

2,992,969


$

(330,241

)

$

(497,436

)

$

(584,559

)

$

4,208,898


2021

$

5,055,625


$

(2,749,801

)

$

2,946,462


$

675,179


$

526,152


$

1,397,992


$

6,453,617


(i)
Column (c) and (d) amounts are based on the closing price per share of our common stock as set forth below.


December 31, 2025

$258.36

December 31, 2024

$271.42

December 31, 2023

$205.76

December 31, 2022

$141.82

December 31, 2021

$153.27


(ii)
Column (e) amounts are based on the closing price per share of our common stock on the vesting dates as set forth below. For PSUs, reflects the actual number of shares paid out upon vesting as set forth below (which is between 0% and 150% of the number of PSUs granted).


Closing Price

PSU Payout Percentage

March 1, 2025

$290.00

109.1%

March 1, 2024

$245.26

70.5%

March 1, 2023

$185.24

79.9%

March 1, 2022

$124.42

109.7%

March 1, 2021

$146.66

109.9%


(4)
For 2025, our non-PEO NEOs consisted of Peter W. Schneider and Tracy X. Tan. For 2024, our non-PEO NEOs consisted of Mr. Schneider, Ms.. Tan and Gregory C. Pitts (our former Chief Operating Officer). For 2023, our non-PEO named executive officers consisted of Mr. Schneider, Ms. Tan, Alison S. Rand (our former Chief Financial Officer) and Mr. Pitts. For 2022 and 2021, our non-PEO named executive officers consisted of Mr. Schneider, Ms. Rand and Mr. Pitts. Because Ms. Tan was not an employee for all of 2023, her inclusion in the calculation of average compensation for non-PEO named executive officers lowers the value from what it would have been if she had been employed throughout 2023.
(5)
To calculate CAP to our named executive officers other than our PEO, the amounts set forth in the table below were deducted from or added to the SCT Total as indicated. During the years presented, no options were granted, no awards granted in a prior fiscal year were forfeited in the covered fiscal year, no equity awards were granted and vested in the same fiscal year, and no equity awards failed to meet vesting conditions in the year.


Reconciliation of Average Non-PEO NEOs SCT Total to CAP:


Year

Summary
Compensation
Table (SCT)
Total


DEDUCT Aggregate Change in Actuarial Present Value of Defined Benefit and Actuarial Pension Plans (i)


DEDUCT Grant Date Fair Value of Equity Awards Granted in the Year as Reported in Summary Compensation Table


ADD Year End Fair Value of Equity Awards Granted in the Year that are Unvested as of Year End (ii)


ADD Year over Year Change in Fair Value of Equity Awards Granted in Prior Years that are Unvested as of Year End (ii)


ADD Year over Year Change in Fair Value of Equity Awards Granted in Prior Years that Vested in the Year (iii)


Total Adjustments


CAP


(a)


(b)


(c)


(d)


(e)


(f)


(g) = (b) + (c) + (d) + (e) + (f)


(a) + (g)


2025

$

3,305,026


$

-


$

(1,549,700

)

$

704,548


$

(102,227

)

$

207,553


$

(739,825

)

$

2,565,200


2024

$

2,393,458


$

-


$

(1,316,529

)

$

1,094,365


$

649,574


$

50,899


$

478,310


$

2,871,768


2023

$

2,272,719


$

-


$

(1,099,930

)

$

1,214,961


$

836,335


$

285,441


$

1,236,807


$

3,509,526


2022

$

2,606,419


$

-


$

(1,383,178

)

$

1,505,467


$

(140,095

)

$

(211,034

)

$

(228,840

)

$

2,377,579


2021

$

2,449,063


$

(408

)

$

(1,166,539

)

$

1,249,968


$

286,393


$

217,998


$

587,413


$

3,036,476


(i)
Mr. Schneider, one of our non-PEO named executive officers, participated in a predecessor's pension plan during 2021. There was no service rendered or plan amendments during the years presented and, therefore, no pension values are added back in the reconciliation of the SCT Total to the CAP.
(i)
Column (d) and (e) amounts are based on the closing price per share of our common stock as set forth below.


December 31, 2025

$258.36

December 31, 2024

$271.42

December 31, 2023

$205.76

December 31, 2022

$141.82

December 31, 2021

$153.27


(ii)
Column (f) amounts are based on the closing price per share of our common stock on the vesting dates as set forth below. For PSUs, reflects the actual number of shares paid out upon vesting as set forth below (which is between 0% and 150% of the number of PSUs granted).


Closing Price

PSU Payout Percentage

March 1, 2025

$290.00

109.1%

March 1, 2024

$245.26

70.5%

March 1, 2023

$185.24

79.9%

March 1, 2022

$124.42

109.7%

March 1, 2021

$146.66

109.9%


(6)
TSR for 2021 is for that year only, TSR for 2022 is a two-year return from January 1, 2021 through December 31, 2022, TSR for 2023 is a three-year return from January 1, 2021 through December 31, 2023, TSR for 2024 is a four-year return from January 1, 2021 through December 31, 2024 and TSR for 2025 is a five-year return from January 1, 2021 through December 31, 2025.
(7)
Represents the S&P 500 Insurance Index, as used in the Total Stockholder Return graph included under “— Compensation Disclosure and Analysis (CD&A) – Total Stockholder Return.”
(8)
In fiscal 2024, net income was reduced by a loss from discontinued operations of $249.6 million, most of which was driven by one-time charges associated with the Company's disposal of the Senior Health business. Operating results for fiscal 2023 have been restated from the 2024 Proxy Statement to exclude the results of the Senior Health business, which has been reported as a discontinued operation. Refer to the 2024 Annual Report for a definition of the Senior Health business. Operating results for fiscal 2022 and fiscal 2021 have not been restated from the 2024 Proxy Statement so they still include the results of the Senior Health business, which was acquired on July 1, 2021 and disposed of on September 30, 2024. Fiscal 2022 and fiscal 2021, values were updated from originally published amounts to reflect the application of a new accounting standard relating to the accounting for long-duration contracts, referred to as LDTI.
(9)
The Compensation Committee has selected adjusted net operating income as the most important financial measure that relates to executive pay for fiscal 2025. This measure, which is a non-GAAP financial measure, is a performance metric under the Company's short-term incentive plan. Further, it is the basis for the operating EPS growth metric under the Company's long-term incentive plan. Finally, adjusted net operating income is the numerator to the calculation of operating ROAE, which is a performance metric in both the short-term incentive plan and the long-term incentive plan. See “Reconciliation of GAAP and Non-GAAP Financial Measures” in Exhibit A to this Proxy Statement for a reconciliation of net income to adjusted net operating income.
       
Company Selected Measure Name adjusted net operating income        
Named Executive Officers, Footnote
(4)
For 2025, our non-PEO NEOs consisted of Peter W. Schneider and Tracy X. Tan. For 2024, our non-PEO NEOs consisted of Mr. Schneider, Ms.. Tan and Gregory C. Pitts (our former Chief Operating Officer). For 2023, our non-PEO named executive officers consisted of Mr. Schneider, Ms. Tan, Alison S. Rand (our former Chief Financial Officer) and Mr. Pitts. For 2022 and 2021, our non-PEO named executive officers consisted of Mr. Schneider, Ms. Rand and Mr. Pitts. Because Ms. Tan was not an employee for all of 2023, her inclusion in the calculation of average compensation for non-PEO named executive officers lowers the value from what it would have been if she had been employed throughout 2023.
       
Peer Group Issuers, Footnote
(7)
Represents the S&P 500 Insurance Index, as used in the Total Stockholder Return graph included under “— Compensation Disclosure and Analysis (CD&A) – Total Stockholder Return.”
       
PEO Total Compensation Amount $ 5,638,658 $ 7,190,309 $ 4,179,560 $ 4,793,457 $ 5,055,625
PEO Actually Paid Compensation Amount $ 5,676,963 8,869,013 6,826,631 4,208,898 6,453,617
Adjustment To PEO Compensation, Footnote

Reconciliation of PEO SCT Total to CAP:


Year

Summary
Compensation
Table (SCT) Total


DEDUCT Grant
Date Fair Value
of Equity Awards
Granted in the
Year as Reported
in Summary
Compensation
Table


ADD Year End
Fair Value of
Equity Awards
Granted in the
Year that are
Unvested as of
Year End
(i)


ADD Year over
Year Change in
Fair Value of
Equity Awards
Granted in
Prior Years
that are
Unvested as of
Year End
(i)


ADD Year over
Year Change in
Fair Value of
Equity Awards
Granted in
Prior Years
that Vested in
the Year
 (ii)


Total Adjustments


CAP


(a)


(b)


(c)


(d)


(e)


(f) = (b) + (c) + (d) + (e)


(a) + (f)


2025

$

5,638,658


$

(2,749,907

)

$

2,500,408


$

(316,601

)

$

604,405


$

38,305


$

5,676,963


2024

$

7,190,309


$

(4,699,536

)

$

4,836,976


$

1,459,753


$

81,511


$

1,678,704


$

8,869,013


2023

$

4,179,560


$

(2,199,910

)

$

2,443,606


$

1,762,634


$

640,741


$

2,647,071


$

6,826,631


2022

$

4,793,457


$

(2,749,851

)

$

2,992,969


$

(330,241

)

$

(497,436

)

$

(584,559

)

$

4,208,898


2021

$

5,055,625


$

(2,749,801

)

$

2,946,462


$

675,179


$

526,152


$

1,397,992


$

6,453,617


Non-PEO NEO Average Total Compensation Amount $ 3,305,026 2,393,458 2,272,719 2,606,419 2,449,063
Non-PEO NEO Average Compensation Actually Paid Amount $ 2,565,200 2,871,768 3,509,526 2,377,579 3,036,476
Adjustment to Non-PEO NEO Compensation Footnote

Reconciliation of Average Non-PEO NEOs SCT Total to CAP:


Year

Summary
Compensation
Table (SCT)
Total


DEDUCT Aggregate Change in Actuarial Present Value of Defined Benefit and Actuarial Pension Plans (i)


DEDUCT Grant Date Fair Value of Equity Awards Granted in the Year as Reported in Summary Compensation Table


ADD Year End Fair Value of Equity Awards Granted in the Year that are Unvested as of Year End (ii)


ADD Year over Year Change in Fair Value of Equity Awards Granted in Prior Years that are Unvested as of Year End (ii)


ADD Year over Year Change in Fair Value of Equity Awards Granted in Prior Years that Vested in the Year (iii)


Total Adjustments


CAP


(a)


(b)


(c)


(d)


(e)


(f)


(g) = (b) + (c) + (d) + (e) + (f)


(a) + (g)


2025

$

3,305,026


$

-


$

(1,549,700

)

$

704,548


$

(102,227

)

$

207,553


$

(739,825

)

$

2,565,200


2024

$

2,393,458


$

-


$

(1,316,529

)

$

1,094,365


$

649,574


$

50,899


$

478,310


$

2,871,768


2023

$

2,272,719


$

-


$

(1,099,930

)

$

1,214,961


$

836,335


$

285,441


$

1,236,807


$

3,509,526


2022

$

2,606,419


$

-


$

(1,383,178

)

$

1,505,467


$

(140,095

)

$

(211,034

)

$

(228,840

)

$

2,377,579


2021

$

2,449,063


$

(408

)

$

(1,166,539

)

$

1,249,968


$

286,393


$

217,998


$

587,413


$

3,036,476


Compensation Actually Paid vs. Total Shareholder Return

img156862050_135.jpg

       
Compensation Actually Paid vs. Net Income

img156862050_137.gif

       
Compensation Actually Paid vs. Company Selected Measure

img156862050_138.gif

       
Total Shareholder Return Vs Peer Group

img156862050_136.gif

       
Tabular List, Table

Most Important Performance Measures

The six items listed below represent the most important performance metrics used to determine CAP for fiscal 2025 as further described in our Compensation Committee Message beginning on page 45. All of these items are described under “— Compensation Discussion and Analysis (CD&A)”. The measures are listed below in no particular order. See “Reconciliation of GAAP and Non-GAAP Financial Measures” in Exhibit A to this Proxy Statement for a reconciliation of these performance measures to GAAP results.

Adjusted Operating Revenues
Adjusted Net Operating Income
ROAE
Size of the Life-Licensed Sales Force
Average ROAE
Average Adjusted Annual EPS Growth
       
Total Shareholder Return Amount $ 207.06 214.21 160.32 109 115.87
Peer Group Total Shareholder Return Amount 209.86 201.62 158.98 145.5 132.12
Net Income (Loss) $ 751,200,000 $ 470,500,000 $ 576,600,000 $ 467,000,000 $ 476,000,000
Company Selected Measure Amount 751,400,000 680,900,000 596,000,000 536,900,000 566,200,000
PEO Name Glenn J. Williams        
Measure:: 1          
Pay vs Performance Disclosure          
Name Adjusted Operating Revenues        
Measure:: 2          
Pay vs Performance Disclosure          
Name Adjusted Net Operating Income        
Non-GAAP Measure Description
(9)
The Compensation Committee has selected adjusted net operating income as the most important financial measure that relates to executive pay for fiscal 2025. This measure, which is a non-GAAP financial measure, is a performance metric under the Company's short-term incentive plan. Further, it is the basis for the operating EPS growth metric under the Company's long-term incentive plan. Finally, adjusted net operating income is the numerator to the calculation of operating ROAE, which is a performance metric in both the short-term incentive plan and the long-term incentive plan. See “Reconciliation of GAAP and Non-GAAP Financial Measures” in Exhibit A to this Proxy Statement for a reconciliation of net income to adjusted net operating income.
       
Measure:: 3          
Pay vs Performance Disclosure          
Name ROAE        
Measure:: 4          
Pay vs Performance Disclosure          
Name Size of the Life-Licensed Sales Force        
Measure:: 5          
Pay vs Performance Disclosure          
Name Average ROAE        
Measure:: 6          
Pay vs Performance Disclosure          
Name Average Adjusted Annual EPS Growth        
PEO | Equity Awards Adjustments          
Pay vs Performance Disclosure          
Adjustment to Compensation, Amount $ 38,305 $ 1,678,704 $ 2,647,071 $ (584,559) $ 1,397,992
PEO | Aggregate Grant Date Fair Value of Equity Award Amounts Reported in Summary Compensation Table          
Pay vs Performance Disclosure          
Adjustment to Compensation, Amount (2,749,907) (4,699,536) (2,199,910) (2,749,851) (2,749,801)
PEO | Year-end Fair Value of Equity Awards Granted in Covered Year that are Outstanding and Unvested          
Pay vs Performance Disclosure          
Adjustment to Compensation, Amount 2,500,408 4,836,976 2,443,606 2,992,969 2,946,462
PEO | Year-over-Year Change in Fair Value of Equity Awards Granted in Prior Years That are Outstanding and Unvested          
Pay vs Performance Disclosure          
Adjustment to Compensation, Amount (316,601) 1,459,753 1,762,634 (330,241) 675,179
PEO | Change in Fair Value as of Vesting Date of Prior Year Equity Awards Vested in Covered Year          
Pay vs Performance Disclosure          
Adjustment to Compensation, Amount 604,405 81,511 640,741 (497,436) 526,152
Non-PEO NEO | Aggregate Change in Present Value of Accumulated Benefit for All Pension Plans Reported in Summary Compensation Table          
Pay vs Performance Disclosure          
Adjustment to Compensation, Amount         (408)
Non-PEO NEO | Equity Awards Adjustments          
Pay vs Performance Disclosure          
Adjustment to Compensation, Amount (739,825) 478,310 1,236,807 (228,840) 587,413
Non-PEO NEO | Aggregate Grant Date Fair Value of Equity Award Amounts Reported in Summary Compensation Table          
Pay vs Performance Disclosure          
Adjustment to Compensation, Amount (1,549,700) (1,316,529) (1,099,930) (1,383,178) (1,166,539)
Non-PEO NEO | Year-end Fair Value of Equity Awards Granted in Covered Year that are Outstanding and Unvested          
Pay vs Performance Disclosure          
Adjustment to Compensation, Amount 704,548 1,094,365 1,214,961 1,505,467 1,249,968
Non-PEO NEO | Year-over-Year Change in Fair Value of Equity Awards Granted in Prior Years That are Outstanding and Unvested          
Pay vs Performance Disclosure          
Adjustment to Compensation, Amount (102,227) 649,574 836,335 (140,095) 286,393
Non-PEO NEO | Change in Fair Value as of Vesting Date of Prior Year Equity Awards Vested in Covered Year          
Pay vs Performance Disclosure          
Adjustment to Compensation, Amount $ 207,553 $ 50,899 $ 285,441 $ (211,034) $ 217,998