Pay vs Performance Disclosure - USD ($)
Dec. 31, 2025
Dec. 31, 2024
Dec. 31, 2023
Dec. 31, 2022
| Fiscal year | Summary compensation table total for PEO(1) ($) | Compensation actually paid to PEO(2) ($) | Average summary compensation table total for non-PEO NEOs(1)(3) ($) | Average compensation actually paid to non-PEO NEOs(2)(3) ($) | Value of initial fixed $100 investment based on: | Net income ($) | Net realized gains/(losses) for Principal Finance segment ($) | |||||||||||||||||||
| Total shareholder return ($) | Peer group total shareholder return(4) ($) | |||||||||||||||||||||||||
| 2025 | 11,424,139 | 11,251,405 | 4,816,589 | 4,524,079 | 71 | 109 | 72,188,000 | 157,744,000 | ||||||||||||||||||
| 2024 | 11,747,782 | 10,353,388 | 5,070,916 | 4,490,662 | 82 | 119 | 229,583,000 | 327,174,000 | ||||||||||||||||||
| 2023 | 11,727,836 | 19,336,976 | 4,914,556 | 6,793,242 | 193 | 105 | 718,199,000 | 187,376,000 | ||||||||||||||||||
| 2022 | 5,731,151 | 4,664,352 | 3,023,362 | 2,565,418 | 78 | 86 | 97,459,000 | 134,473,000 | ||||||||||||||||||
| Fiscal year | Summary compensation table total for PEO ($) | Deduct: Stock awards for PEO(i) ($) | Add: Year-end value of unvested equity awards granted during year for PEO(ii) ($) | Increase/(decrease) in value of unvested equity awards granted in prior years for PEO ($) | Add: Value of equity awards granted and vested during year for PEO ($) | Increase/(decrease) in value of equity awards granted in prior years which vested during year for PEO ($) | Deduct: Equity awards that failed to vest during year for PEO ($) | Add: Dividends for PEO ($) | Total (compensation actually paid to PEO) ($) | ||||||||||||||||||||
| 2025 | 11,424,139 | (3,176,660) | — | (491,474) | 3,238,181 | 257,219 | — | — | 11,251,405 | ||||||||||||||||||||
| 2024 | 11,747,782 | (3,333,443) | 2,879,269 | (1,039,608) | — | 99,389 | — | — | 10,353,388 | ||||||||||||||||||||
| 2023 | 11,727,836 | (1,458,625) | 6,099,134 | 3,144,257 | — | (175,626) | — | — | 19,336,976 | ||||||||||||||||||||
| 2022 | 5,731,151 | (1,821,722) | 1,600,970 | (846,047) | — | — | — | — | 4,664,352 | ||||||||||||||||||||
| Fiscal year | Summary compensation table total for non-PEO NEOs ($) | Deduct: Stock awards for non-PEO NEOs(i) ($) | Add: Year-end value of unvested equity awards granted during year for non-PEO NEOs(ii) ($) | Increase/(decrease) in value of unvested equity awards granted in prior years for non-PEO NEOs ($) | Add: Value of equity awards granted and vested during year for non-PEO NEOs ($) | Increase/(decrease) in value of equity awards granted in prior years which vested during year for non-PEO NEOs ($) | Deduct: Equity awards that failed to vest during year for non-PEO NEOs ($) | Add: Dividends for non-PEO NEOs ($) | Total (compensation actually paid to non-PEO NEOs) ($) | ||||||||||||||||||||
| 2025 | 4,816,589 | (1,046,789) | 152,172 | (251,157) | 847,117 | 6,147 | — | — | 4,524,079 | ||||||||||||||||||||
| 2024 | 5,070,916 | (1,047,307) | 913,703 | (479,393) | — | 32,742 | — | — | 4,490,662 | ||||||||||||||||||||
| 2023 | 4,914,556 | (679,112) | 1,428,254 | 1,255,409 | — | (125,865) | — | — | 6,793,242 | ||||||||||||||||||||
| 2022 | 3,023,362 | (767,192) | 733,575 | (406,844) | — | (17,484) | — | — | 2,565,418 | ||||||||||||||||||||
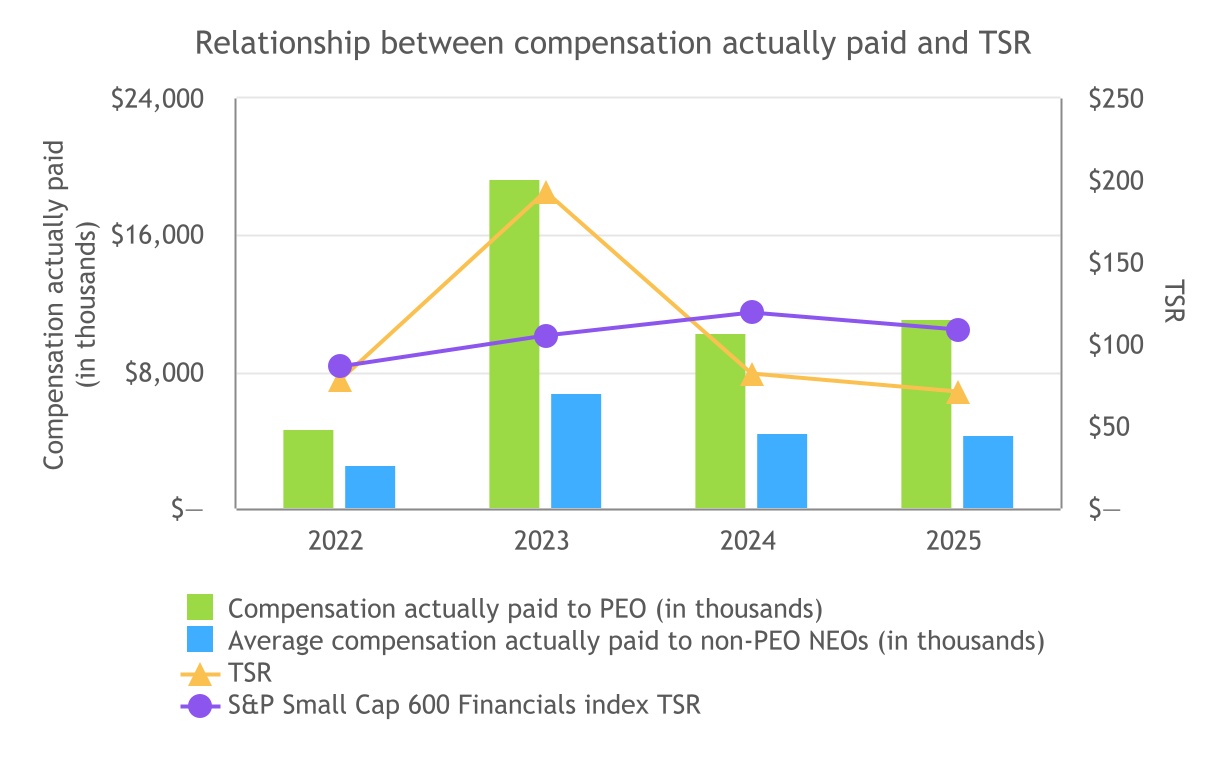
The graph below shows the relationship between the “compensation actually paid” to the PEO and the average of the “compensation actually paid” to the non-PEO Named Executive Officers (in each case, with “compensation actually paid” calculated as set forth above in accordance with Item 402(v) of Regulation S-K) during the 2025 fiscal year, the 2024 fiscal year, the 2023 fiscal year and the 2022 fiscal year and our cumulative TSR measured starting from December 31, 2021 for each covered fiscal year. The graph below also shows the relationship between our TSR performance and the TSR performance of the peer group in the “pay versus performance” table above (which is the S&P Small Cap 600 Financials index) over the same period.
Relationship between compensation actually paid and net income/(loss)
We are a finance and asset management company focused on the business of law and manage a portfolio of legal finance assets funded primarily by our balance sheet. The legal finance assets comprising our portfolio are Level 3 assets for purposes of determining their fair value, which we report on a quarterly basis. Quarterly fluctuations in the fair value of the legal finance assets drive our capital provision income/(loss), which is the primary source of our consolidated revenues. As a result, our net income/(loss) is subject to significant volatility from period to period resulting from a range of inputs to our fair value methodology, and any correlation between our net income/(loss) and executive compensation levels is coincidental.
In any given period, the “compensation actually paid” to the PEO and the non-PEO Named Executive Officers is more closely tied to (i) the net realized gains/(losses) generated by our portfolio, which are listed as Burford-selected financial performance measure in the “pay versus performance” table above, and (ii) the change in price of our ordinary shares.
To align the compensation of the PEO and the non-PEO Named Executive Officers with the performance of our legal finance portfolio, a significant portion of their respective total compensation is awarded as long-term incentive compensation, which is tied directly to the cash profits generated by our legal finance portfolio. While long-term incentive compensation is accrued in our consolidated financial statements based on fair value gains/(losses) resulting from the quarterly portfolio valuation process (i.e., capital provision income/(loss)), that compensation is only paid upon the realization of those fair value gains/(losses) and receipt of cash proceeds. Therefore, the payment of long-term incentive compensation is more closely related to the cash-based metric of net realized gains/(losses), and only when those realized gains have been definitively settled in cash.
In addition, the interests of the PEO and the non-PEO Named Executive Officers are highly aligned with those of our shareholders through their beneficial ownership of approximately 8.8% of our outstanding ordinary shares as of March 2, 2026, as well as through their significant outstanding share-based awards. See “Security ownership of certain beneficial owners and management—Beneficial ownership information” for additional information with respect to the
beneficial ownership of our ordinary shares by Messrs. Bogart and Molot and “Outstanding equity awards at fiscal year-end” and “Option exercises and stock vested” tables for additional information with respect to the outstanding share-based awards of Messrs. Bogart and Molot. As a result, the “compensation actually paid” to the PEO and the non-PEO Named Executive Officers, as calculated in accordance with Item 402(v) of Regulation S-K, is significantly driven by movements in our share price that occur after the grant date of such share-based awards.
Relationship between “compensation actually paid” and performance measures
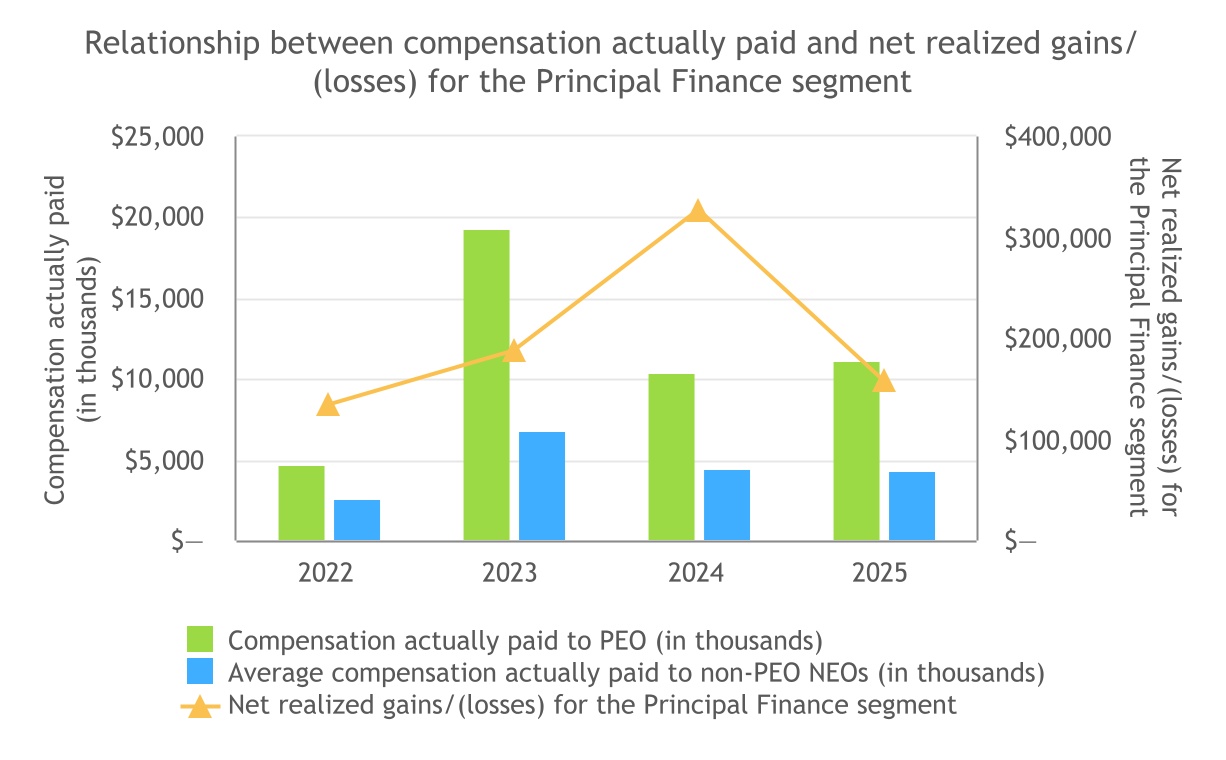
The graph below shows the relationship between the “compensation actually paid” to the PEO and the average of the “compensation actually paid” to the non-PEO Named Executive Officers (in each case, with “compensation actually paid” calculated as set forth above in accordance with Item 402(v) of Regulation S-K) during the 2025 fiscal year, the 2024 fiscal year, the 2023 fiscal year and the 2022 fiscal year and the net realized gains/(losses) for the Principal Finance segment over the same period. The portion of the “compensation actually paid” attributable to long-term incentive compensation may not always correlate with net realized gains/(losses) in a given year, because carried interest allocation is only paid once cash proceeds are received. In some cases, net realized gains/(losses) may be
recognized upon the definitive conclusion of an asset in one period, but the cash proceeds may not be received until the following period, being reflected as a due from settlement receivable in the interim. Nonetheless, net realized gains/(losses) remains the most directly relevant key metric in determining executive compensation in a given period.
| Performance measures | |||||
| Net realized gains/(losses) for the Principal Finance segment | |||||
| TSR | |||||
ii.Amounts in this column represent the respective share-based awards granted to the PEO and each of the non-PEO Named Executive Officers disclosed in the “Deduct: stock awards for PEO” and “Deduct: stock awards for non-PEO NEOs”, respectively, and corresponding footnote multiplied by the closing price of $8.92 per ordinary share on the NYSE on December 31, 2025, which was the last trading day for the 2025 fiscal year.