Pay versus Performance
The following table sets forth certain information with respect to the Company’s financial performance and the compensation paid to our NEOs for the fiscal years (“FY”) ended on December 31, 2025, December 31, 2024, December 31, 2023, December 31, 2022, and December 31, 2021, as required by SEC rules.
| | | | | | Value of Initial Fixed $100 | | | |||||||||||||||||
Investment Based on: | |||||||||||||||||||||||||
Average | |||||||||||||||||||||||||
Summary | Average | ||||||||||||||||||||||||
Summary | Compensation | Compensation | |||||||||||||||||||||||
Compensation | Compensation | Table Total for | Actually Paid | | Total | | Peer Total | | Net | Total | |||||||||||||||
Table Total for | Actually Paid to | Non-PEO | to Non-PEO | Shareholder | Shareholder | (Loss) | Adjusted | ||||||||||||||||||
PEO(1) | PEO(1)(2)(7) | NEOs(3) | NEOs(2)(3)(7) | Return(4) | Return(4) | Income | EBITDA(6) | ||||||||||||||||||
Year | | | ($) | | | ($) | | | ($) | | | ($) | | | ($) | | | ($) | | | ($mm)(5) | | | ($mm) | |
2025 | $11,157,809 | ($1,110,801) | $3,049,141 | ($29,338) | $10 | $111 | ($1,101) | $424 | |||||||||||||||||
2024 |
| 10,737,905 |
| 6,634,025 | 3,013,978 | 1,741,211 | 48 | 105 | (363) | 523 | |||||||||||||||
2023 |
| 8,389,910 |
| 2,434,260 |
| 3,274,168 |
| 2,596,315 |
| 71 |
| 99 |
| (41) |
| 526 | |||||||||
2022 |
| 6,245,259 |
| (20,486,138) |
| 2,782,307 |
| (1,231,650) |
| 72 |
| 94 |
| 22 |
| 544 | |||||||||
2021 |
| 7,680,578 |
| 42,840,278 |
| 3,378,068 |
| 7,915,780 |
| 161 |
| 121 |
| 222 |
| 571 | |||||||||
| (1) | The name of the Principal Executive Officer of the Company (“PEO”) reflected in these columns for each of the applicable fiscal years is Edward A. Pesicka. |
| (2) | In calculating the ‘compensation actually paid’ (“CAP”) amounts reflected in these columns, the fair value or change in fair value, as applicable, of the equity award adjustments included in such calculations was computed in accordance with FASB ASC Topic 718. The valuation assumptions used to calculate such fair values did not materially differ from those disclosed at the time of grant (except for changes due to the relevant measurement date). |
| (3) | The names of each of the non-PEO NEOs reflected in these columns for each applicable fiscal year are as follows: (i) for fiscal year 2025, Jonathan A. Leon, Andrew G. Long, Perry A. Bernocchi, and Heath H. Galloway; (ii) for fiscal year 2024, Mr. Leon, Mr. Long, Mr. Bernocchi, Mr. Galloway, and Alexander J. Bruni; (iii) for fiscal year 2023, Mr. Long, Mr. Bruni, Mr. Bernocchi, and Daniel J. Starck; (iv) for fiscal year 2022, Mr. Long, Mr. Bruni, Nicholas J. Pace, Mr. Starck, Tammy L. Gomez, and Jeffrey T. Jochims; and (v) for fiscal year 2021, Mr. Long, Mr. Jochims, Christopher M. Lowery, Mr. Pace, and Mark P. Zacur. |
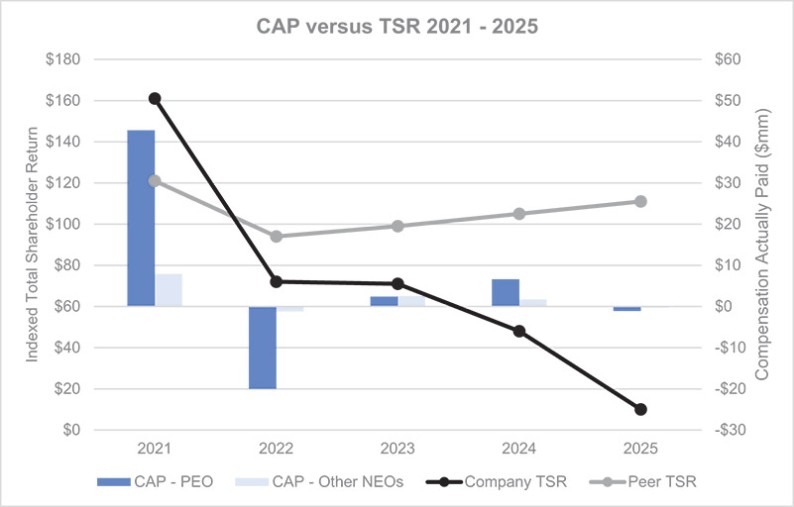
| (4) | The Company TSR and the Company’s Peer Group TSR reflected in these columns for each applicable fiscal year is calculated based on a fixed investment of $100 at the applicable measurement point on the same cumulative basis as is used in Item 201(e) of Regulation S-K. The peer group used to determine the Company’s Peer Group TSR for each applicable fiscal year is the following published industry index, as disclosed in our 2025 Annual Report on Form 10-K pursuant to Item 201(e) of Regulation S-K: Russell 3000 Medical Equipment and Services Sector Index. |
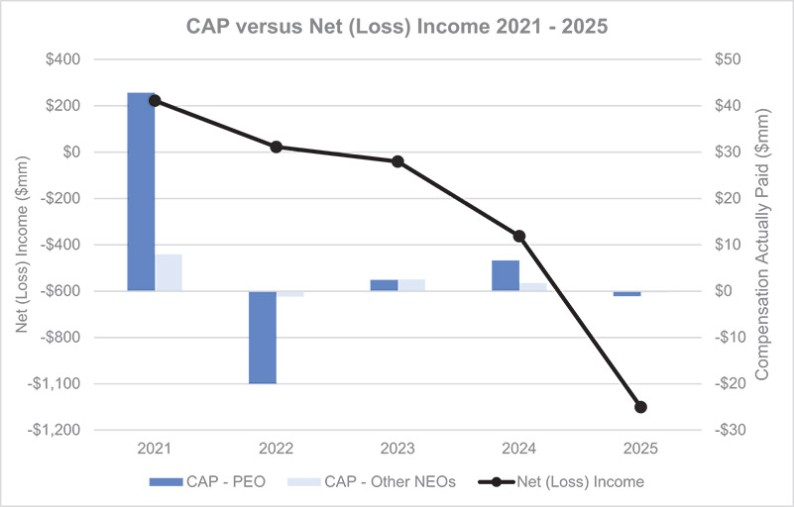
| (5) | Represents the amount of net (loss) income reflected in the Company’s audited financial statements for each applicable fiscal year. |
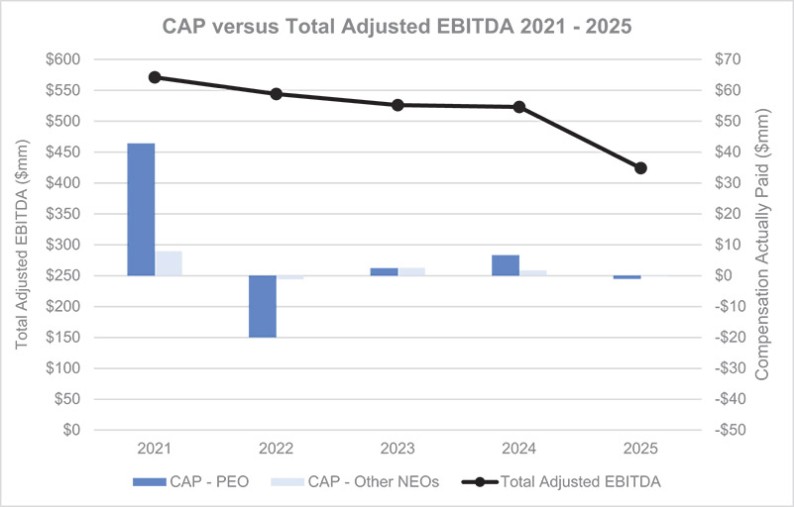
| (6) | We have selected Total Adjusted EBITDA as our most important financial measure (that is not otherwise required to be disclosed in the table) used to link CAP to our NEOs to company performance for fiscal year 2025. Total Adjusted EBITDA is a non-GAAP financial measure, which excludes items and charges that (i) management does not believe reflect the Company’s core business and relate more to strategic, multi-year corporate activities; or (ii) relate to activities or actions that may have occurred without predictable trends from net (loss) income reported in accordance with U.S. GAAP. Charges excluded from Total Adjusted EBITDA and other non-GAAP financial measures include acquisition-related charges and intangible amortization and exit and realignment charges, net, and other adjustments. Total Adjusted EBITDA and other non-GAAP financial measures included in this proxy statement and a reconciliation to the most comparable GAAP equivalent financial measure for the year ended December 31, 2025 is included in Appendix B within this proxy statement, and for the years ended December 31, 2024, 2023, and 2022 are described in the Company’s Current Reports on Form 8-K filed with the SEC on February 28, 2025, February 20, 2024, and February 28, 2023. For the year ended December 31, 2021, a reconciliation to the most comparable GAAP equivalent financial measure is included within exhibit 99.2 in the Company’s Current Report on Form 8-K filed with the SEC on December 6, 2023. |
| (7) | For fiscal years 2025, 2024, 2023, 2022, and 2021 the CAP to the PEO and the average CAP to the non-PEO NEOs reflect the following adjustments made to the total compensation amounts reported in the Summary Compensation Table for fiscal years 2025, 2024, 2023, 2022, and 2021, as applicable, computed in accordance with Item 402(v) of Regulation S-K. Adjustments for (a) increase in fair value of awards granted and vesting during the applicable FY, and (b) reduction of fair value of awards granted during prior FY that were forfeited during the applicable FY, were not included as columns because there were no values to report during the covered year: |
| | | Change in fair | | | | | |||||||||||||||
value of awards | ||||||||||||||||||||||
granted during | Change in fair | |||||||||||||||||||||
Increase in fair | prior FY that | value of awards | Reduction of | |||||||||||||||||||
Deduction for | value of awards | were outstanding | granted during | fair value of | ||||||||||||||||||
amounts | granted during | and unvested as | prior FY that | awards | ||||||||||||||||||
reported in the | applicable FY | of applicable FY | vested during | granted | Increase based | |||||||||||||||||
“Stock Awards” | that remain | end, determined | applicable FY, | during prior FY | on dividends or | |||||||||||||||||
and “Option | unvested as of | based on change | determined | that were | other earnings | |||||||||||||||||
| Awards” |
| applicable FY |
| in fair value from |
| based on change |
| forfeited during | paid during | ||||||||||||
columns in the |
| end, determined |
| prior FY end |
| in fair value from |
| applicable FY, | applicable FY | |||||||||||||
SCT for | as of applicable |
| to applicable FY |
| prior FY end to | determined as | prior to vesting | Total | ||||||||||||||
applicable FY | FY end |
| end | vesting date | of prior FY end | date | Adjustments | |||||||||||||||
Year | | | ($) | | | ($) | | | ($) | | | ($) | | | ($) | | | ($) | | | ($) | |
PEO |
| |||||||||||||||||||||
2025 |
| (9,560,140) |
| 1,500,590 |
| (3,704,854) |
| (504,207) |
| — |
| — |
| (12,268,611) | ||||||||
2024 |
| (7,833,326) |
| 3,808,999 |
| (1,292,197) |
| 1,212,644 |
| — |
| — |
| (4,103,880) | ||||||||
2023 |
| (5,834,851) |
| 4,084,966 |
| (49,069) |
| (4,156,695) |
| — |
| — |
| (5,955,649) | ||||||||
2022 |
| (4,915,897) |
| 1,141,587 |
| (21,056,470) |
| (1,903,417) |
| — |
| 2,800 |
| (26,731,397) | ||||||||
2021 |
| (4,400,000) |
| 8,409,551 |
| 29,692,842 |
| 1,440,780 |
| — |
| 16,527 |
| 35,159,700 | ||||||||
Avg. Other NEOs |
| |||||||||||||||||||||
2025 |
| (2,274,865) |
| 357,070 |
| (973,905) |
| (186,780) |
| — |
| — |
| (3,078,480) | ||||||||
2024 |
| (1,829,018) |
| 775,299 |
| (314,893) |
| 194,987 |
| (99,142) |
| — |
| (1,272,767) | ||||||||
2023 |
| (2,086,665) |
| 1,597,860 |
| (11,257) |
| (177,791) |
| — |
| — |
| (677,853) | ||||||||
2022 |
| (1,950,021) |
| 378,830 |
| (2,249,301) |
| (193,567) |
| — |
| 103 |
| (4,013,956) | ||||||||
2021 |
| (1,700,000) |
| 2,841,429 |
| 2,961,055 |
| 433,444 |
| — |
| 1,784 |
| 4,537,712 |
| (1) | The name of the Principal Executive Officer of the Company (“PEO”) reflected in these columns for each of the applicable fiscal years is Edward A. Pesicka. |
| (3) | The names of each of the non-PEO NEOs reflected in these columns for each applicable fiscal year are as follows: (i) for fiscal year 2025, Jonathan A. Leon, Andrew G. Long, Perry A. Bernocchi, and Heath H. Galloway; (ii) for fiscal year 2024, Mr. Leon, Mr. Long, Mr. Bernocchi, Mr. Galloway, and Alexander J. Bruni; (iii) for fiscal year 2023, Mr. Long, Mr. Bruni, Mr. Bernocchi, and Daniel J. Starck; (iv) for fiscal year 2022, Mr. Long, Mr. Bruni, Nicholas J. Pace, Mr. Starck, Tammy L. Gomez, and Jeffrey T. Jochims; and (v) for fiscal year 2021, Mr. Long, Mr. Jochims, Christopher M. Lowery, Mr. Pace, and Mark P. Zacur. |
| (4) | The Company TSR and the Company’s Peer Group TSR reflected in these columns for each applicable fiscal year is calculated based on a fixed investment of $100 at the applicable measurement point on the same cumulative basis as is used in Item 201(e) of Regulation S-K. The peer group used to determine the Company’s Peer Group TSR for each applicable fiscal year is the following published industry index, as disclosed in our 2025 Annual Report on Form 10-K pursuant to Item 201(e) of Regulation S-K: Russell 3000 Medical Equipment and Services Sector Index. |
| (7) | For fiscal years 2025, 2024, 2023, 2022, and 2021 the CAP to the PEO and the average CAP to the non-PEO NEOs reflect the following adjustments made to the total compensation amounts reported in the Summary Compensation Table for fiscal years 2025, 2024, 2023, 2022, and 2021, as applicable, computed in accordance with Item 402(v) of Regulation S-K. Adjustments for (a) increase in fair value of awards granted and vesting during the applicable FY, and (b) reduction of fair value of awards granted during prior FY that were forfeited during the applicable FY, were not included as columns because there were no values to report during the covered year: |
| | | Change in fair | | | | | |||||||||||||||
value of awards | ||||||||||||||||||||||
granted during | Change in fair | |||||||||||||||||||||
Increase in fair | prior FY that | value of awards | Reduction of | |||||||||||||||||||
Deduction for | value of awards | were outstanding | granted during | fair value of | ||||||||||||||||||
amounts | granted during | and unvested as | prior FY that | awards | ||||||||||||||||||
reported in the | applicable FY | of applicable FY | vested during | granted | Increase based | |||||||||||||||||
“Stock Awards” | that remain | end, determined | applicable FY, | during prior FY | on dividends or | |||||||||||||||||
and “Option | unvested as of | based on change | determined | that were | other earnings | |||||||||||||||||
| Awards” |
| applicable FY |
| in fair value from |
| based on change |
| forfeited during | paid during | ||||||||||||
columns in the |
| end, determined |
| prior FY end |
| in fair value from |
| applicable FY, | applicable FY | |||||||||||||
SCT for | as of applicable |
| to applicable FY |
| prior FY end to | determined as | prior to vesting | Total | ||||||||||||||
applicable FY | FY end |
| end | vesting date | of prior FY end | date | Adjustments | |||||||||||||||
Year | | | ($) | | | ($) | | | ($) | | | ($) | | | ($) | | | ($) | | | ($) | |
PEO |
| |||||||||||||||||||||
2025 |
| (9,560,140) |
| 1,500,590 |
| (3,704,854) |
| (504,207) |
| — |
| — |
| (12,268,611) | ||||||||
2024 |
| (7,833,326) |
| 3,808,999 |
| (1,292,197) |
| 1,212,644 |
| — |
| — |
| (4,103,880) | ||||||||
2023 |
| (5,834,851) |
| 4,084,966 |
| (49,069) |
| (4,156,695) |
| — |
| — |
| (5,955,649) | ||||||||
2022 |
| (4,915,897) |
| 1,141,587 |
| (21,056,470) |
| (1,903,417) |
| — |
| 2,800 |
| (26,731,397) | ||||||||
2021 |
| (4,400,000) |
| 8,409,551 |
| 29,692,842 |
| 1,440,780 |
| — |
| 16,527 |
| 35,159,700 | ||||||||
Avg. Other NEOs |
| |||||||||||||||||||||
2025 |
| (2,274,865) |
| 357,070 |
| (973,905) |
| (186,780) |
| — |
| — |
| (3,078,480) | ||||||||
2024 |
| (1,829,018) |
| 775,299 |
| (314,893) |
| 194,987 |
| (99,142) |
| — |
| (1,272,767) | ||||||||
2023 |
| (2,086,665) |
| 1,597,860 |
| (11,257) |
| (177,791) |
| — |
| — |
| (677,853) | ||||||||
2022 |
| (1,950,021) |
| 378,830 |
| (2,249,301) |
| (193,567) |
| — |
| 103 |
| (4,013,956) | ||||||||
2021 |
| (1,700,000) |
| 2,841,429 |
| 2,961,055 |
| 433,444 |
| — |
| 1,784 |
| 4,537,712 |
Pay versus Performance Tabular List
The following table lists our most important performance measures used by us to link CAP to our NEOs to company performance for fiscal year 2025. The performance measures included in this table are not ranked by relative importance.
Most Important |
Total Adjusted EBITDA |
Revenue |
| (6) | We have selected Total Adjusted EBITDA as our most important financial measure (that is not otherwise required to be disclosed in the table) used to link CAP to our NEOs to company performance for fiscal year 2025. Total Adjusted EBITDA is a non-GAAP financial measure, which excludes items and charges that (i) management does not believe reflect the Company’s core business and relate more to strategic, multi-year corporate activities; or (ii) relate to activities or actions that may have occurred without predictable trends from net (loss) income reported in accordance with U.S. GAAP. Charges excluded from Total Adjusted EBITDA and other non-GAAP financial measures include acquisition-related charges and intangible amortization and exit and realignment charges, net, and other adjustments. Total Adjusted EBITDA and other non-GAAP financial measures included in this proxy statement and a reconciliation to the most comparable GAAP equivalent financial measure for the year ended December 31, 2025 is included in Appendix B within this proxy statement, and for the years ended December 31, 2024, 2023, and 2022 are described in the Company’s Current Reports on Form 8-K filed with the SEC on February 28, 2025, February 20, 2024, and February 28, 2023. For the year ended December 31, 2021, a reconciliation to the most comparable GAAP equivalent financial measure is included within exhibit 99.2 in the Company’s Current Report on Form 8-K filed with the SEC on December 6, 2023. |