Pay vs Performance Disclosure - USD ($)
|
12 Months Ended |
Dec. 31, 2025 |
Dec. 31, 2024 |
Dec. 31, 2023 |
Dec. 31, 2022 |
Dec. 31, 2021 |
| Pay vs Performance Disclosure |
|
|
|
|
|
| Pay vs Performance Disclosure, Table |
| | | | | | | | | | | | | | | | | | | | | | | | | | | | | | | | | | | | | | | | Year-end value of $100 invested on 12/31/2020 in: | | | | | | | | | | | | | | (a)
Year | (b)
Summary Compensation Table Total for Gunnar Kleveland
$1 | (c)
Summary Compensation Table Total for A. William Higgins
$2 | (d)
Compensation Actually Paid to Gunnar Kleveland
$3 | (e)
Compensation Actually Paid to A. William Higgins
$4 | (f)
Average Summary Compensation Table Total for non-PEO NEOs
$5 | (g)
Average Compensation Actually Paid to non-PEO NEOs
$6 | (h)
AIN Total Shareholder Return
$7 | (i)
Peer Group Total Shareholder Return
$8 | (j)
Net Income (in millions)
$9 | (k)
Adjusted EBITDA (in millions)
$10 | | | | | | | | | | | | | 202511 | 4,259,285 | N/A | 1,849,119 | N/A | 1,563,135 | 811,653 | 74.07 | 198.10 | (57.0) | 221.8 | | 2024 | 3,921,822 | N/A | 2,692,030 | N/A | 1,923,016 | 987,208 | 113.89 | 149.50 | 88.1 | 232.0 | | 2023 | 4,247,149 | 4,300,649 | 4,563,712 | 4,905,001 | 2,334,459 | 2,241,045 | 137.84 | 131.71 | 111.6 | 265.1 | | 2022 | N/A | 4,660,482 | N/A | 6,318,295 | 1,763,694 | 2,162,432 | 136.66 | 103.88 | 96.5 | 253.5 | | 2021 | N/A | 4,725,711 | N/A | 6,065,337 | 1,737,959 | 2,202,801 | 121.44 | 111.27 | 118.8 | 250.9 |
|
|
|
|
|
| Company Selected Measure Name |
AIN Adjusted EBITDA
|
|
|
|
|
| Named Executive Officers, Footnote |
1 Gunnar Kleveland became President and CEO of the Company in September 2023. 2 A. William Higgins served as President and CEO of the Company until his retirement in August 2023. Non-PEO NEOs reflect the average Summary Compensation Table total compensation and average Compensation Actually Paid for the following executives by year: 2025: Robert Starr, Merle Stein, Chris Stone, Joseph Gaug, Will Station, Jairaj Chetnani; 2024: Robert Starr, Merle Stein, Chris Stone, Joseph Gaug, Daniel Halftermeyer, and Greg Harwell; 2023: Robert Starr, Stephen Nolan, Daniel Halftermeyer, Greg Harwell, and Joseph Gaug; 2022: Stephen Nolan, Daniel Halftermeyer, Greg Harwell, and Joseph Gaug; 2021: Stephen Nolan, Daniel Halftermeyer, Greg Harwell, and Joseph Gaug.
|
|
|
|
|
| Peer Group Issuers, Footnote |
Our selected peer group is the peer group discussed in the Compensation Discussion and Analysis shown on page 41.
|
|
|
|
|
| Adjustment To PEO Compensation, Footnote |
“Compensation actually paid” to Mr. Kleveland in each of 2023, 2024 and 2025 reflects the respective amounts shown in Column (d) of the table above, adjusted as set forth in the table below, as required by SEC rules.“Compensation actually paid” to Mr. Higgins in each of 2021, 2022 and 2023 reflects the respective amounts shown in Column (e) of the table above, adjusted as set forth in the table below, as required by SEC rules. | | | | | | | | | | | | | | | | | | | | | | Year | 2021 | 2022 | 2023 | 2023 | 2024 | 2025 | | CEO | Higgins | Higgins | Higgins | Kleveland | Kleveland | Kleveland | | SCT Total Compensation ($) | $4,725,711 | $4,660,482 | $4,300,649 | $4,247,149 | $3,921,822 | $4,259,285 | | Less: Stock Award Values reported in SCT for the applicable year ($) | $(2,000,000) | $(2,200,000) | $(2,400,000) | $(3,300,000) | $(1,854,000) | $(2,612,570) | | Plus: YE Fair Value of Stock Awards granted in the applicable year ($) | $2,558,110 | $2,652,019 | $1,389,930 | $3,616,563 | $1,333,550 | $1,416,580 | | Change in Fair Value of outstanding unvested stock awards from prior years ($) | $781,516 | $1,217,979 | $488,764 | $— | (658,446) | (1,171,123) | | Change in Fair Value of Stock Awards from prior years that vested in the applicable year ($) | $— | $(12,185) | $1,125,658 | $— | (50,895) | (43,054) | | Less: Fair value of Stock Awards forfeited during the applicable year | $— | $— | $— | $— | — | — | | Less: Aggregate change in Actuarial Present Value of accumulated pension benefit | $— | $— | $— | $— | — | — | | Plus: Aggregate Service cost and prior year costs for pension benefit | $— | $— | $— | $— | — | — | | Compensation Actually Paid | $6,065,337 | $6,318,295 | $4,905,001 | $4,563,712 | $2,692,030 | $1,849,119 |
|
|
|
|
|
| Non-PEO NEO Average Total Compensation Amount |
$ 1,563,135
|
$ 1,923,016
|
$ 2,334,459
|
$ 1,763,694
|
$ 1,737,959
|
| Non-PEO NEO Average Compensation Actually Paid Amount |
$ 811,653
|
987,208
|
2,241,045
|
2,162,432
|
2,202,801
|
| Adjustment to Non-PEO NEO Compensation Footnote |
Non-PEO NEOs reflect the average Summary Compensation Table total compensation and average Compensation Actually Paid for the following executives by year: 2025: Robert Starr, Merle Stein, Chris Stone, Joseph Gaug, Will Station, Jairaj Chetnani; 2024: Robert Starr, Merle Stein, Chris Stone, Joseph Gaug, Daniel Halftermeyer, and Greg Harwell; 2023: Robert Starr, Stephen Nolan, Daniel Halftermeyer, Greg Harwell, and Joseph Gaug; 2022: Stephen Nolan, Daniel Halftermeyer, Greg Harwell, and Joseph Gaug; 2021: Stephen Nolan, Daniel Halftermeyer, Greg Harwell, and Joseph Gaug. | | | | | | | | | | | | | | | | | | | Year | 2021 | 2022 | 2023 | 2024 | 2025 | | (Average) | (Average) | (Average) | (Average) | (Average) | | SCT Total Compensation ($) | $1,737,959 | $1,763,694 | $2,334,459 | $1,923,016 | $1,563,135 | | Less: Stock Award Values reported in SCT for the applicable year ($) | $(545,079) | $(630,813) | $(1,283,371) | $(988,088) | $(913,684) | | Plus: YE Fair Value of Stock Awards granted in the applicable year ($) | $689,874 | $758,207 | $1,415,779 | $596,052 | $525,040 | | Change in Fair Value of outstanding unvested stock awards from prior years ($) | $270,052 | $292,308 | $57,968 | $(194,690) | $(184,741) | | Fair Value for Awards Granted in and Vested in Current Year | $— | $— | $— | $58,956 | $— | | Change in Fair Value of Stock Awards from prior years that vested in the applicable year ($) | $49,995 | $(20,964) | $16,416 | $(47,900) | $(37,168) | | Less: Fair value of Stock Awards forfeited during the applicable year ($) | $— | $— | $(300,206) | $(360,138) | $(140,929) | | Less: Aggregate change in Actuarial Present Value of accumulated pension benefit ($) | $— | $— | $— | $— | $— | | Plus: Aggregate Service cost and prior year costs for pension benefit | $— | $— | $— | $— | $— | | Compensation Actually Paid | $2,202,801 | $2,162,432 | $2,241,045 | $987,208 | $811,653 |
|
|
|
|
|
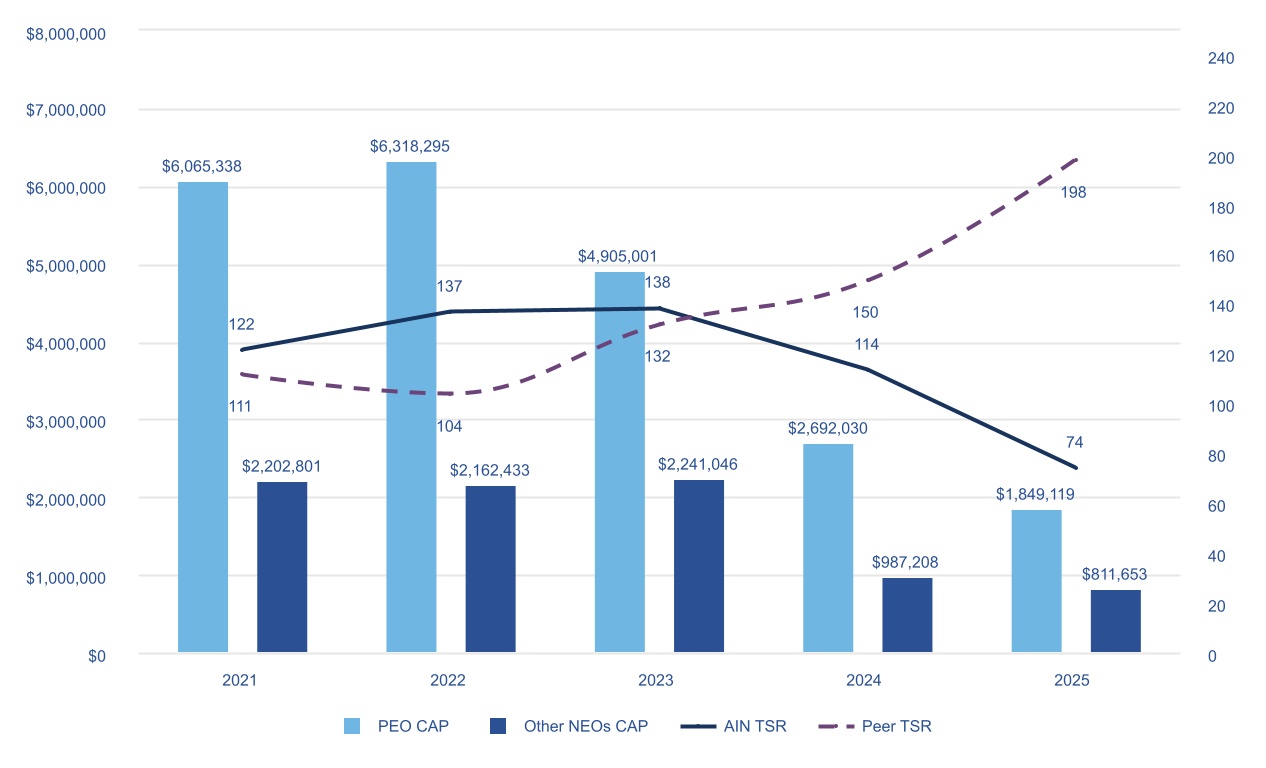
| Compensation Actually Paid vs. Total Shareholder Return |
|
|
|
|
|
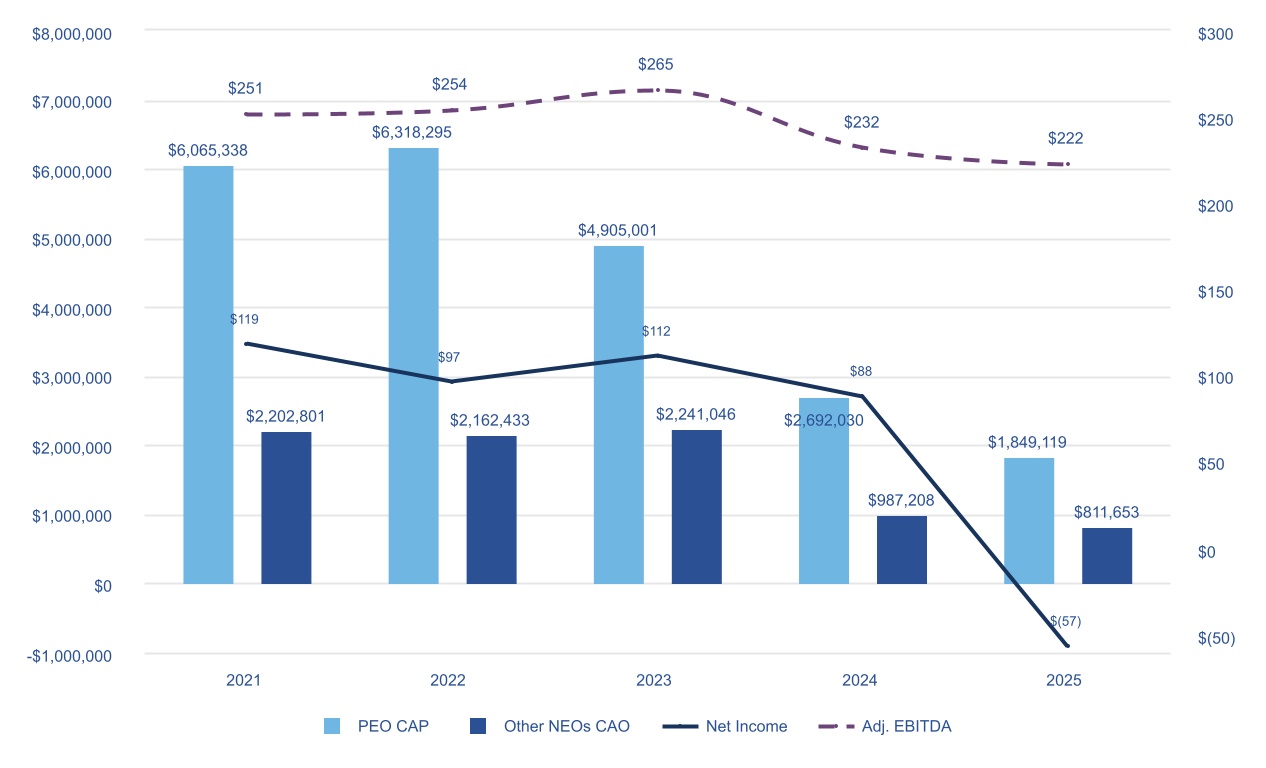
| Compensation Actually Paid vs. Net Income |
|
|
|
|
|
| Compensation Actually Paid vs. Company Selected Measure |
|
|
|
|
|
| Total Shareholder Return Vs Peer Group |
|
|
|
|
|
| Tabular List, Table |
| | | MOST IMPORTANT PERFORMANCE METRICS | | AIN Adjusted EBITDA | AIN Adjusted Free Cash Flow | MC Adjusted EBITDA | MC Adjusted Free Cash Flow | AEC Adjusted EBITDA | AEC Adjusted Free Cash Flow | AIN TRIR |
|
|
|
|
|
| Total Shareholder Return Amount |
$ 74.07
|
113.89
|
137.84
|
136.66
|
121.44
|
| Peer Group Total Shareholder Return Amount |
198.10
|
149.50
|
131.71
|
103.88
|
111.27
|
| Net Income (Loss), Including Portion Attributable to Noncontrolling Interest |
$ (57,000,000.0)
|
$ 88,100,000
|
$ 111,600,000
|
$ 96,500,000
|
$ 118,800,000
|
| Company Selected Measure Amount |
221,800,000
|
232,000,000.0
|
265,100,000
|
253,500,000
|
250,900,000
|
| Additional 402(v) Disclosure |
PAY VERSUS PERFORMANCE (PVP) DISCLOSURES The following pages of our Proxy Statement provide disclosures about the relationship between (a) the "compensation actually paid" to our principal executive officer ("PEO") and the average "compensation actually paid" to our non-PEO NEOs, as defined under SEC disclosure rules, and (b) certain financial performance measures of the Company for the fiscal years listed below. These disclosures have been prepared in accordance with Item 402(v) of Regulation S-K under the Exchange Act (the "Pay versus Performance Rules") and do not necessarily reflect how the Committee evaluates compensation decisions. "Compensation actually paid" does not reflect the value of cash or shares of the Company's common stock received by a NEO during the year, but rather is an amount calculated under SEC rules to include, among other things, year-over-year changes in the value of unvested equity-based awards. To calculate "compensation actually paid", adjustments were made to the amounts reported in the Summary Compensation Table for the applicable year in accordance with the disclosure rules. For the purposes of calculating "compensation actually paid", the fair value of equity awards is calculated using the same valuation methodologies used to calculate the grant date fair value of awards in accordance with FASB ASC Topic 718 for the purposes of the Summary Compensation Table, and, where applicable, may incorporate adjustments for year-end forecasted attainment levels for performance achievement goals. As a result of the calculation methodology required by the SEC, the amounts shown below as "compensation actually paid" differ from the compensation actually received by our NEOs, and from the decisions of the Committee described in the Compensation Discussion and Analysis above. Mr. Halftermeyer received a negative change in pension value in 2024; according to SEC guidelines, the value is incorporated into Summary Compensation Table calculations but is not included for purposes of aggregating the Compensation Actually Paid.For the relevant year, represents the cumulative total shareholder return (TSR) for the Company for the measurement period. TSR assumes that $100 was invested on December 31, 2020, and that dividends were reinvested when and as paid.Reflects “Net Income” as reported in the Company’s Annual Reports on Form 10-K for each of the years reported.No dividends are paid or accrued on any unvested equity awards.The four items listed below represent the most important performance metrics we use to determine Compensation Actually Paid for 2024 as further described in our Compensation Discussion and Analysis with the section titled “Executive Compensation Earned” (see page 47). The definitions of these metrics are set forth in Exhibit A to the Proxy Statement. Relationship between “Compensation Actually Paid” and Performance The graphs that follow show the relationship of “compensation actually paid” to our PEOs and other named executive officers in 2021, 2022, 2023, 2024 and 2025 to (1) the TSR for both the Company and our compensation peer benchmarking groups, (2) the Company’s net income, and (3) the Company’s adjusted EBITDA. For the purposes of these graphs, an averaged "compensation actually earned" is used for Messrs. Higgins and Kleveland for 2023.
|
|
|
|
|
| Measure:: 1 |
|
|
|
|
|
| Pay vs Performance Disclosure |
|
|
|
|
|
| Name |
AIN Adjusted EBITDA
|
|
|
|
|
| Non-GAAP Measure Description |
AIN Adjusted EBITDA was chosen as the "company selected financial metric" as it is the most heavily weighted of the annual performance measurement metrics used in our executive compensation program for the years reported (see pp. 46-48).
|
|
|
|
|
| Measure:: 2 |
|
|
|
|
|
| Pay vs Performance Disclosure |
|
|
|
|
|
| Name |
AIN Adjusted Free Cash Flow
|
|
|
|
|
| Measure:: 3 |
|
|
|
|
|
| Pay vs Performance Disclosure |
|
|
|
|
|
| Name |
MC Adjusted EBITDA
|
|
|
|
|
| Measure:: 4 |
|
|
|
|
|
| Pay vs Performance Disclosure |
|
|
|
|
|
| Name |
MC Adjusted Free Cash Flow
|
|
|
|
|
| Measure:: 5 |
|
|
|
|
|
| Pay vs Performance Disclosure |
|
|
|
|
|
| Name |
AEC Adjusted EBITDA
|
|
|
|
|
| Measure:: 6 |
|
|
|
|
|
| Pay vs Performance Disclosure |
|
|
|
|
|
| Name |
AEC Adjusted Free Cash Flow
|
|
|
|
|
| Measure:: 7 |
|
|
|
|
|
| Pay vs Performance Disclosure |
|
|
|
|
|
| Name |
AIN TRIR
|
|
|
|
|
| Gunnar Kleveland [Member] |
|
|
|
|
|
| Pay vs Performance Disclosure |
|
|
|
|
|
| PEO Total Compensation Amount |
$ 4,259,285
|
$ 3,921,822
|
$ 4,247,149
|
|
|
| PEO Actually Paid Compensation Amount |
1,849,119
|
2,692,030
|
4,563,712
|
|
|
| A. William Higgins [Member] |
|
|
|
|
|
| Pay vs Performance Disclosure |
|
|
|
|
|
| PEO Total Compensation Amount |
|
|
4,300,649
|
$ 4,660,482
|
$ 4,725,711
|
| PEO Actually Paid Compensation Amount |
|
|
4,905,001
|
6,318,295
|
6,065,337
|
| PEO | Gunnar Kleveland [Member] | Aggregate Change in Present Value of Accumulated Benefit for All Pension Plans Reported in Summary Compensation Table |
|
|
|
|
|
| Pay vs Performance Disclosure |
|
|
|
|
|
| Adjustment to Compensation, Amount |
0
|
0
|
0
|
|
|
| PEO | Gunnar Kleveland [Member] | Aggregate Pension Adjustments Service Cost |
|
|
|
|
|
| Pay vs Performance Disclosure |
|
|
|
|
|
| Adjustment to Compensation, Amount |
0
|
0
|
0
|
|
|
| PEO | Gunnar Kleveland [Member] | Aggregate Grant Date Fair Value of Equity Award Amounts Reported in Summary Compensation Table |
|
|
|
|
|
| Pay vs Performance Disclosure |
|
|
|
|
|
| Adjustment to Compensation, Amount |
(2,612,570)
|
(1,854,000)
|
(3,300,000)
|
|
|
| PEO | Gunnar Kleveland [Member] | Year-end Fair Value of Equity Awards Granted in Covered Year that are Outstanding and Unvested |
|
|
|
|
|
| Pay vs Performance Disclosure |
|
|
|
|
|
| Adjustment to Compensation, Amount |
1,416,580
|
1,333,550
|
3,616,563
|
|
|
| PEO | Gunnar Kleveland [Member] | Year-over-Year Change in Fair Value of Equity Awards Granted in Prior Years That are Outstanding and Unvested |
|
|
|
|
|
| Pay vs Performance Disclosure |
|
|
|
|
|
| Adjustment to Compensation, Amount |
(1,171,123)
|
(658,446)
|
0
|
|
|
| PEO | Gunnar Kleveland [Member] | Change in Fair Value as of Vesting Date of Prior Year Equity Awards Vested in Covered Year |
|
|
|
|
|
| Pay vs Performance Disclosure |
|
|
|
|
|
| Adjustment to Compensation, Amount |
(43,054)
|
(50,895)
|
0
|
|
|
| PEO | Gunnar Kleveland [Member] | Prior Year End Fair Value of Equity Awards Granted in Any Prior Year that Fail to Meet Applicable Vesting Conditions During Covered Year |
|
|
|
|
|
| Pay vs Performance Disclosure |
|
|
|
|
|
| Adjustment to Compensation, Amount |
0
|
0
|
0
|
|
|
| PEO | A. William Higgins [Member] | Aggregate Change in Present Value of Accumulated Benefit for All Pension Plans Reported in Summary Compensation Table |
|
|
|
|
|
| Pay vs Performance Disclosure |
|
|
|
|
|
| Adjustment to Compensation, Amount |
|
|
0
|
0
|
0
|
| PEO | A. William Higgins [Member] | Aggregate Pension Adjustments Service Cost |
|
|
|
|
|
| Pay vs Performance Disclosure |
|
|
|
|
|
| Adjustment to Compensation, Amount |
|
|
0
|
0
|
0
|
| PEO | A. William Higgins [Member] | Aggregate Grant Date Fair Value of Equity Award Amounts Reported in Summary Compensation Table |
|
|
|
|
|
| Pay vs Performance Disclosure |
|
|
|
|
|
| Adjustment to Compensation, Amount |
|
|
(2,400,000)
|
(2,200,000)
|
(2,000,000)
|
| PEO | A. William Higgins [Member] | Year-end Fair Value of Equity Awards Granted in Covered Year that are Outstanding and Unvested |
|
|
|
|
|
| Pay vs Performance Disclosure |
|
|
|
|
|
| Adjustment to Compensation, Amount |
|
|
1,389,930
|
2,652,019
|
2,558,110
|
| PEO | A. William Higgins [Member] | Year-over-Year Change in Fair Value of Equity Awards Granted in Prior Years That are Outstanding and Unvested |
|
|
|
|
|
| Pay vs Performance Disclosure |
|
|
|
|
|
| Adjustment to Compensation, Amount |
|
|
488,764
|
1,217,979
|
781,516
|
| PEO | A. William Higgins [Member] | Change in Fair Value as of Vesting Date of Prior Year Equity Awards Vested in Covered Year |
|
|
|
|
|
| Pay vs Performance Disclosure |
|
|
|
|
|
| Adjustment to Compensation, Amount |
|
|
1,125,658
|
(12,185)
|
0
|
| PEO | A. William Higgins [Member] | Prior Year End Fair Value of Equity Awards Granted in Any Prior Year that Fail to Meet Applicable Vesting Conditions During Covered Year |
|
|
|
|
|
| Pay vs Performance Disclosure |
|
|
|
|
|
| Adjustment to Compensation, Amount |
|
|
0
|
0
|
0
|
| Non-PEO NEO | Aggregate Change in Present Value of Accumulated Benefit for All Pension Plans Reported in Summary Compensation Table |
|
|
|
|
|
| Pay vs Performance Disclosure |
|
|
|
|
|
| Adjustment to Compensation, Amount |
0
|
0
|
0
|
0
|
0
|
| Non-PEO NEO | Aggregate Pension Adjustments Service Cost |
|
|
|
|
|
| Pay vs Performance Disclosure |
|
|
|
|
|
| Adjustment to Compensation, Amount |
0
|
0
|
0
|
0
|
0
|
| Non-PEO NEO | Aggregate Grant Date Fair Value of Equity Award Amounts Reported in Summary Compensation Table |
|
|
|
|
|
| Pay vs Performance Disclosure |
|
|
|
|
|
| Adjustment to Compensation, Amount |
(913,684)
|
(988,088)
|
(1,283,371)
|
(630,813)
|
(545,079)
|
| Non-PEO NEO | Year-end Fair Value of Equity Awards Granted in Covered Year that are Outstanding and Unvested |
|
|
|
|
|
| Pay vs Performance Disclosure |
|
|
|
|
|
| Adjustment to Compensation, Amount |
525,040
|
596,052
|
1,415,779
|
758,207
|
689,874
|
| Non-PEO NEO | Year-over-Year Change in Fair Value of Equity Awards Granted in Prior Years That are Outstanding and Unvested |
|
|
|
|
|
| Pay vs Performance Disclosure |
|
|
|
|
|
| Adjustment to Compensation, Amount |
(184,741)
|
(194,690)
|
57,968
|
292,308
|
270,052
|
| Non-PEO NEO | Vesting Date Fair Value of Equity Awards Granted and Vested in Covered Year |
|
|
|
|
|
| Pay vs Performance Disclosure |
|
|
|
|
|
| Adjustment to Compensation, Amount |
0
|
58,956
|
0
|
0
|
0
|
| Non-PEO NEO | Change in Fair Value as of Vesting Date of Prior Year Equity Awards Vested in Covered Year |
|
|
|
|
|
| Pay vs Performance Disclosure |
|
|
|
|
|
| Adjustment to Compensation, Amount |
(37,168)
|
(47,900)
|
16,416
|
(20,964)
|
49,995
|
| Non-PEO NEO | Prior Year End Fair Value of Equity Awards Granted in Any Prior Year that Fail to Meet Applicable Vesting Conditions During Covered Year |
|
|
|
|
|
| Pay vs Performance Disclosure |
|
|
|
|
|
| Adjustment to Compensation, Amount |
$ (140,929)
|
$ (360,138)
|
$ (300,206)
|
$ 0
|
$ 0
|