Pay vs Performance Disclosure - USD ($)
Dec. 31, 2025
Dec. 31, 2024
Dec. 31, 2023
Dec. 31, 2022
Dec. 31, 2021
2025 Pay Versus Performance
In accordance with rules adopted by the SEC pursuant to the Dodd-Frank Act, we provide the following disclosure regarding executive compensation for our principal executive officer (“PEO”) and Non-PEO NEOs and company performance for the fiscal years listed below. This pay versus performance disclosure should not be deemed incorporated by reference into any other filing under the Securities Act of 1933 or the Exchange Act of 1934.
2025 Pay Versus Performance Table
Year | Summary Compen- sation Table Total for PEO 1(1) ($) | Compen- sation Actually Paid to PEO 1(1),(2),(3) ($) | Summary Compen- sation Table Total for PEO 2(1) ($) | Compen- sation Actually Paid to PEO 2(1),(2),(3) ($) | Average Summary Compen- sation Table Total for non-PEO NEOs(1) ($) | Average Compen- sation Actually Paid to non- PEO NEOs(1),(2),(3) ($) | Value of Initial Fixed $100 Investment based on(4): | Net Income ($ millions) | AFFO Available to Common Stock- holders and Unit Holders(5) ($ millions) | |||||||||||||||||||||||
TSR ($) | Peer Group TSR ($) | |||||||||||||||||||||||||||||||
2025 | — | — | 6,246,483 | 5,903,983 | 2,361,619 | 2,209,885 | 160.06 | 137.83 | 247 | 540.4 | ||||||||||||||||||||||
2024 | — | — | 5,754,274 | 6,032,922 | 2,206,123 | 2,562,099 | 167.99 | 133.97 | 280 | 527.8 | ||||||||||||||||||||||
2023 | — | — | 6,015,205 | 10,397,228 | 2,406,619 | 5,315,520 | 169.98 | 123.21 | 342 | 473.1 | ||||||||||||||||||||||
2022 | 7,761,196 | 6,710,784 | — | — | 2,902,402 | 2,733,528 | 121.23 | 108.34 | 135 | 363.5 | ||||||||||||||||||||||
2021 | 11,176,606 | 15,683,430 | — | — | 2,790,546 | 3,712,300 | 135.71 | 143.24 | (195) | 52.0 | ||||||||||||||||||||||
(1) | Colin Reed was our PEO for the 2021-2022 fiscal years. Mark Fioravanti was our PEO for the 2023-2025 fiscal years. The individuals comprising the non-PEO NEOs for each fiscal year presented are listed below. |
2021 – 2022 | 2023 – 2025 | ||||
Mark Fioravanti | Colin Reed | ||||
Jennifer Hutcheson | Jennifer Hutcheson | ||||
Patrick Chaffin | Patrick Chaffin | ||||
Scott Lynn | Scott Lynn | ||||
(2) | The amounts shown for Compensation Actually Paid have been calculated in accordance with Item 402(v) of Regulation S-K and do not reflect compensation actually earned, realized or received by the company’s PEO and non-PEO NEOs. These amounts reflect the 2025 Summary Compensation Table total with certain adjustments as described in footnote 3 below. |
(3) | Compensation Actually Paid reflects the exclusions and inclusions of certain amounts for the PEO and the Non-PEO NEOs as set forth below. Equity values are calculated in accordance with FASB ASC Topic 718. Amounts in the Exclusion of Stock Awards column are the totals from the Stock Awards column set forth in the 2025 Summary Compensation Table. |
Year | Summary Compensation Table Total for PEO ($) | Exclusion of Stock Awards for PEO ($) | Inclusion of Equity Values for PEO ($) | Compensation Actually Paid to PEO ($) | ||||||||||
2025 | 6,246,483 | (3,325,125) | 2,982,625 | 5,903,983 | ||||||||||
Year | Average Summary Compensation Table Total for Non-PEO NEOs ($) | Average Exclusion of Stock Awards for Non-PEO NEOs ($) | Average Inclusion of Equity Values for Non-PEO NEOs ($) | Compensation Actually Paid (CAP) to Non-PEO NEOs ($) | ||||||||||
2025 | 2,361,619 | (940,497) | 788,763 | 2,209,885 | ||||||||||
The amounts in the Inclusion of Equity Values in the tables above are derived from the amounts set forth in the following tables.
Year | Year-End Fair Value of Equity Awards Granted During Year That Remained Unvested as of Last Day of Year for PEO ($) | Change in Fair Value from Last Day of Prior Year to Last Day of Year of Unvested Equity for PEO ($) | Vesting- Date Fair Value of Equity Awards Granted During Year that Vested During Year for PEO ($) | Change in Fair Value from Last Day of Prior Year to Vesting Date of Unvested Equity Awards that Vested During Year for PEO ($) | Fair Value at Last Day of Prior Year of Equity Awards Forfeited During Year for PEO ($) | Value of Dividends or Other Earnings Paid on Equity Awards Not Otherwise Included for PEO ($) | Total – Inclusion of Equity Values for PEO ($) | ||||||||||||||||
2025 | 3,268,832 | 28,098 | — | (314,305) | — | — | 2,982,625 | ||||||||||||||||
Year | Average Year-End Fair Value of Equity Awards Granted During Year That Remained Unvested as of Last Day of Year for Non-PEO NEOs ($) | Change in Fair Value from Last Day of Prior Year to Last Day of Year of Unvested Equity for Non-PEO NEOs ($) | Vesting- Date Fair Value of Equity Awards Granted During Year that Vested During Year for Non-PEO NEOs ($) | Change in Fair Value from Last Day of Prior Year to Vesting Date of Unvested Equity Awards that Vested During Year for Non-PEO NEOs ($) | Fair Value at Last Day of Prior Year of Equity Awards Forfeited During Year for Non-PEO NEOs ($) | Value of Dividends or Other Earnings Paid on Equity Awards Not Otherwise Included for Non- PEO NEOs ($) | Total – Inclusion of Equity Values for Non-PEO NEOs ($) | ||||||||||||||||
2025 | 924,573 | 12,305 | — | (148,115) | — | — | 788,763 | ||||||||||||||||
(4) | The Peer Group Total Stockholder Return (TSR) set forth in this table utilizes the FTSE NAREIT Equity REITs Index, which we also utilize in the stock performance graph required by Item 201(e) of SEC Regulation S-K included in our 2025 annual report to stockholders. The comparison assumes $100 was invested for the period starting December 31, 2020 through the end of the listed year in the company and in the FTSE NAREIT Equity REITs Index, respectively. Historical stock performance is not necessarily indicative of future stock performance. |
(5) | We determined Adjusted Funds from Operations (AFFO) available to common stockholders and unit holders to be the most important financial performance measure used to link company performance to Compensation Actually Paid to our PEO and non-PEO NEOs in 2025 since, as described in the Compensation Discussion and Analysis above, this metric represents the largest component of the financial performance goals established for our 2025 short-term cash incentive compensation plan. AFFO available to common stockholders and unit holders is a non-GAAP financial measure. For a definition of AFFO available to common stockholders and unit holders and a reconciliation of this non-GAAP financial measure to consolidated net income (the most comparable GAAP financial measure), and an explanation of why we believe AFFO available to common stockholders and unit holders presents useful information to investors, see Appendix A. |
(1) | Colin Reed was our PEO for the 2021-2022 fiscal years. Mark Fioravanti was our PEO for the 2023-2025 fiscal years. The individuals comprising the non-PEO NEOs for each fiscal year presented are listed below. |
2021 – 2022 | 2023 – 2025 | ||||
Mark Fioravanti | Colin Reed | ||||
Jennifer Hutcheson | Jennifer Hutcheson | ||||
Patrick Chaffin | Patrick Chaffin | ||||
Scott Lynn | Scott Lynn | ||||
(4) | The Peer Group Total Stockholder Return (TSR) set forth in this table utilizes the FTSE NAREIT Equity REITs Index, which we also utilize in the stock performance graph required by Item 201(e) of SEC Regulation S-K included in our 2025 annual report to stockholders. The comparison assumes $100 was invested for the period starting December 31, 2020 through the end of the listed year in the company and in the FTSE NAREIT Equity REITs Index, respectively. Historical stock performance is not necessarily indicative of future stock performance. |
(3) | Compensation Actually Paid reflects the exclusions and inclusions of certain amounts for the PEO and the Non-PEO NEOs as set forth below. Equity values are calculated in accordance with FASB ASC Topic 718. Amounts in the Exclusion of Stock Awards column are the totals from the Stock Awards column set forth in the 2025 Summary Compensation Table. |
Year | Summary Compensation Table Total for PEO ($) | Exclusion of Stock Awards for PEO ($) | Inclusion of Equity Values for PEO ($) | Compensation Actually Paid to PEO ($) | ||||||||||
2025 | 6,246,483 | (3,325,125) | 2,982,625 | 5,903,983 | ||||||||||
The amounts in the Inclusion of Equity Values in the tables above are derived from the amounts set forth in the following tables.
Year | Year-End Fair Value of Equity Awards Granted During Year That Remained Unvested as of Last Day of Year for PEO ($) | Change in Fair Value from Last Day of Prior Year to Last Day of Year of Unvested Equity for PEO ($) | Vesting- Date Fair Value of Equity Awards Granted During Year that Vested During Year for PEO ($) | Change in Fair Value from Last Day of Prior Year to Vesting Date of Unvested Equity Awards that Vested During Year for PEO ($) | Fair Value at Last Day of Prior Year of Equity Awards Forfeited During Year for PEO ($) | Value of Dividends or Other Earnings Paid on Equity Awards Not Otherwise Included for PEO ($) | Total – Inclusion of Equity Values for PEO ($) | ||||||||||||||||
2025 | 3,268,832 | 28,098 | — | (314,305) | — | — | 2,982,625 | ||||||||||||||||
(3) | Compensation Actually Paid reflects the exclusions and inclusions of certain amounts for the PEO and the Non-PEO NEOs as set forth below. Equity values are calculated in accordance with FASB ASC Topic 718. Amounts in the Exclusion of Stock Awards column are the totals from the Stock Awards column set forth in the 2025 Summary Compensation Table. |
Year | Average Summary Compensation Table Total for Non-PEO NEOs ($) | Average Exclusion of Stock Awards for Non-PEO NEOs ($) | Average Inclusion of Equity Values for Non-PEO NEOs ($) | Compensation Actually Paid (CAP) to Non-PEO NEOs ($) | ||||||||||
2025 | 2,361,619 | (940,497) | 788,763 | 2,209,885 | ||||||||||
The amounts in the Inclusion of Equity Values in the tables above are derived from the amounts set forth in the following tables.
Year | Average Year-End Fair Value of Equity Awards Granted During Year That Remained Unvested as of Last Day of Year for Non-PEO NEOs ($) | Change in Fair Value from Last Day of Prior Year to Last Day of Year of Unvested Equity for Non-PEO NEOs ($) | Vesting- Date Fair Value of Equity Awards Granted During Year that Vested During Year for Non-PEO NEOs ($) | Change in Fair Value from Last Day of Prior Year to Vesting Date of Unvested Equity Awards that Vested During Year for Non-PEO NEOs ($) | Fair Value at Last Day of Prior Year of Equity Awards Forfeited During Year for Non-PEO NEOs ($) | Value of Dividends or Other Earnings Paid on Equity Awards Not Otherwise Included for Non- PEO NEOs ($) | Total – Inclusion of Equity Values for Non-PEO NEOs ($) | ||||||||||||||||
2025 | 924,573 | 12,305 | — | (148,115) | — | — | 788,763 | ||||||||||||||||
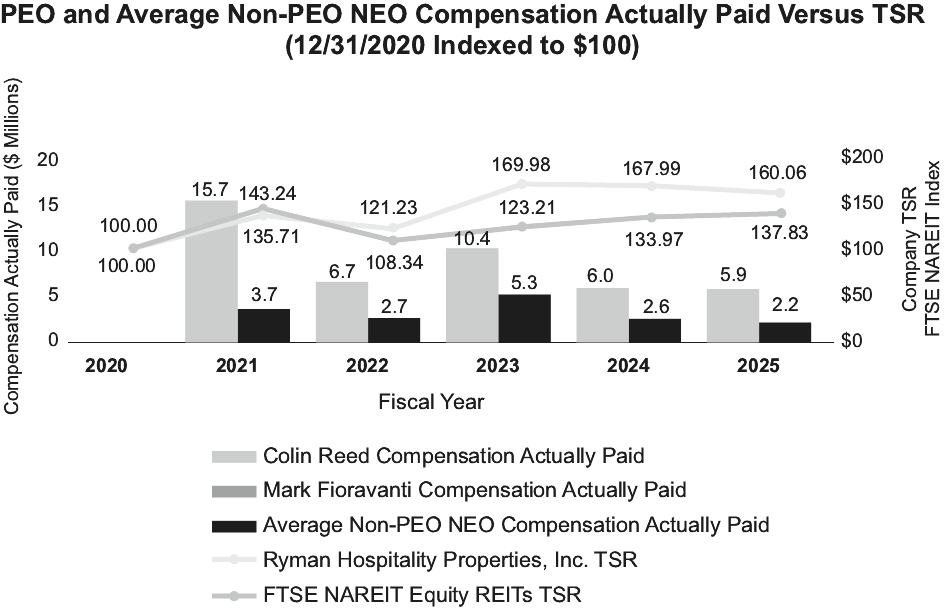
Relationship Between PEO and Non-PEO NEO Compensation Actually Paid, Company Total Shareholder Return (TSR) and Peer Group TSR
The following chart sets forth the relationship between Compensation Actually Paid to our PEOs, the average of Compensation Actually Paid to our non-PEO NEOs, the company’s cumulative TSR over the five most recently completed fiscal years, and the cumulative TSR for the FTSE NAREIT Equity REITs Index over same period.
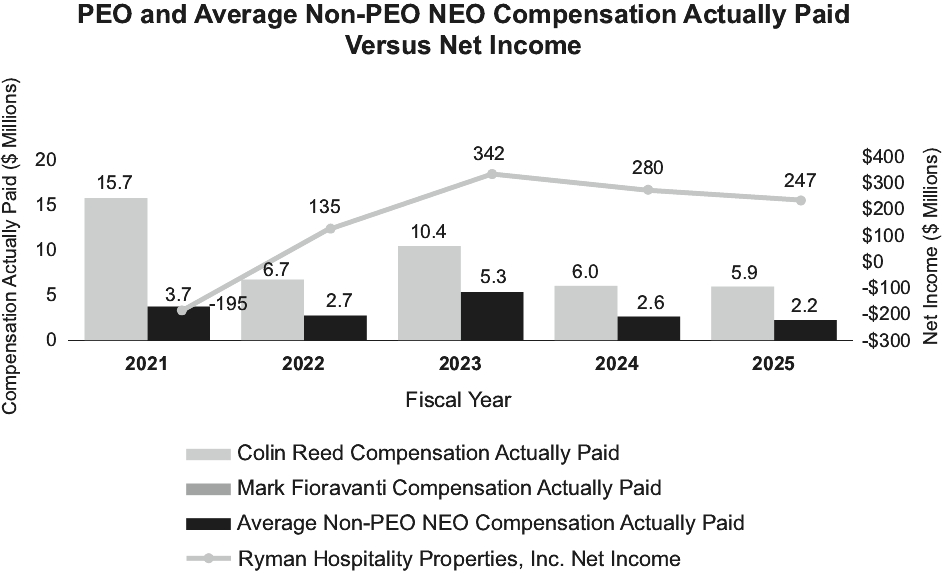
Relationship Between PEO and Non-PEO NEO Compensation Actually Paid and Net Income
The following chart sets forth the relationship between Compensation Actually Paid to our PEOs, the average of Compensation Actually Paid to our non-PEO NEOs, and the company’s net income during the five most recently completed fiscal years.
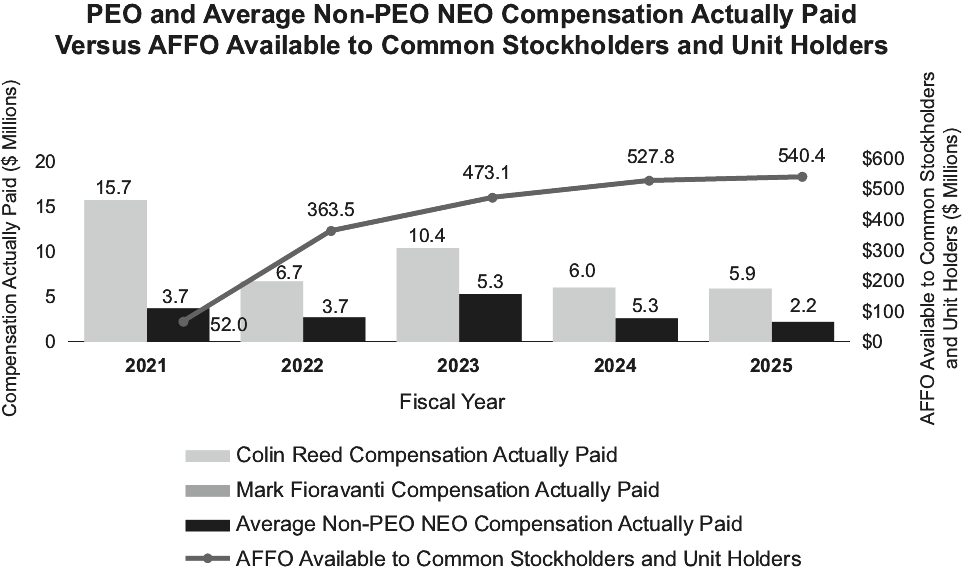
Relationship Between PEO and Average Non-PEO NEO Compensation Actually Paid and AFFO Available to Common Stockholders and Unit Holders
The following chart sets forth the relationship between Compensation Actually Paid to our PEOs, the average of Compensation Actually Paid to our non-PEO NEOs, and the company’s AFFO available to common stockholders and unit holders during the five most recently completed fiscal years.
Relationship Between PEO and Non-PEO NEO Compensation Actually Paid, Company Total Shareholder Return (TSR) and Peer Group TSR
The following chart sets forth the relationship between Compensation Actually Paid to our PEOs, the average of Compensation Actually Paid to our non-PEO NEOs, the company’s cumulative TSR over the five most recently completed fiscal years, and the cumulative TSR for the FTSE NAREIT Equity REITs Index over same period.
Tabular List of Most Important Financial Performance Measures
The following table presents the financial performance measures that the company considers to have been the most important in linking Compensation Actually Paid to our PEO and our non-PEO NEOs for 2025 to company performance. The measures in this table are not ranked.
Most Important Financial Performance Measures | ||
AFFO Available to Common Stockholders and Unit Holders | ||
Total Consolidated Revenue | ||
Consolidated Adjusted EBITDAre Margin | ||
Relative TSR (Outperformance of 2025 Compensation Peer Group) | ||
Relative TSR (Outperformance of Identified Companies within the FTSE NAREIT Lodging Resorts Index) | ||
The amounts in the Inclusion of Equity Values in the tables above are derived from the amounts set forth in the following tables.
Year | Year-End Fair Value of Equity Awards Granted During Year That Remained Unvested as of Last Day of Year for PEO ($) | Change in Fair Value from Last Day of Prior Year to Last Day of Year of Unvested Equity for PEO ($) | Vesting- Date Fair Value of Equity Awards Granted During Year that Vested During Year for PEO ($) | Change in Fair Value from Last Day of Prior Year to Vesting Date of Unvested Equity Awards that Vested During Year for PEO ($) | Fair Value at Last Day of Prior Year of Equity Awards Forfeited During Year for PEO ($) | Value of Dividends or Other Earnings Paid on Equity Awards Not Otherwise Included for PEO ($) | Total – Inclusion of Equity Values for PEO ($) | ||||||||||||||||
2025 | 3,268,832 | 28,098 | — | (314,305) | — | — | 2,982,625 | ||||||||||||||||
Year | Average Year-End Fair Value of Equity Awards Granted During Year That Remained Unvested as of Last Day of Year for Non-PEO NEOs ($) | Change in Fair Value from Last Day of Prior Year to Last Day of Year of Unvested Equity for Non-PEO NEOs ($) | Vesting- Date Fair Value of Equity Awards Granted During Year that Vested During Year for Non-PEO NEOs ($) | Change in Fair Value from Last Day of Prior Year to Vesting Date of Unvested Equity Awards that Vested During Year for Non-PEO NEOs ($) | Fair Value at Last Day of Prior Year of Equity Awards Forfeited During Year for Non-PEO NEOs ($) | Value of Dividends or Other Earnings Paid on Equity Awards Not Otherwise Included for Non- PEO NEOs ($) | Total – Inclusion of Equity Values for Non-PEO NEOs ($) | ||||||||||||||||
2025 | 924,573 | 12,305 | — | (148,115) | — | — | 788,763 | ||||||||||||||||
(5) | We determined Adjusted Funds from Operations (AFFO) available to common stockholders and unit holders to be the most important financial performance measure used to link company performance to Compensation Actually Paid to our PEO and non-PEO NEOs in 2025 since, as described in the Compensation Discussion and Analysis above, this metric represents the largest component of the financial performance goals established for our 2025 short-term cash incentive compensation plan. AFFO available to common stockholders and unit holders is a non-GAAP financial measure. For a definition of AFFO available to common stockholders and unit holders and a reconciliation of this non-GAAP financial measure to consolidated net income (the most comparable GAAP financial measure), and an explanation of why we believe AFFO available to common stockholders and unit holders presents useful information to investors, see Appendix A. |