Pay Versus Performance
The following table sets forth the information that shows the relationship between compensation and performance for 2025, 2024 and 2023 of the Company’s NEOs.
|
Year |
Summary Compensation Table Total for Ryan Hummer (CEO) ($) |
Compensation Actually Paid for Ryan Hummer (CEO) ($)(1) |
Average Summary Compensation Table Total for Non-CEO NEOs ($)(2) |
Average Compensation Actually Paid for Non-CEO NEOs ($)(3) |
Value of Initial Fixed $100 Investment Based on Total Shareholder Return ($)(4) |
Net Income (Loss) Attributable to the Company ($)(5) |
||||||||||||||||||
|
2025 |
1,893,018 | 3,926,003 | 1,087,678 | 1,940,399 | 157.96 | 23,748,000 | ||||||||||||||||||
|
2024 |
1,717,052 | 2,662,494 | 1,124,776 | 1,534,796 | 103.84 | 6,593,000 | ||||||||||||||||||
|
2023 |
465,732 | (312,005 | ) | 713,127 | 463,383 | 71.40 | (3,153,000 | ) | ||||||||||||||||
|
(1) |
The dollar amounts reported in this column represent the amount of “compensation actually paid” to Mr. Hummer, as computed in accordance with Item 402(v) of Regulation S-K. The dollar amounts do not reflect the actual amount of compensation earned by or paid to Mr. Hummer during the applicable year. In accordance with the requirements of Item 402(v) of Regulation S-K, the following adjustments were made to Mr. Hummer’s 2025, 2024 and 2023 total compensation to determine the compensation actually paid: |
|
Year |
Reported Summary Compensation Table Total |
Reported Value of Stock Awards ($)(a) |
Stock Award Adjustments ($)(b) |
Compensation Actually Paid ($) |
||||||||||||
|
2025 |
1,893,018 | (707,034 | ) | 2,740,019 | 3,926,003 | |||||||||||
|
2024 |
1,717,052 | (716,263 | ) | 1,661,705 | 2,662,494 | |||||||||||
|
2023 |
465,732 | — | (777,737 | ) | (312,005 | ) | ||||||||||
|
a. |
The grant date fair value of equity awards represents the total of the amounts reported in the “Stock Awards” column in the Summary Compensation Table for the applicable year. |
|
b. |
The amounts deducted or added in calculating the stock award adjustments are as follows: |
|
Year |
Year End Fair Value of Stock Awards Granted in the Year($) |
Year over Year Change in Fair Value of Outstanding and Unvested Stock Awards ($) |
Change in Fair Value of Vested Stock Awards Compared to Prior Year ($) |
Fair Value at the End of Prior Year Stock Awards that Failed to Meet Vesting Conditions in the Year ($) |
||||||||||||
|
2025 |
1,334,827 | 1,305,197 | 99,995 | — | ||||||||||||
|
2024 |
1,309,718 | 369,355 | (3,801 | ) | (13,567 | ) | ||||||||||
|
2023 |
— | (614,502 | ) | (99,286 | ) | (63,949 | ) | |||||||||
|
(2) |
Represents the average of the amounts reported for the Company’s NEOs as a group (excluding our Chief Executive Officer) in the “Total” column of the Summary Compensation Table in each applicable year. The names of each NEO included for purposes of calculating the average amounts in each applicable year are as follows: (i) for 2025, Messrs. Willems and Morrison were the Chief Operations Officer (COO) and Chief Financial Officer (CFO), respectively, (ii) for 2024, Messrs. Willems and Morrison were the Chief Operations Officer (COO) and Chief Financial Officer (CFO), respectively, and (iii) for 2023, Messrs. Willems, Lev and King were the Chief Operations Officer (COO), Executive Vice President, General Counsel (GC) and former Chief Technology Officer (CTO), respectively. |
|
(3) |
The dollar amounts reported in this column represent the average amount of “compensation actually paid” to the NEOs as a group (excluding our Chief Executive Officer), as computed in accordance with Item 402(v) of Regulation S-K. The dollar amounts do not reflect the actual amount of compensation earned by or paid to the NEOs (excluding our Chief Executive Officer) during the applicable year. In accordance with the requirements of Item 402(v) of Regulation S-K, the following adjustments were made to the NEOs (excluding our Chief Executive Officer) listed in footnote (2) above total compensation each year to determine the compensation actually paid as group: |
|
Year |
Reported Summary Compensation Table Total |
Reported Value of Stock Awards ($)(a) |
Stock Award Adjustments ($)(b) |
Compensation Actually Paid ($) |
||||||||||||
|
2025 |
1,087,678 | (316,418 | ) | 1,169,139 | 1,940,399 | |||||||||||
|
a. |
The grant date fair value of equity awards represents the total of the amounts reported in the “Stock Awards” column in the Summary Compensation Table for the applicable year. |
|
b. |
The amounts deducted or added in calculating the stock award adjustments are as follows: |
|
Year |
Year End Fair Value of Stock Awards Granted in the Year($) |
Year over Year Change in Fair Value of Outstanding and Unvested Stock Awards ($) |
Change in Fair Value of Vested Stock Awards Compared to Prior Year ($) |
Fair Value at the End of Prior Year Stock Awards that Failed to Meet Vesting Conditions in the Year ($) |
||||||||||||
|
2025 |
597,370 | 545,728 | 26,041 | — | ||||||||||||
|
(4) |
Cumulative TSR is calculated by dividing the sum of the cumulative amount of dividends for the measurement period, assuming dividend reinvestment, and the difference between the Company’s share price from the beginning to the end of the measurement period by the Company’s share price at the beginning of the measurement period. |
|
(5) |
Reflects the amount of net income or loss reported in the Company’s audited financial statements for the applicable year. |
The Company’s compensation program for its named executive officers has been thoughtfully designed to support the Company’s long-term business strategies and drive creation of stockholder value. The Company’s annual cash incentive bonus was measured based on the generation of Adjusted EBITDA, a measure of profitability, for the year as well as a personal performance component, which depended on the executive’s achievement of personal goals. The annual cash incentive bonus contained a minimum level requirement whereby if the minimum level is not met, there would be no annual cash incentive award earned for the Company component, and a maximum level cap of 200% of the target bonus. The Company’s long-term incentive awards consist of restricted stock units, equivalent stock units and performance stock unit awards, which reward the named executive officers for financial returns, absolute stock price appreciation, and relative shareholder return performance. Performance stock units are tied to the Company’s TSR relative to the TSR performance of the peer group over a specified period of three years.
|
Year |
Reported Summary Compensation Table Total |
Reported Value of Stock Awards ($)(a) |
Stock Award Adjustments ($)(b) |
Compensation Actually Paid ($) |
||||||||||||
|
2025 |
1,893,018 | (707,034 | ) | 2,740,019 | 3,926,003 | |||||||||||
|
2024 |
1,717,052 | (716,263 | ) | 1,661,705 | 2,662,494 | |||||||||||
|
2023 |
465,732 | — | (777,737 | ) | (312,005 | ) | ||||||||||
|
a. |
The grant date fair value of equity awards represents the total of the amounts reported in the “Stock Awards” column in the Summary Compensation Table for the applicable year. |
|
b. |
The amounts deducted or added in calculating the stock award adjustments are as follows: |
|
Year |
Year End Fair Value of Stock Awards Granted in the Year($) |
Year over Year Change in Fair Value of Outstanding and Unvested Stock Awards ($) |
Change in Fair Value of Vested Stock Awards Compared to Prior Year ($) |
Fair Value at the End of Prior Year Stock Awards that Failed to Meet Vesting Conditions in the Year ($) |
||||||||||||
|
2025 |
1,334,827 | 1,305,197 | 99,995 | — | ||||||||||||
|
2024 |
1,309,718 | 369,355 | (3,801 | ) | (13,567 | ) | ||||||||||
|
2023 |
— | (614,502 | ) | (99,286 | ) | (63,949 | ) | |||||||||
|
(2) |
Represents the average of the amounts reported for the Company’s NEOs as a group (excluding our Chief Executive Officer) in the “Total” column of the Summary Compensation Table in each applicable year. The names of each NEO included for purposes of calculating the average amounts in each applicable year are as follows: (i) for 2025, Messrs. Willems and Morrison were the Chief Operations Officer (COO) and Chief Financial Officer (CFO), respectively, (ii) for 2024, Messrs. Willems and Morrison were the Chief Operations Officer (COO) and Chief Financial Officer (CFO), respectively, and (iii) for 2023, Messrs. Willems, Lev and King were the Chief Operations Officer (COO), Executive Vice President, General Counsel (GC) and former Chief Technology Officer (CTO), respectively. |
|
(3) |
The dollar amounts reported in this column represent the average amount of “compensation actually paid” to the NEOs as a group (excluding our Chief Executive Officer), as computed in accordance with Item 402(v) of Regulation S-K. The dollar amounts do not reflect the actual amount of compensation earned by or paid to the NEOs (excluding our Chief Executive Officer) during the applicable year. In accordance with the requirements of Item 402(v) of Regulation S-K, the following adjustments were made to the NEOs (excluding our Chief Executive Officer) listed in footnote (2) above total compensation each year to determine the compensation actually paid as group: |
|
Year |
Reported Summary Compensation Table Total |
Reported Value of Stock Awards ($)(a) |
Stock Award Adjustments ($)(b) |
Compensation Actually Paid ($) |
||||||||||||
|
2025 |
1,087,678 | (316,418 | ) | 1,169,139 | 1,940,399 | |||||||||||
|
a. |
The grant date fair value of equity awards represents the total of the amounts reported in the “Stock Awards” column in the Summary Compensation Table for the applicable year. |
|
b. |
The amounts deducted or added in calculating the stock award adjustments are as follows: |
|
Year |
Year End Fair Value of Stock Awards Granted in the Year($) |
Year over Year Change in Fair Value of Outstanding and Unvested Stock Awards ($) |
Change in Fair Value of Vested Stock Awards Compared to Prior Year ($) |
Fair Value at the End of Prior Year Stock Awards that Failed to Meet Vesting Conditions in the Year ($) |
||||||||||||
|
2025 |
597,370 | 545,728 | 26,041 | — | ||||||||||||
|
(4) |
Cumulative TSR is calculated by dividing the sum of the cumulative amount of dividends for the measurement period, assuming dividend reinvestment, and the difference between the Company’s share price from the beginning to the end of the measurement period by the Company’s share price at the beginning of the measurement period. |
|
(5) |
Reflects the amount of net income or loss reported in the Company’s audited financial statements for the applicable year. |
The Company’s compensation program for its named executive officers has been thoughtfully designed to support the Company’s long-term business strategies and drive creation of stockholder value. The Company’s annual cash incentive bonus was measured based on the generation of Adjusted EBITDA, a measure of profitability, for the year as well as a personal performance component, which depended on the executive’s achievement of personal goals. The annual cash incentive bonus contained a minimum level requirement whereby if the minimum level is not met, there would be no annual cash incentive award earned for the Company component, and a maximum level cap of 200% of the target bonus. The Company’s long-term incentive awards consist of restricted stock units, equivalent stock units and performance stock unit awards, which reward the named executive officers for financial returns, absolute stock price appreciation, and relative shareholder return performance. Performance stock units are tied to the Company’s TSR relative to the TSR performance of the peer group over a specified period of three years.
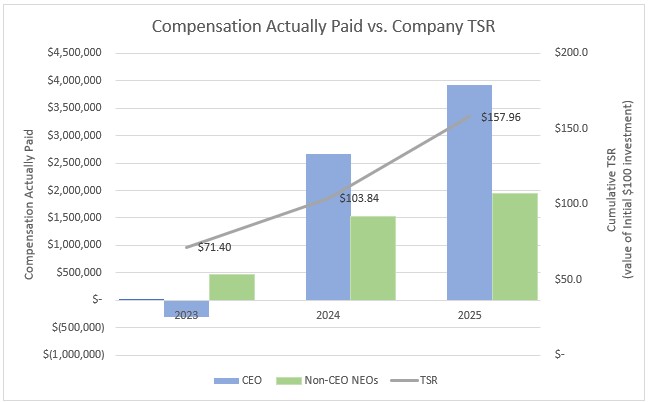
As demonstrated by the following graph, the amount of compensation actually paid to Mr. Hummer is aligned with the Company’s cumulative TSR over the three-year period presented. The average amount of compensation actually paid to the Company’s NEOs as a group (excluding the Chief Executive Officer) is also positively correlated with the Company's cumulative TSR, though to a lesser degree. This alignment reflects the fact that a significant portion of the compensation actually paid to the NEOs is comprised of equity awards, where the value of the award is either directly based on absolute stock appreciation, in the case of restricted stock units and equivalent stock units, or relative shareholder return, in the case of performance stock units, that is less impacted by absolute Company TSR. However, this alignment is tempered because the change in fair value of performance stock unit awards is largely dependent on the relative shareholder return versus a peer group, which could mean that the value of the award increases even when Company TSR decreases.
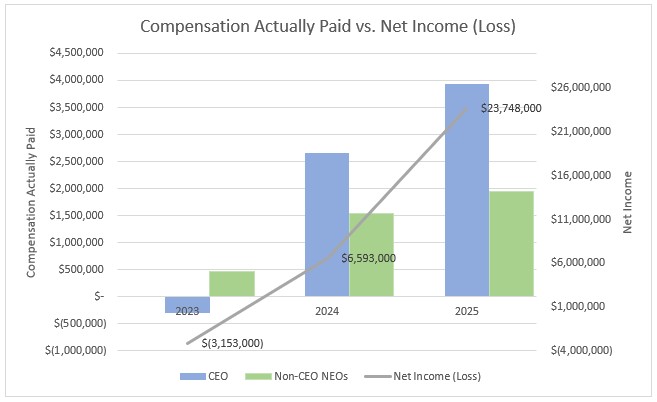
As demonstrated by the following graph, the amount of compensation actually paid to Mr. Hummer, our Chief Executive Officer, and the average amount of compensation actually paid to the Company’s NEOs as a group (excluding the Chief Executive Officer) is positively correlated with the Company’s net income (loss) over the three years presented in the table. This correlation is driven in part by the annual cash incentive bonus, which is based on Adjusted EBITDA, a measure that is generally correlated with net income (loss). For 2025, based on the personal component and company component achievement, the executives earned a bonus at a level above the target level; for 2024, based on the personal component and company component achievement, the executives earned a bonus at a level above the target level; and for 2023, the Company did not meet the minimum level requirement, and thus no annual cash incentive award was earned by executives. However, as described above, compensation actually paid also depends on the change in value of the equity awards, where the value of the award is either more directly based on absolute stock appreciation, in the case of restricted stock units and equivalent stock units, or relative shareholder return, in the case of performance stock units.