Pay vs Performance Disclosure
Dec. 31, 2025
USD ($)
Dec. 31, 2024
USD ($)
Dec. 31, 2023
USD ($)
Dec. 31, 2022
USD ($)
Dec. 31, 2021
USD ($)
| PAY VERSUS PERFORMANCE |
Year (1) |
Summary Compensation Table Total for PEO ($) (2) |
Compensation Actually Paid (CAP) to PEO ($) (3) |
Average Summary Compensation Table Total for Non-PEO NEOs ($) (2) |
Average Compensation Actually (CAP) Paid to Non-PEO NEOs ($) (3) |
Value of Initial Fixed $100 Investment Based on: (4) |
Net Income ($ in millions) |
rTSR against Constituents of the MSCI China Consumer Discretionary Index (6) | |||||||||||||||||||||||||||||||||
Total Shareholder Return ($) (4) |
MSCI China Consumer Discretionary Index Total Shareholder Return ($) (5) | |||||||||||||||||||||||||||||||||||||||
(a) |
(b) |
(c) |
(d) |
(e) |
(f) |
(g) |
(h) |
(i) | ||||||||||||||||||||||||||||||||
2025 |
19,591,868 | 18,758,979 | 3,184,847 | 3,130,230 | 89 | 57 | 929 | 31.7 | % | |||||||||||||||||||||||||||||||
2024 |
14,222,077 | 17,016,684 | 2,390,234 | 2,737,242 | 88 | 47 | 911 | 62.2 | % | |||||||||||||||||||||||||||||||
2023 |
20,335,792 | 9,041,796 | 3,392,452 | 1,569,060 | 76 | 42 | 827 | 36.2 | % | |||||||||||||||||||||||||||||||
2022 |
15,892,879 | 18,178,125 | 3,577,110 | 3,947,038 | 97 | 50 | 442 | 89.1 | % | |||||||||||||||||||||||||||||||
2021 |
16,555,672 | 6,689,317 | 3,737,910 | 2,243,769 | 88 | 65 | 990 | 36.9 | % | |||||||||||||||||||||||||||||||
(1) |
As required by Section 953(a) of the Dodd-Frank Wall Street Reform and Consumer Protection Act, and Item 402 (v) of Regulation S-K, we are providing the following information about the relationship between executive compensation actually paid and certain financial performance of the Company. For further information concerning the Company’s variable pay-for-performance PEO |
• |
2025: Adrian Ding, Warton Wang, Jeff Kuai and Duoduo (Howard) Huang. |
• |
2024: Adrian Ding, Warton Wang, Jeff Kuai, Leila Zhang and Andy Yeung. |
• |
2023: Andy Yeung, Warton Wang, Johnson Huang and Joseph Chan. |
• |
2022: Andy Yeung, Joseph Chan, Johnson Huang and Aiken Yuen. |
• |
2021: Andy Yeung, Johnson Huang, Joseph Chan, Aiken Yuen and Danny Tan. |
(2) |
Amounts reported in this column represent (i) the total compensation reported in the Summary Compensation Table for the applicable year in the case of Ms. Wat and (ii) the average of the total compensation reported in the Summary Compensation Table for the applicable year for the Company’s NEOs reported for the applicable year other than Ms. Wat. |
(3) |
To calculate compensation actually paid, adjustments were made to the amounts reported in the Summary Compensation Table for the applicable year. The dollar amounts do not reflect the actual amount of compensation earned by or paid to Ms. Wat during the applicable year, nor the actual average amount of compensation earned by or paid to the NEOs as a group (excluding Ms. Wat) during the applicable year. A reconciliation of the adjustments for Ms. Wat and for the average of the other NEOs is set forth following the footnotes to this table. |
(4) |
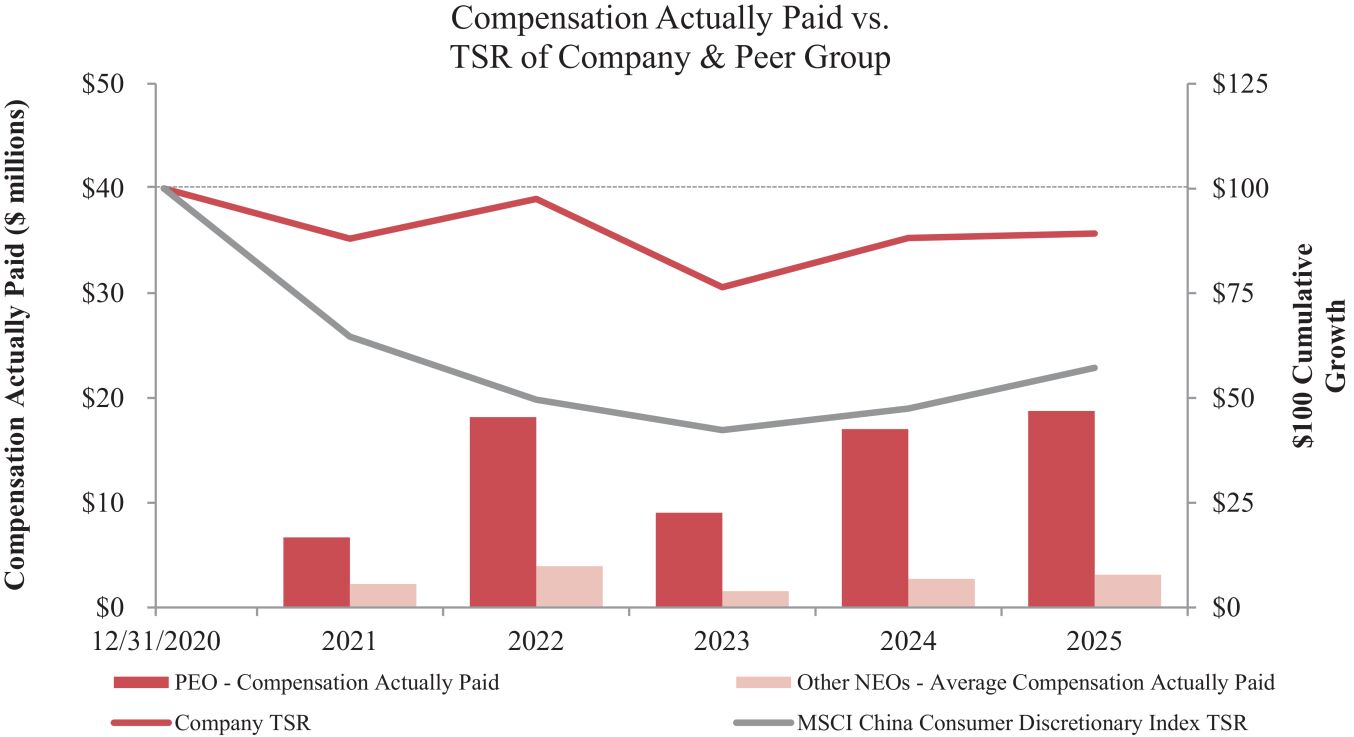
For each fiscal year, the amount included in the table is the cumulative total shareholder return as of the end of that year, assuming that the value of the investment in our common stock and peer group was $100 on December 31, 2020 and that all dividends were reinvested. Historic stock price performance is not necessarily indicative of future stock price performance. |
(5) |
The TSR Peer Group consists of the MSCI China Consumer Discretionary Index, which is a free-float adjusted market cap weighted gross total return index, based on MSCI’s Global Investable Market Indexes Methodology and an index referenced in our annual LTI program. |
(6) |
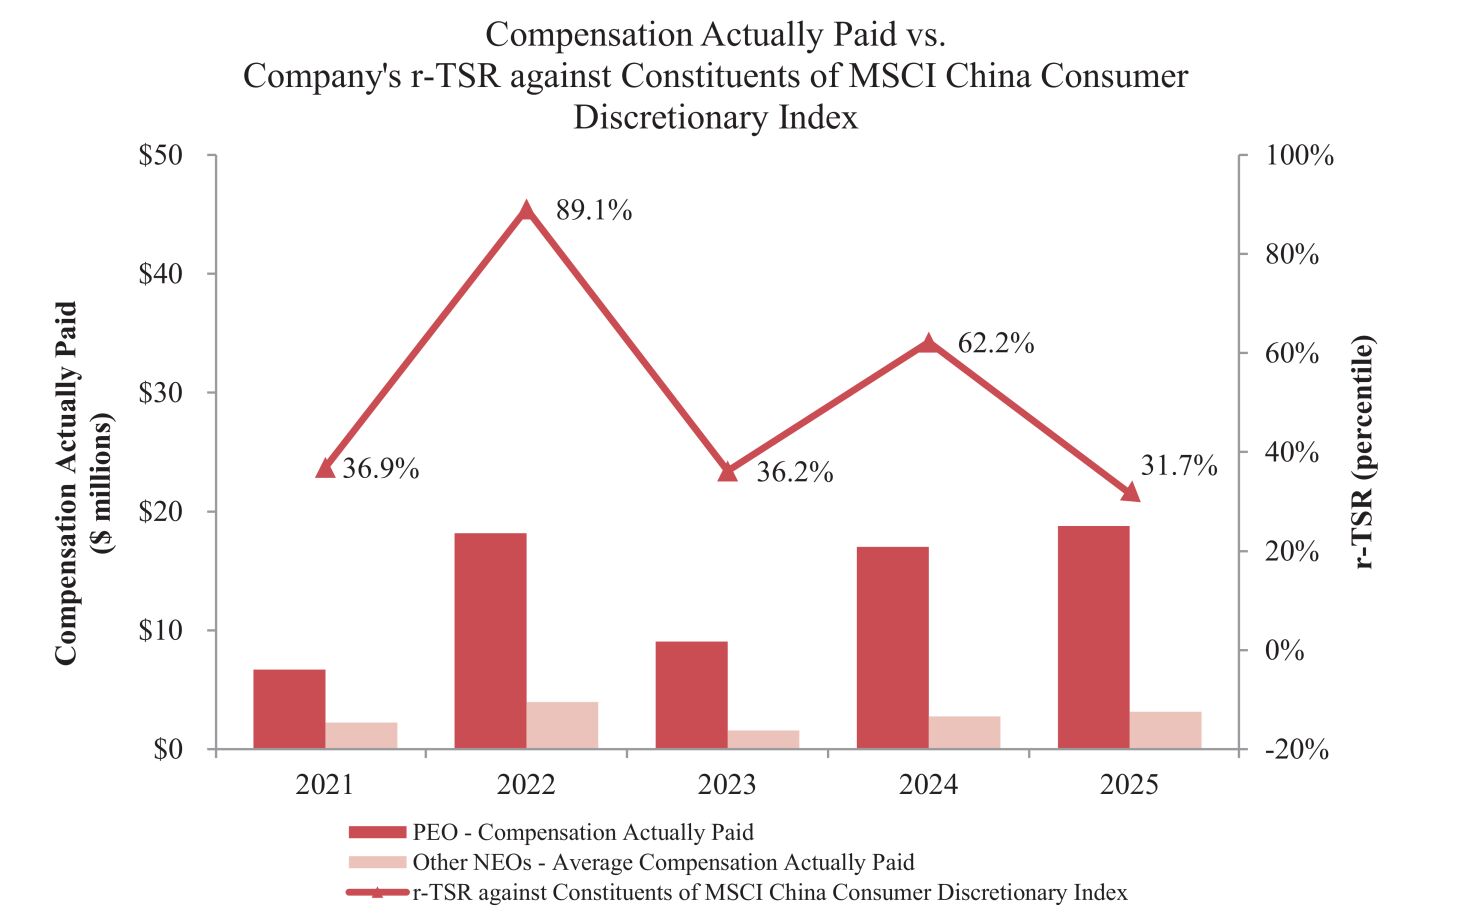
RTSR percentile ranking reported in this column measures performance for the applicable year. As noted in the CD&A, our rTSR percentile ranking against the constituents of the MSCI China Consumer Discretionary Index was utilized as a component in the 2025 Annual PSU Awards, and is viewed as the most important measure by the Company to link pay and performance. |
Compensation Actually Paid Adjustments (1) | ||||||||||||||||||||||||||||||||||||||||
Year |
Summary Compensation Table (SCT) Total ($) (2) |
Minus Value of Stock Option/ SAR and Stock Awards Reported in SCT ($) (3) |
Plus Fair Value at Fiscal Year-End ofOutstanding and Unvested Stock Option/SAR and Stock Awards Granted in Fiscal Year ($) (4) |
Plus/(Minus) Change in Fair Value of Outstanding and Unvested Stock Option/SAR and Stock Awards Granted in Prior Fiscal Years ($) (5) |
Plus Fair Value at Vesting of Stock Option/ SAR and Stock Awards Granted in Fiscal Year that Vested During Fiscal Year ($) (6) |
Plus/(Minus) Change in Fair Value as of Vesting Date of Stock Option/SAR and Stock Awards Granted in Prior Fiscal Years for which Applicable Vesting Conditions Were Satisfied During Fiscal Year ($) (7) |
Minus Fair Value as of Prior Fiscal Year-End of Stock Option/ SAR and Stock Awards Granted in Prior Fiscal Years that Failed to Meet Applicable Vesting Conditions During Fiscal Year ($) (8) |
Equals Compensation Actually Paid ($) | ||||||||||||||||||||||||||||||||
Joey Wat |
||||||||||||||||||||||||||||||||||||||||
2025 |
19,591,868 | 10,654,832 | 11,144,068 | (528,170 | ) | — | (793,955 | ) | — | 18,758,979 | ||||||||||||||||||||||||||||||
2024 |
14,222,077 | 10,000,081 | 11,173,884 | 1,587,107 | — | 33,697 | — | 17,016,684 | ||||||||||||||||||||||||||||||||
2023 |
20,335,792 | 10,000,132 | 6,436,699 | (4,405,524 | ) | — | (3,325,039 | ) | — | 9,041,796 | ||||||||||||||||||||||||||||||
2022 |
15,892,879 | 9,285,127 | 8,595,753 | 2,864,570 | — | 110,050 | — | 18,178,125 | ||||||||||||||||||||||||||||||||
2021 |
16,555,672 | 8,703,924 | 6,661,504 | (7,555,976 | ) | — | (267,959 | ) | — | 6,689,317 | ||||||||||||||||||||||||||||||
Other NEOs (9) |
||||||||||||||||||||||||||||||||||||||||
2025 |
3,184,847 | 1,351,996 | 1,419,652 | (48,722 | ) | — | (73,551 | ) | — | 3,130,230 | ||||||||||||||||||||||||||||||
2024 |
2,390,234 | 1,270,081 | 1,419,166 | 215,882 | — | (17,959 | ) | — | 2,737,242 | |||||||||||||||||||||||||||||||
2023 |
3,392,452 | 1,500,086 | 965,547 | (864,490 | ) | — | (424,363 | ) | — | 1,569,060 | ||||||||||||||||||||||||||||||
2022 |
3,577,110 | 1,751,225 | 1,606,822 | 500,217 | — | 14,114 | — | 3,947,038 | ||||||||||||||||||||||||||||||||
2021 |
3,737,910 | 1,772,973 | 1,374,102 | (1,160,113 | ) | — | 64,843 | — | 2,243,769 | |||||||||||||||||||||||||||||||
(1) |
This table excludes any YUM shares received by the NEOs upon conversion of their outstanding YUM equity awards in connection with the spin-off. |
(2) |
Represents Total Compensation as reported in the Summary Compensation Table for the indicated fiscal year. With respect to the other NEOs, amounts shown represent averages. |
(3) |
Represents the grant date fair value of the stock option/SAR awards and stock awards granted during the indicated fiscal year as reported in the Summary Compensation Table, computed in accordance with ASC 718. See Note 12 to the Consolidated Financial Statements included in the Annual Report on Form 10-K for the year ended December 31, 2025. |
(4) |
Represents the fair value as of the indicated fiscal year-end of the outstanding and unvested stock option/SAR awards and stock awards granted during such fiscal year, computed in accordance with ASC 718 and, for awards subject to performance-based vesting conditions, based on the probable outcome of such performance-based vesting conditions as of the last day of the fiscal year. Methodology adopted in calculating the fair value as of the indicated fiscal year-end is consistent with those used in calculating the grant date fair value and the relevant assumptions reflect the Company’s estimates based on historical data existing on each valuation date. |
(5) |
Represents the change in fair value during the indicated fiscal year of each stock option/SAR award and stock award that was granted in prior fiscal years and that remained outstanding and unvested as of the last day of the indicated fiscal year, computed in accordance with ASC 718 and, for awards subject to performance-based vesting conditions, based on the probable outcome of |
such performance-based vesting conditions as of the last day of the fiscal year. Methodology adopted in calculating the fair value as of the indicated fiscal year-end is consistent with those used in calculating the grant date fair value and the relevant assumptions reflect the Company’s estimates based on historical data existing on each valuation date. |
(6) |
Represents the fair value at vesting of the stock option/SAR awards and stock awards that were granted and vested during the indicated fiscal year. |
(7) |
Represents the change in fair value, measured from the prior fiscal year-end to the vesting date, of each stock option/SAR award and stock award that was granted in prior fiscal years and which vested during the indicated fiscal year, computed in accordance with ASC 718. |
(8) |
Represents the fair value as of the last day of the prior fiscal year of the stock option/SAR awards and stock awards that were granted in prior fiscal years which failed to meet the applicable vesting conditions in the indicated fiscal year, computed in accor-dance with ASC 718. |
(9) |
See footnote (1) on page 90 for the non-PEO NEOs included in the average for each fiscal year. |
• |
2025: Adrian Ding, Warton Wang, Jeff Kuai and Duoduo (Howard) Huang. |
• |
2024: Adrian Ding, Warton Wang, Jeff Kuai, Leila Zhang and Andy Yeung. |
• |
2023: Andy Yeung, Warton Wang, Johnson Huang and Joseph Chan. |
• |
2022: Andy Yeung, Joseph Chan, Johnson Huang and Aiken Yuen. |
• |
2021: Andy Yeung, Johnson Huang, Joseph Chan, Aiken Yuen and Danny Tan. |
Compensation Actually Paid Adjustments (1) | ||||||||||||||||||||||||||||||||||||||||
Year |
Summary Compensation Table (SCT) Total ($) (2) |
Minus Value of Stock Option/ SAR and Stock Awards Reported in SCT ($) (3) |
Plus Fair Value at Fiscal Year-End ofOutstanding and Unvested Stock Option/SAR and Stock Awards Granted in Fiscal Year ($) (4) |
Plus/(Minus) Change in Fair Value of Outstanding and Unvested Stock Option/SAR and Stock Awards Granted in Prior Fiscal Years ($) (5) |
Plus Fair Value at Vesting of Stock Option/ SAR and Stock Awards Granted in Fiscal Year that Vested During Fiscal Year ($) (6) |
Plus/(Minus) Change in Fair Value as of Vesting Date of Stock Option/SAR and Stock Awards Granted in Prior Fiscal Years for which Applicable Vesting Conditions Were Satisfied During Fiscal Year ($) (7) |
Minus Fair Value as of Prior Fiscal Year-End of Stock Option/ SAR and Stock Awards Granted in Prior Fiscal Years that Failed to Meet Applicable Vesting Conditions During Fiscal Year ($) (8) |
Equals Compensation Actually Paid ($) | ||||||||||||||||||||||||||||||||
Joey Wat |
||||||||||||||||||||||||||||||||||||||||
2025 |
19,591,868 | 10,654,832 | 11,144,068 | (528,170 | ) | — | (793,955 | ) | — | 18,758,979 | ||||||||||||||||||||||||||||||
2024 |
14,222,077 | 10,000,081 | 11,173,884 | 1,587,107 | — | 33,697 | — | 17,016,684 | ||||||||||||||||||||||||||||||||
2023 |
20,335,792 | 10,000,132 | 6,436,699 | (4,405,524 | ) | — | (3,325,039 | ) | — | 9,041,796 | ||||||||||||||||||||||||||||||
2022 |
15,892,879 | 9,285,127 | 8,595,753 | 2,864,570 | — | 110,050 | — | 18,178,125 | ||||||||||||||||||||||||||||||||
2021 |
16,555,672 | 8,703,924 | 6,661,504 | (7,555,976 | ) | — | (267,959 | ) | — | 6,689,317 | ||||||||||||||||||||||||||||||
Other NEOs (9) |
||||||||||||||||||||||||||||||||||||||||
2025 |
3,184,847 | 1,351,996 | 1,419,652 | (48,722 | ) | — | (73,551 | ) | — | 3,130,230 | ||||||||||||||||||||||||||||||
2024 |
2,390,234 | 1,270,081 | 1,419,166 | 215,882 | — | (17,959 | ) | — | 2,737,242 | |||||||||||||||||||||||||||||||
2023 |
3,392,452 | 1,500,086 | 965,547 | (864,490 | ) | — | (424,363 | ) | — | 1,569,060 | ||||||||||||||||||||||||||||||
2022 |
3,577,110 | 1,751,225 | 1,606,822 | 500,217 | — | 14,114 | — | 3,947,038 | ||||||||||||||||||||||||||||||||
2021 |
3,737,910 | 1,772,973 | 1,374,102 | (1,160,113 | ) | — | 64,843 | — | 2,243,769 | |||||||||||||||||||||||||||||||
(1) |
This table excludes any YUM shares received by the NEOs upon conversion of their outstanding YUM equity awards in connection with the spin-off. |
(2) |
Represents Total Compensation as reported in the Summary Compensation Table for the indicated fiscal year. With respect to the other NEOs, amounts shown represent averages. |
(3) |
Represents the grant date fair value of the stock option/SAR awards and stock awards granted during the indicated fiscal year as reported in the Summary Compensation Table, computed in accordance with ASC 718. See Note 12 to the Consolidated Financial Statements included in the Annual Report on Form 10-K for the year ended December 31, 2025. |
(4) |
Represents the fair value as of the indicated fiscal year-end of the outstanding and unvested stock option/SAR awards and stock awards granted during such fiscal year, computed in accordance with ASC 718 and, for awards subject to performance-based vesting conditions, based on the probable outcome of such performance-based vesting conditions as of the last day of the fiscal year. Methodology adopted in calculating the fair value as of the indicated fiscal year-end is consistent with those used in calculating the grant date fair value and the relevant assumptions reflect the Company’s estimates based on historical data existing on each valuation date. |
(5) |
Represents the change in fair value during the indicated fiscal year of each stock option/SAR award and stock award that was granted in prior fiscal years and that remained outstanding and unvested as of the last day of the indicated fiscal year, computed in accordance with ASC 718 and, for awards subject to performance-based vesting conditions, based on the probable outcome of |
such performance-based vesting conditions as of the last day of the fiscal year. Methodology adopted in calculating the fair value as of the indicated fiscal year-end is consistent with those used in calculating the grant date fair value and the relevant assumptions reflect the Company’s estimates based on historical data existing on each valuation date. |
(6) |
Represents the fair value at vesting of the stock option/SAR awards and stock awards that were granted and vested during the indicated fiscal year. |
(7) |
Represents the change in fair value, measured from the prior fiscal year-end to the vesting date, of each stock option/SAR award and stock award that was granted in prior fiscal years and which vested during the indicated fiscal year, computed in accordance with ASC 718. |
(8) |
Represents the fair value as of the last day of the prior fiscal year of the stock option/SAR awards and stock awards that were granted in prior fiscal years which failed to meet the applicable vesting conditions in the indicated fiscal year, computed in accor-dance with ASC 718. |
(9) |
See footnote (1) on page 90 for the non-PEO NEOs included in the average for each fiscal year. |
• |
The following graph demonstrates the relationship between compensation actually paid over the period to the PEO and other NEOs, and each of the Company cumulative TSR and the MSCI China Consumer Discretionary Index cumulative TSR. |
• |
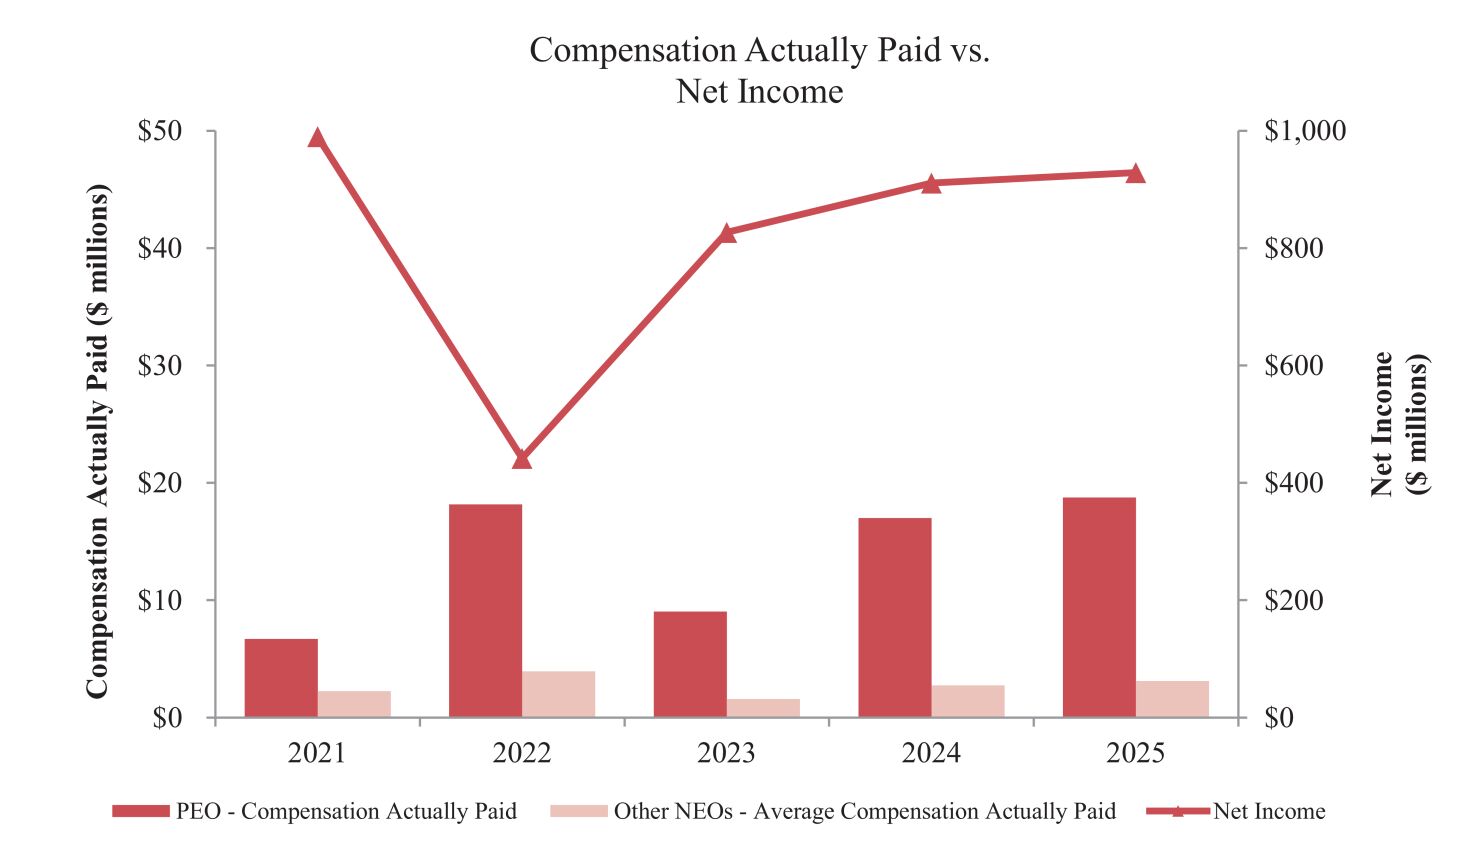
The following graph demonstrates the relationship between compensation actually paid over the period to the PEO and other NEOs and Net Income. |
• |
The following graph demonstrates the relationship between compensation actually paid over the period to the PEO and other NEOs and rTSR percentile ranking against the constituents of the MSCI China Consumer Discretionary Index. |
• |
The following graph demonstrates the relationship between compensation actually paid over the period to the PEO and other NEOs, and each of the Company cumulative TSR and the MSCI China Consumer Discretionary Index cumulative TSR. |
| Most Important Financial Performance Measures |
• rTSR against the constituents of the MSCI China Consumer Discretionary Index • rTSR against the constituents of the S&P 500 Consumer Discretionary Index • System Sales Growth • Return on Invested Capital • Adjusted Operating Profit Growth • Same-store Sales Growth • System Net New Builds |