Pay vs Performance Disclosure
Dec. 31, 2025
USD ($)
Summary Compensation Table Total for CEO ($) | Compensation Actually Paid to CEO ($)(1)(2) | Average Summary Compensation Table Total for Non-CEO NEOs ($) | Average Compensation Actually Paid to Non-CEO NEOs ($)(1)(2) | Year-End Value of $100 Invested on June 5, 2025 | Net Income (Loss) ($ in Millions) | Company Selected Measure: Adjusted EBITDA ($ in Millions) | ||
Year | Total Shareholder Return ($)(3) | Peer Group Total Shareholder Return ($)(4) | ||||||
2025 | 16,260,836 | 54,952,569 | 11,451,492 | 45,273,868 | 95.28 | 98.24 | (70) | 582 |
performance graph required by Item 201(e) of Regulation S-K included in the Annual Report. The custom peer group includes COIN, PYPL, V, MA,
XYZ, HOOD, and BLSH.
Compensation Table above. The amounts shown for CAP have been calculated in accordance with Item 402(v) of Regulation S-K and do not reflect
compensation actually earned, realized, or received by the CEO or non-CEO NEOs during 2025.
CEO Dec 31 2025 ($) | Average Non-CEO NEOs Dec 31, 2025 ($) | |
Summary Compensation Table Total for CEO | 16,260,836 | 11,451,492 |
Minus Grant Date Fair Value of Equity Awards in Summary Compensation Table | 8,999,974 | 9,426,957 |
Plus Year End Fair Value of Equity Awards Granted During Year That are Outstanding and Unvested at FYE | 22,904,298 | 16,593,700 |
Adjust for Year over Year Change in Fair Value of Outstanding and Unvested Equity Awards | 12,917,073 | 11,745,459 |
Adjust for Fair Value as of Vesting Date of Equity Awards Granted and Vested in the Year | — | 152,865 |
Adjust for Year over Year Change in Fair Value of Equity Awards Granted in Prior Years that Vested in the Year | 11,870,336 | 14,757,310 |
Equals Compensation Actually Paid | 54,952,569 | 45,273,868 |
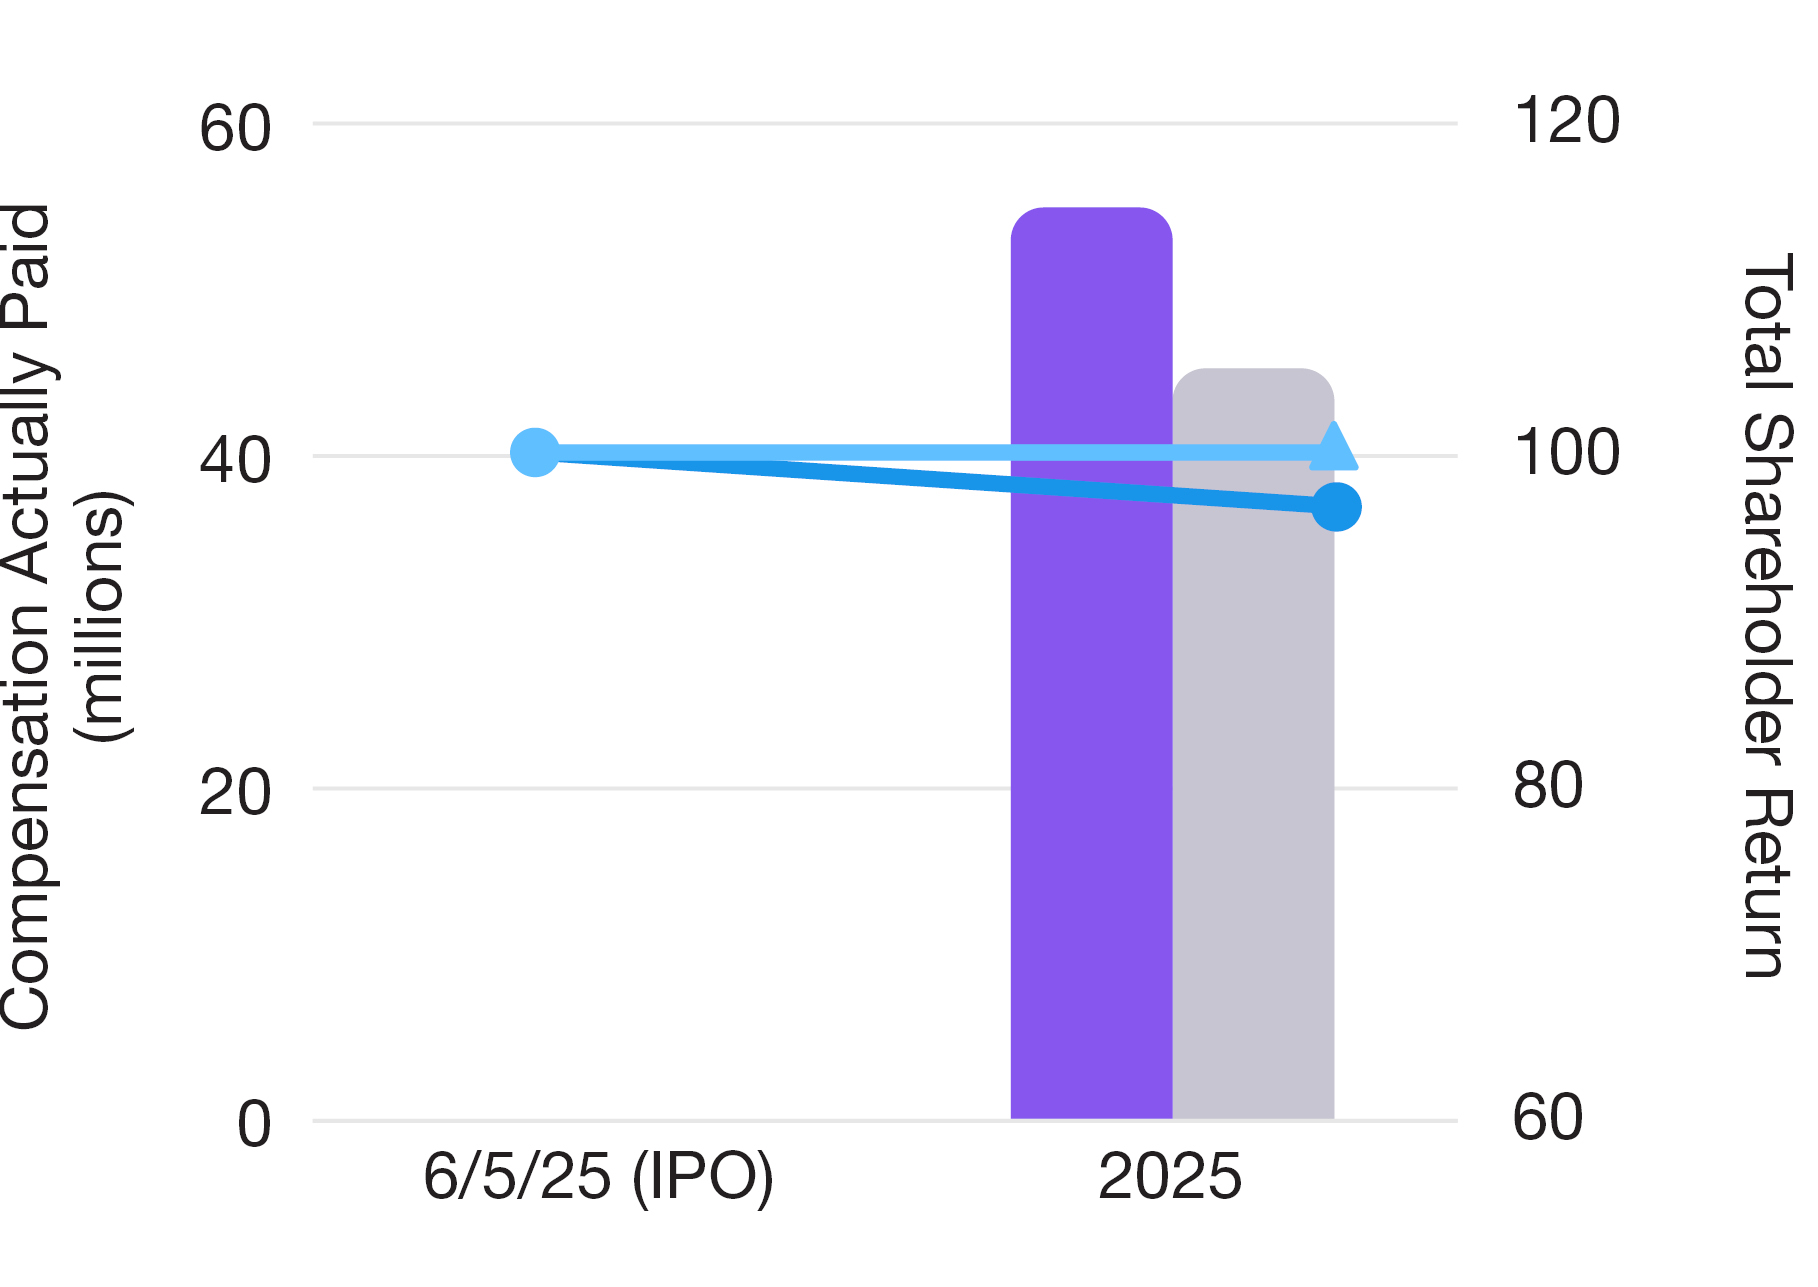
 | CEO CAP |  | Avg NEO CAP |  | CRCL TSR |  | PEER TSR |
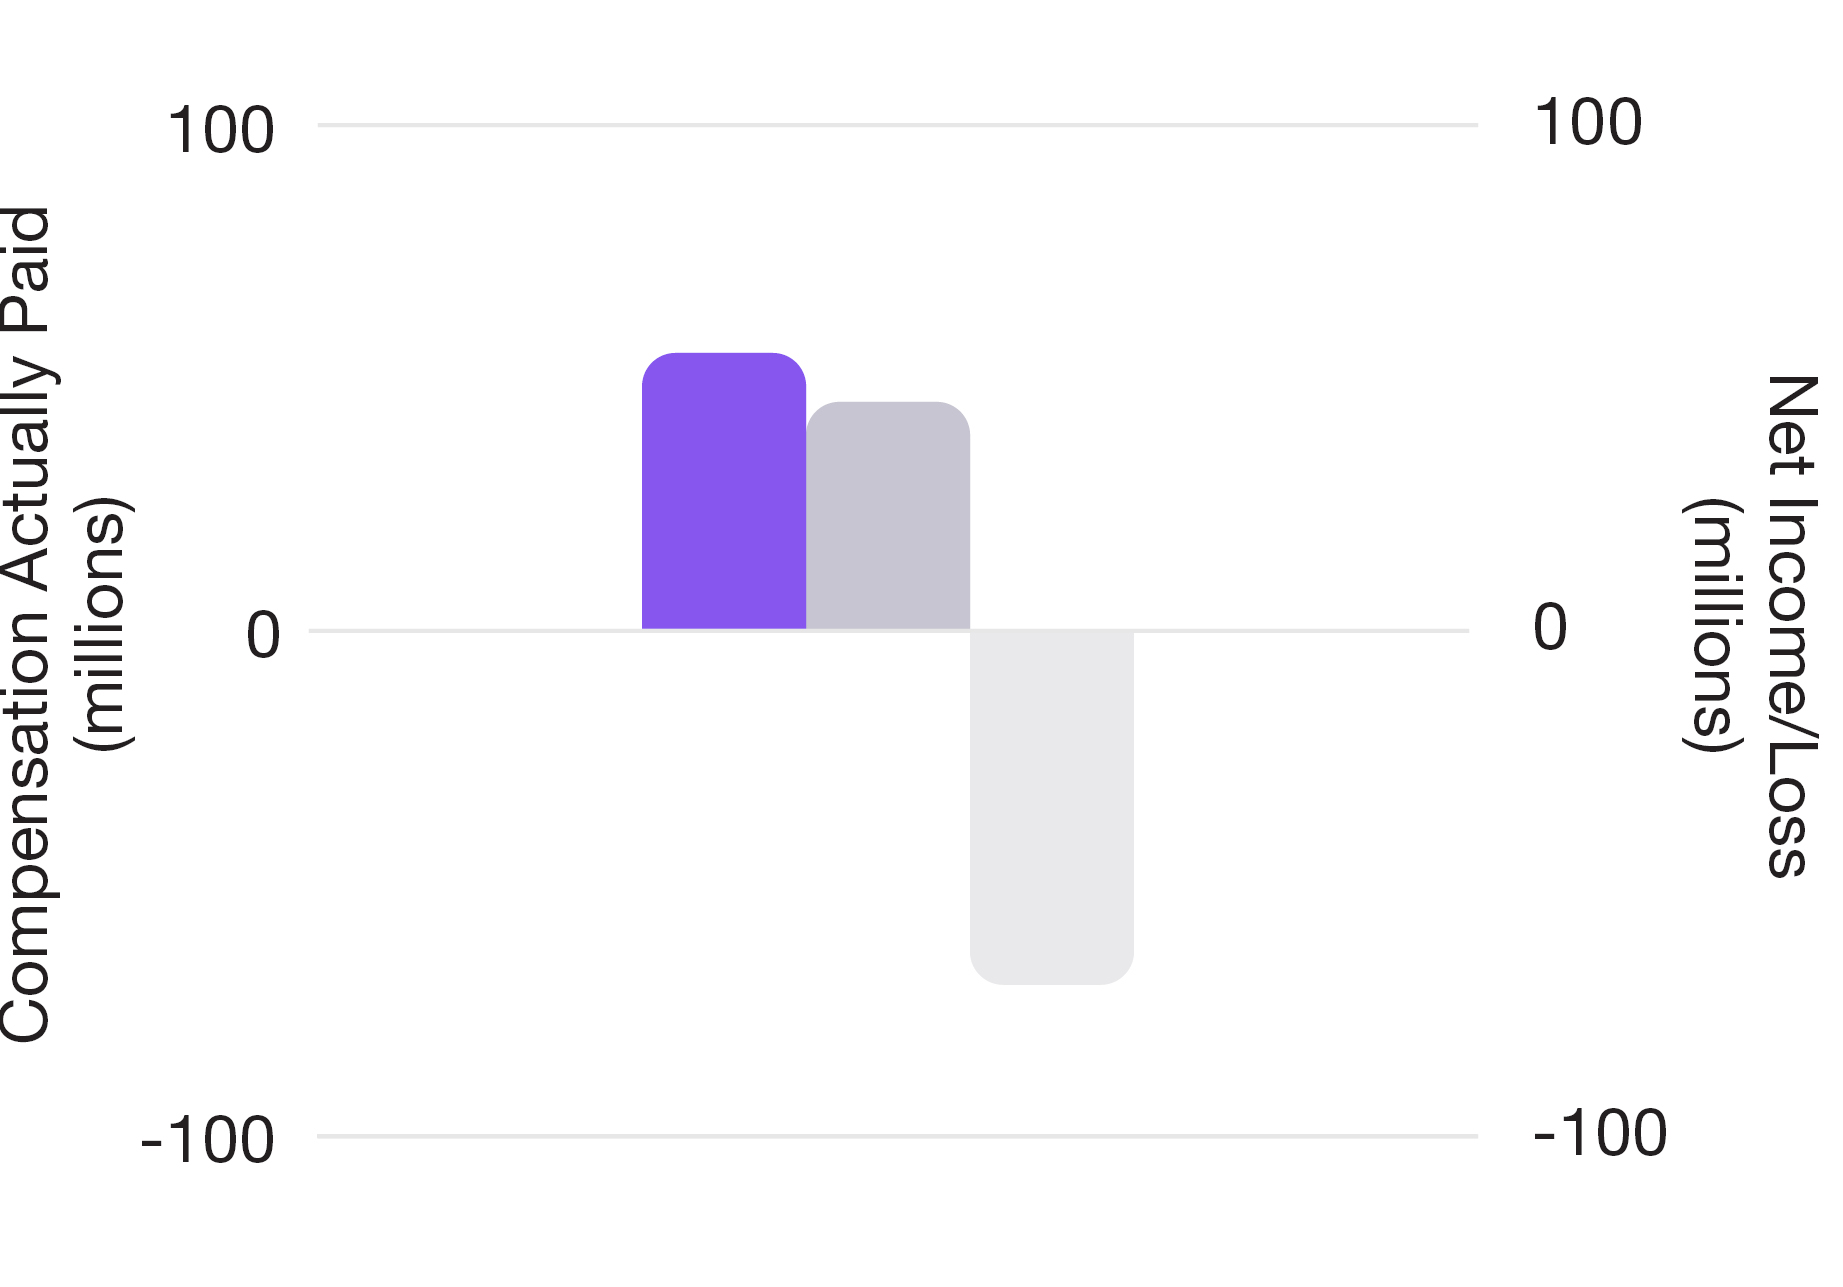
| CEO CAP | | Avg NEO CAP |  | Net Income/Loss |
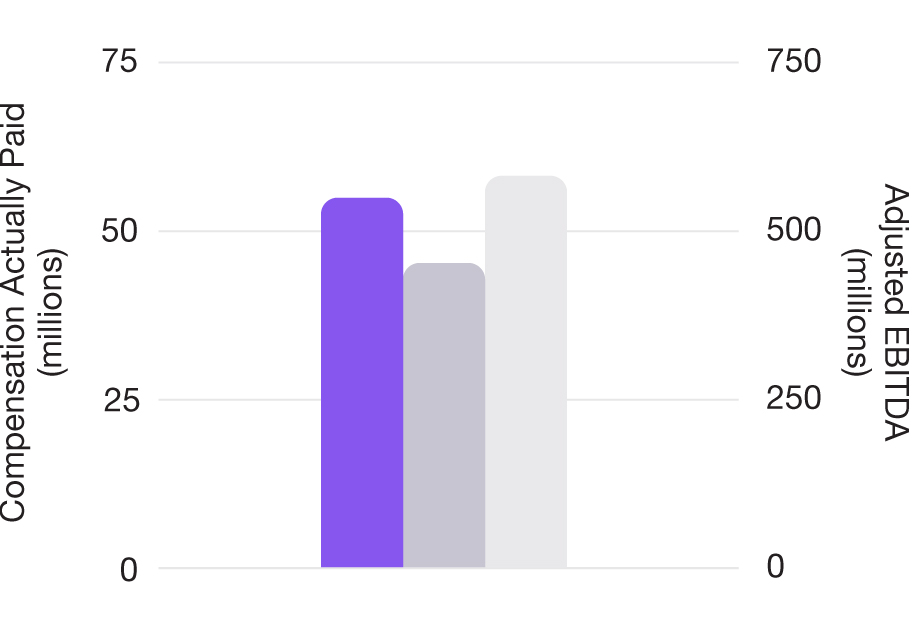
| CEO CAP | | Avg NEO CAP | | Adj EBITDA |
(1)See “Additional Information—Non-GAAP Financial Measures” for a reconciliation of Adjusted EBITDA to net income (loss) from
continuing operations.
| CEO CAP | | Avg NEO CAP | | CRCL TSR | | PEER TSR |
Adjusted EBITDA | ||
Stock Price | ||
Revenue | ||
grant date fair value under ASC 718.
Total Shareholder Return reflects the cumulative total return of an initial $100 investment in our Class A common stock, measured from June 5, 2025 (the date our Class A common stock began trading on the NYSE). Historical stock price performance is not necessarily indicative of future
stock price performance. There were no dividends or other earnings paid in the covered fiscal year.