Pay vs Performance Disclosure
Mar. 31, 2022
Dec. 31, 2022
Dec. 31, 2025
USD ($)
Dec. 31, 2024
USD ($)
Dec. 31, 2023
USD ($)
Dec. 31, 2022
USD ($)
Dec. 31, 2021
USD ($)
2025 Pay Versus Performance Table
In accordance with rules adopted by the SEC pursuant to the Dodd-Frank Wall Street Reform and Consumer Protection Act of 2010, we provide the following disclosure regarding the relationship between executive compensation to our NEOs and Company performance for the fiscal years listed below. In determining “compensation actually paid” to our NEOs, we are required to make various adjustments to amounts that have been previously reported in the Summary Compensation Table, as the valuation methods required by this disclosure differ from those required in reporting the compensation information in the Summary Compensation Table. For our NEOs other than our principal executive officer (“PEO”), compensation is reported as an average. The Compensation and Human Capital Committee did not consider the pay versus performance disclosure below in making its pay decisions for any
of
the years shown. Year |
Summary Compensation Table Total for PEO (1) |
Compensation Actually Paid to PEO (2)(3) |
Average Summary Compensation Table Total for Non-PEO NEOs (3) |
Average Compensation Actually Paidi to Non-PEO NEOs (3) |
Value of Initial Fixed $100 Investment Based on: |
Net Income ($000) (6) |
“Core” Diluted Earnings Per Share (7) | |||||||||||||||||||||||
Richard M. Adams |
Richard M. Adams, Jr. |
Richard M. Adams |
Richard M. Adams, Jr. |
Total Shareholder Return (4) |
Peer Group Shareholder Return (5) | |||||||||||||||||||||||||
2025 |
— | $6,140,650 | — | $7,022,966 | $3,613,947 | $4,084,792 | $145.17 | $149.15 | $464,603 | $3.27 | ||||||||||||||||||||
2024 |
— | $5,538,879 | — | $4,597,637 | $3,269,601 | $2,709,228 | $136.31 | $139.30 | $372,996 | $2.75 | ||||||||||||||||||||
2023 |
— | $4,399,095 | — | $3,717,513 | $2,792,448 | $2,253,400 | $130.80 | $115.53 | $366,313 | $2.78 | ||||||||||||||||||||
2022 |
$4,180,867 | $2,663,331 | $5,150,164 | $3,031,307 | $1,726,321 | $2,044,967 | $135.02 | $119.65 | $379,627 | $2.80 | ||||||||||||||||||||
2021 |
$4,629,578 | — | $6,285,498 | — | $1,769,377 | $2,144,686 | $116.35 | $142.91 | $367,738 | $2.96 | ||||||||||||||||||||
Footnotes:
| (1) | Richard M. Adams was our PEO for 2021 and from January 1, 2022 until March 31, 2022. Richard M. Adams, Jr. was our PEO for the remainder of 2022 and is our current PEO. The individuals comprising our other NEOs other than the PEO (the “Non-PEO NEOs”) for each year presented are listed below. |
2021 |
2022 |
2023-2025 | ||
Richard M. Adams, Jr. |
James J. Consagra, Jr. |
Richard M. Adams | ||
James J. Consagra, Jr. |
W. Mark Tatterson |
James J. Consagra, Jr. | ||
W. Mark Tatterson |
Jerold L. Rexroad |
W. Mark Tatterson | ||
Jerold L. Rexroad |
Darren K. Williams |
Darren K. Williams | ||
| (2) | The amounts shown for Compensation Actually Paid have been calculated in accordance with Item 402(v) of Regulation S-K and do not reflect compensation actually earned, realized, or received by the Company’s NEOs. These amounts reflect the Summary Compensation Table Total with certain adjustments as described in footnote 3 below. |
| (3) | Compensation Actually Paid reflects the exclusions and inclusions of certain amounts for the PEOs and the Non-PEO NEOs as set forth below. Equity values are calculated in accordance with FASB ASC Topic 718. Amounts in the Exclusion of Stock Awards and Option Awards column are the totals from the Stock Awards and Option Awards columns set forth in the Summary Compensation Table. Amounts in the Exclusion of Change in Pension Value column reflect the positive changes in the Pension Value reported in the Summary Compensation Table. Amounts in the Inclusion of Pension Service Cost are based on the actuarially determined service cost for services rendered by the executives during the listed year. There were no adjustments for “prior service costs” required to be included in the Inclusion of Pension Service Cost column. Any negative pension service costs are excluded from this column. |
Year |
Summary Compensation Table Total for Richard M. Adams, Jr. ($) |
Exclusion of Change in Pension Value for Richard M. Adams, Jr. ($) |
Exclusion of Stock Awards and Option Awards for Richard M. Adams, Jr. ($) |
Inclusion of Pension Service Cost for Richard M. Adams, Jr. ($) |
Inclusion of Equity Values for Richard M. Adams, Jr. ($) |
Compensation Actually Paid to Richard M. Adams, Jr. ($) |
||||||||||||||||||
2025 |
6,140,650 | (105,617 | ) | (2,643,865 | ) | — | 3,631,798 | 7,022,966 | ||||||||||||||||
Year |
Average Summary Compensation Table Total for Non-PEO NEOs ($) |
Average Exclusion of Change in Pension Value for Non-PEO NEOs ($) |
Average Exclusion of Stock Awards and Option Awards for Non-PEO NEOs ($) |
Average Inclusion of Pension Service Cost for Non-PEO NEOs ($) |
Average Inclusion of Equity Values for Non-PEO NEOs ($) |
Average Compensation Actually Paid to Non-PEO NEOs ($) |
||||||||||||||||||
2025 |
3,613,947 | (88,718) | (1,378,007) | 8,591 | 1,928,979 | 4,084,792 | ||||||||||||||||||
The amounts in the Inclusion of Equity Values in the tables above are derived from adding or deducting the amounts set forth in the following tables:
Year |
Year-End Fair Value of Equity Awards Granted During Year That Remained Unvested as of Last Day of Year for Richard M. Adams, Jr. ($) |
Change in Fair Value from Last Day of Prior Year to Last Day of Year of Unvested Equity Awards for Richard M. Adams, Jr. ($) |
Vesting- Date Fair Value of Equity Awards Granted During Year that Vested During Year for Richard M. Adams, Jr. ($) |
Change in Fair Value from Last Day of Prior Year to Vesting Date of Unvested Equity Awards that Vested During Year for Richard M. Adams, Jr. ($) |
Fair Value at Last Day of Prior Year of Equity Awards Forfeited During Year for Richard M. Adams, Jr. ($) |
Value of Dividends or Other Earnings Paid on Equity Awards Not Otherwise Included for Richard M. Adams, Jr. ($) |
Total— Inclusion of Equity Values for Richard M. Adams, Jr. ($) |
|||||||||||||||||||||
2025 |
3,136,805 | 437,175 | — | 57,818 | — | — | 3,631,798 | |||||||||||||||||||||
Year |
Average Year-End Fair Value of Equity Awards Granted During Year That Remained Unvested as of Last Day of Year for Non-PEO NEOs ($) |
Average Change in Fair Value from Last Day of Prior Year to Last Day of Year of Unvested Equity Awards for Non-PEO NEOs ($) |
Average Vesting- Date Fair Value of Equity Awards Granted During Year that Vested During Year for Non- PEO NEOs ($) |
Average Change in Fair Value from Last Day of Prior Year to Vesting Date of Unvested Equity Awards that Vested During Year for Non- PEO NEOs ($) |
Average Fair Value at Last Day of Prior Year of Equity Awards Forfeited During Year for Non- PEO NEOs ($) |
Average Value of Dividends or Other Earnings Paid on Equity Awards Not Otherwise Included for Non-PEO NEOs ($) |
Total—Average Inclusion of Equity Values for Non-PEO NEOs ($) |
|||||||||||||||||||||
2025 |
1,634,936 | 241,287 | — | 52,757 | — | — | 1,928,979 | |||||||||||||||||||||
| (4) | The Company’s TSR set forth in the table assumes $100 was invested for the period beginning December 31, 2020 through the end of the listed year in the Company, with reinvestment of dividends. There is no assurance that the Company’s common stock performance will continue in the future with the same or similar trends as depicted in the table. |
| (5) | The Peer Group TSR set forth in this table utilizes the NASDAQ Bank Index, which we also utilize in the stock performance graph required by Item 201(e) of Regulation S-K included in our Annual Report for the year ended December 31, 2025. The Peer Group TSR assumes $100 was invested for the period starting December 31, 2020 through the end of the listed year in the NASDAQ Bank Index. |
| (6) | The dollar amounts reported represent the amount of net income reflected in the Company’s audited financial statements for the applicable year. |
| (7) | We determined “Core” Diluted Earnings Per Share to be the most important financial performance measure used to link Company performance to Compensation Actually Paid to our NEOs in 2025. This performance measure may not have been the most important financial performance measure for prior years and we may determine a different financial performance measure to be the most important financial performance measure in future years. The “Core” Diluted Earnings Per Share amount for 2025, 2024 and 2022 represents earnings per diluted share reflected in the Company’s audited financial statements in accordance with GAAP with no adjustments. The “Core” Diluted Earnings Per Share amount for 2023 represents the earnings per diluted share reflected in the Company’s audited financial statements adjusted to exclude approximately $12.0 million, before tax, of noninterest expense incurred in the fourth quarter of 2023 for the FDIC “special assessment” |
levied on banking organizations following the 2023 Banking Crisis, a non-GAAP measure. The “Core” Diluted Earnings Per Share amount for 2021 represents the earnings per diluted share reflected in the Company’s audited financial statements adjusted for merger-related expenses, a non-GAAP measure. A reconciliation of this non-GAAP measure is set forth below for 2023 and 2021. |
“Core” Diluted Earnings Per Share |
For the Year Ended December 31, 2023 | |||||||||
(Dollars in thousands) |
||||||||||
Net Earnings Allocated to Common Shareholders (GAAP) (a) |
$ | 365,434 | ||||||||
Plus: FDIC “special assessment,” net of tax |
9,476 | |||||||||
“Core” Net Earnings Allocated to Common Shareholders (non-GAAP) (b) |
$ | 374,910 | ||||||||
Average Diluted Shares Outstanding (GAAP) (c) |
134,753,820 | |||||||||
Earnings Per Diluted Common Share (GAAP) [(a)/(c)] |
$ | 2.71 | ||||||||
“Core” Diluted Earnings Per Share (non-GAAP) [(b)/(c)] |
$ | 2.78 | ||||||||
“Core” Diluted Earnings Per Share |
For the Year Ended December 31, 2021 | |||||||||
(Dollars in thousands) |
||||||||||
Net Earnings Allocated to Common Shareholders (GAAP) (a) |
$ | 366,696 | ||||||||
Plus: Merger-related expense, net of tax |
17,017 | |||||||||
“Core” Net Earnings Allocated to Common Shareholders (non-GAAP) (b) |
$ | 383,713 | ||||||||
Average Diluted Shares Outstanding (GAAP) (c) |
129,512,853 | |||||||||
Earnings Per Diluted Common Share (GAAP) [(a)/(c)] |
$ | 2.83 | ||||||||
“Core” Diluted Earnings Per Share (non-GAAP) [(b)/(c)] |
$ | 2.96 | ||||||||
2021 |
2022 |
2023-2025 | ||
Richard M. Adams, Jr. |
James J. Consagra, Jr. |
Richard M. Adams | ||
James J. Consagra, Jr. |
W. Mark Tatterson |
James J. Consagra, Jr. | ||
W. Mark Tatterson |
Jerold L. Rexroad |
W. Mark Tatterson | ||
Jerold L. Rexroad |
Darren K. Williams |
Darren K. Williams | ||
S-K
included in our Annual Report for the year ended December 31, 2025. The Peer Group TSR assumes $100 was invested for the period starting December 31, 2020 through the end of the listed year in the NASDAQ Bank Index.
| (3) | Compensation Actually Paid reflects the exclusions and inclusions of certain amounts for the PEOs and the Non-PEO NEOs as set forth below. Equity values are calculated in accordance with FASB ASC Topic 718. Amounts in the Exclusion of Stock Awards and Option Awards column are the totals from the Stock Awards and Option Awards columns set forth in the Summary Compensation Table. Amounts in the Exclusion of Change in Pension Value column reflect the positive changes in the Pension Value reported in the Summary Compensation Table. Amounts in the Inclusion of Pension Service Cost are based on the actuarially determined service cost for services rendered by the executives during the listed year. There were no adjustments for “prior service costs” required to be included in the Inclusion of Pension Service Cost column. Any negative pension service costs are excluded from this column. |
Year |
Summary Compensation Table Total for Richard M. Adams, Jr. ($) |
Exclusion of Change in Pension Value for Richard M. Adams, Jr. ($) |
Exclusion of Stock Awards and Option Awards for Richard M. Adams, Jr. ($) |
Inclusion of Pension Service Cost for Richard M. Adams, Jr. ($) |
Inclusion of Equity Values for Richard M. Adams, Jr. ($) |
Compensation Actually Paid to Richard M. Adams, Jr. ($) |
||||||||||||||||||
2025 |
6,140,650 | (105,617 | ) | (2,643,865 | ) | — | 3,631,798 | 7,022,966 | ||||||||||||||||
The amounts in the Inclusion of Equity Values in the tables above are derived from adding or deducting the amounts set forth in the following tables:
Year |
Year-End Fair Value of Equity Awards Granted During Year That Remained Unvested as of Last Day of Year for Richard M. Adams, Jr. ($) |
Change in Fair Value from Last Day of Prior Year to Last Day of Year of Unvested Equity Awards for Richard M. Adams, Jr. ($) |
Vesting- Date Fair Value of Equity Awards Granted During Year that Vested During Year for Richard M. Adams, Jr. ($) |
Change in Fair Value from Last Day of Prior Year to Vesting Date of Unvested Equity Awards that Vested During Year for Richard M. Adams, Jr. ($) |
Fair Value at Last Day of Prior Year of Equity Awards Forfeited During Year for Richard M. Adams, Jr. ($) |
Value of Dividends or Other Earnings Paid on Equity Awards Not Otherwise Included for Richard M. Adams, Jr. ($) |
Total— Inclusion of Equity Values for Richard M. Adams, Jr. ($) |
|||||||||||||||||||||
2025 |
3,136,805 | 437,175 | — | 57,818 | — | — | 3,631,798 | |||||||||||||||||||||
| (3) | Compensation Actually Paid reflects the exclusions and inclusions of certain amounts for the PEOs and the Non-PEO NEOs as set forth below. Equity values are calculated in accordance with FASB ASC Topic 718. Amounts in the Exclusion of Stock Awards and Option Awards column are the totals from the Stock Awards and Option Awards columns set forth in the Summary Compensation Table. Amounts in the Exclusion of Change in Pension Value column reflect the positive changes in the Pension Value reported in the Summary Compensation Table. Amounts in the Inclusion of Pension Service Cost are based on the actuarially determined service cost for services rendered by the executives during the listed year. There were no adjustments for “prior service costs” required to be included in the Inclusion of Pension Service Cost column. Any negative pension service costs are excluded from this column. |
Year |
Average Summary Compensation Table Total for Non-PEO NEOs ($) |
Average Exclusion of Change in Pension Value for Non-PEO NEOs ($) |
Average Exclusion of Stock Awards and Option Awards for Non-PEO NEOs ($) |
Average Inclusion of Pension Service Cost for Non-PEO NEOs ($) |
Average Inclusion of Equity Values for Non-PEO NEOs ($) |
Average Compensation Actually Paid to Non-PEO NEOs ($) |
||||||||||||||||||
2025 |
3,613,947 | (88,718) | (1,378,007) | 8,591 | 1,928,979 | 4,084,792 | ||||||||||||||||||
The amounts in the Inclusion of Equity Values in the tables above are derived from adding or deducting the amounts set forth in the following tables:
Year |
Average Year-End Fair Value of Equity Awards Granted During Year That Remained Unvested as of Last Day of Year for Non-PEO NEOs ($) |
Average Change in Fair Value from Last Day of Prior Year to Last Day of Year of Unvested Equity Awards for Non-PEO NEOs ($) |
Average Vesting- Date Fair Value of Equity Awards Granted During Year that Vested During Year for Non- PEO NEOs ($) |
Average Change in Fair Value from Last Day of Prior Year to Vesting Date of Unvested Equity Awards that Vested During Year for Non- PEO NEOs ($) |
Average Fair Value at Last Day of Prior Year of Equity Awards Forfeited During Year for Non- PEO NEOs ($) |
Average Value of Dividends or Other Earnings Paid on Equity Awards Not Otherwise Included for Non-PEO NEOs ($) |
Total—Average Inclusion of Equity Values for Non-PEO NEOs ($) |
|||||||||||||||||||||
2025 |
1,634,936 | 241,287 | — | 52,757 | — | — | 1,928,979 | |||||||||||||||||||||
The following chart sets forth the relationship between Compensation Actually Paid to our PEOs, the average of Compensation Actually Paid to our
Non-PEO
NEOs, and the Company’s cumulative TSR over the five most recently completed fiscal years for the Company and the Peer Group. 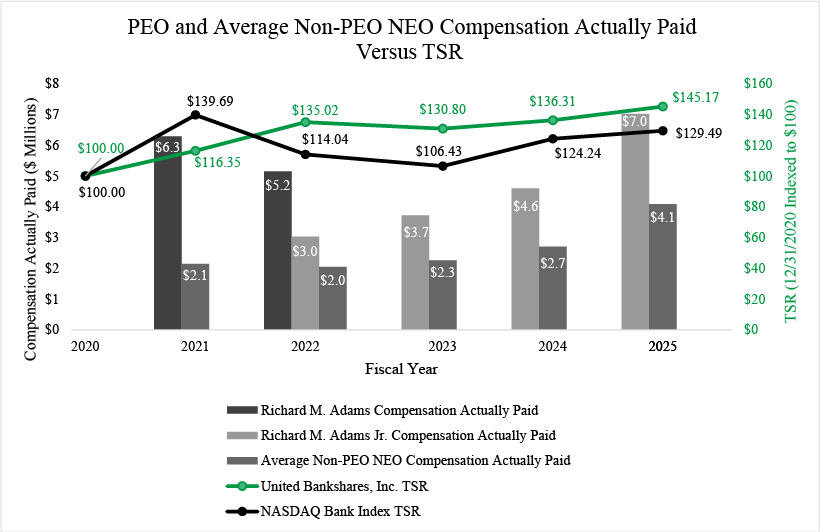
The following chart sets forth the relationship between Compensation Actually Paid to our PEOs, the average of Compensation Actually Paid to our
Non-PEO
NEOs, and our net income during the five most recently completed fiscal years. 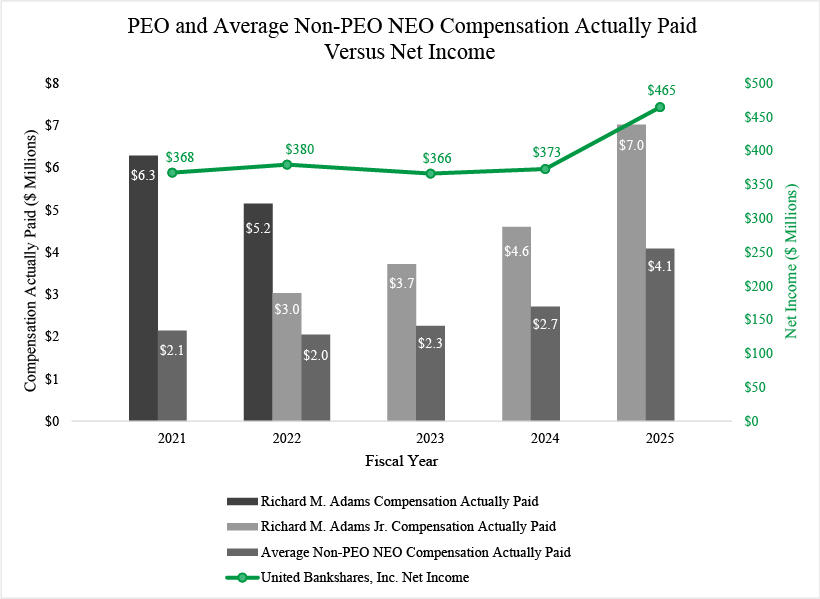
The following chart sets forth the relationship between Compensation Actually Paid to our PEO, the average of Compensation Actually Paid to our
Non-PEO
NEOs, and our “Core” Diluted Earnings Per Share during the five most recently completed fiscal years. 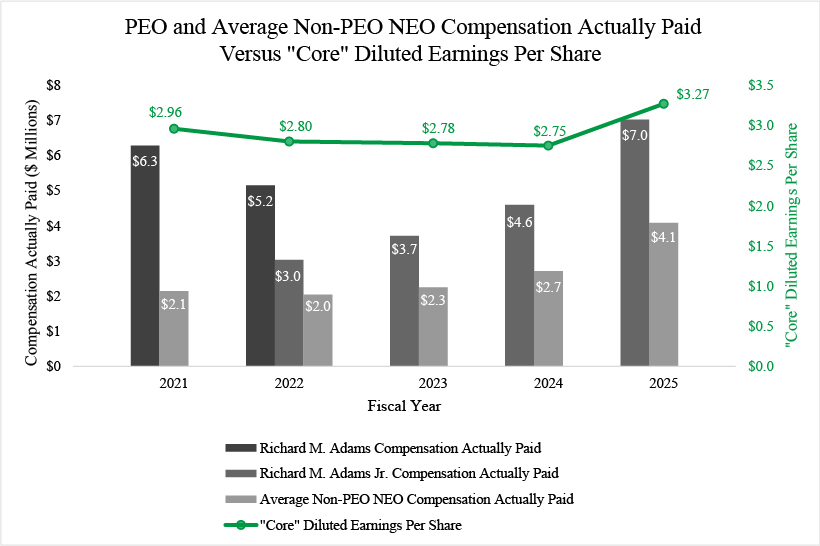
The following chart sets forth the relationship between Compensation Actually Paid to our PEOs, the average of Compensation Actually Paid to our
Non-PEO
NEOs, and the Company’s cumulative TSR over the five most recently completed fiscal years for the Company and the Peer Group. The following table presents the financial performance measures that the Company considers to have been the most important in linking Compensation Actually Paid to our PEO and other NEOs for 2025 to Company performance. The measures in this table are not ranked.
Financial Performance Measures |
“Core” Diluted Earnings Per Share |
Adjusted Return on Average Assets |
Non-Performing Assets Ratio |
Adjusted Return on Average Tangible Common Equity |
| (7) | We determined “Core” Diluted Earnings Per Share to be the most important financial performance measure used to link Company performance to Compensation Actually Paid to our NEOs in 2025. This performance measure may not have been the most important financial performance measure for prior years and we may determine a different financial performance measure to be the most important financial performance measure in future years. The “Core” Diluted Earnings Per Share amount for 2025, 2024 and 2022 represents earnings per diluted share reflected in the Company’s audited financial statements in accordance with GAAP with no adjustments. The “Core” Diluted Earnings Per Share amount for 2023 represents the earnings per diluted share reflected in the Company’s audited financial statements adjusted to exclude approximately $12.0 million, before tax, of noninterest expense incurred in the fourth quarter of 2023 for the FDIC “special assessment” |
levied on banking organizations following the 2023 Banking Crisis, a non-GAAP measure. The “Core” Diluted Earnings Per Share amount for 2021 represents the earnings per diluted share reflected in the Company’s audited financial statements adjusted for merger-related expenses, a non-GAAP measure. A reconciliation of this non-GAAP measure is set forth below for 2023 and 2021. |