Pay vs Performance Disclosure
|
12 Months Ended |
|
Dec. 31, 2025
USD ($)
$ / shares
|
Dec. 31, 2024
USD ($)
$ / shares
|
Dec. 31, 2023
USD ($)
$ / shares
|
Dec. 31, 2022
USD ($)
$ / shares
|
Dec. 31, 2021
USD ($)
$ / shares
|
| Pay vs Performance Disclosure |
|
|
|
|
|
| Pay vs Performance Disclosure, Table |
| | | | | | | | | | | | | | | | | | | | | | | | | | | | | | | | | | | | | | | | Pay | | Performance | | | | Current PEO (1) | | Avg. of Other NEOs (2) | | Value of $100 Initial Investment Based On (3): | | Company Selected Performance Metric (4) | | Year | | | | SCT Total Comp. | Comp Actually Paid | | SCT Total Comp. | Comp Actually Paid | | JBTM Cumulative TSR | S&P 1500 Industrial Machinery
Cumulative TSR | Net (Loss) Income
(in millions) | Adjusted EPS | | 2025 | | | $7,966,447 | $13,089,405 | | $3,077,948 | $3,779,974 | | $135 | $166 | $(50.5) | $6.41 | | 2024 | | | $6,452,960 | $11,217,470 | | $1,526,123 | $2,252,023 | | $113 | $148 | $85.4 | $5.38 | | 2023 | | | $6,176,099 | $8,158,164 | | $1,499,098 | $1,802,760 | | $80 | $133 | $582.6 | $2.62 | | 2022 | | | $4,791,474 | $2,847,190 | | $1,155,529 | $761,586 | | $81 | $104 | $130.7 | $4.81 | | 2021 | | | | $5,023,977 | $4,743,995 | | $1,567,948 | $1,097,771 | | $135 | $121 | $118.4 | $3.82 |
|
|
|
|
|
| Company Selected Measure Name |
Adjusted EPS
|
|
|
|
|
| Named Executive Officers, Footnote |
Current PEO refers to Brian A. Deck. (2) Includes the following NEOs: 2025: Messrs. Meister, Sigurdsson, Petrie, and Claessens 2024: Messrs. Meister, Petrie, Rizzolo, and Marvin 2023: Messrs. Meister, Petrie, Rizzolo, Marvin, and Burdakin 2022: Messrs. Meister, Petrie, Burdakin, Marvin, and Fernandez 2021: Messrs. Meister, Burdakin, Marvin, Fernandez, and Sternlieb
|
|
|
|
|
| PEO Total Compensation Amount |
$ 7,966,447
|
|
|
|
|
| PEO Actually Paid Compensation Amount |
$ 13,089,405
|
|
|
|
|
| Adjustment To PEO Compensation, Footnote |
| | | | | | | | | | | | | | | | | | | | | | Year | Summary Compensation Table Total for Current PEO ($) | Exclusion of Change in Pension Value for Current PEO ($) | Exclusion of Stock Awards for Current PEO ($) | Inclusion of Pension Service Cost for Current PEO ($) | Inclusion of Equity Values for Current PEO ($) | Compensation Actually Paid to Current PEO ($) | | 2025 | 7,966,447 | — | (5,199,957) | — | 10,322,915 | 13,089,405 |
| | | | | | | | | | | | | | | | | | | | | | Year | Year-End Fair Value of Equity Awards Granted During Year That Remained Unvested as of Last Day of Year for Current PEO ($) | Change in Fair Value from Last Day of Prior Year to Last Day of Year of Unvested Equity Awards for Current PEO ($) | Vesting-Date Fair Value of Equity Awards Granted During Year that Vested During Year for Current PEO ($) | Change in Fair Value from Last Day of Prior Year to Vesting Date of Unvested Equity Awards that Vested During Year for Current PEO ($) | Fair Value at Last Day of Prior Year of Equity Awards Forfeited During Year for Current PEO ($) | Total - Inclusion of Equity Values for Current PEO ($) | | 2025 | 8,167,553 | 2,544,717 | — | (389,355) | — | 10,322,915 |
|
|
|
|
|
| Non-PEO NEO Average Total Compensation Amount |
$ 3,077,948
|
$ 1,526,123
|
$ 1,499,098
|
$ 1,155,529
|
$ 1,567,948
|
| Non-PEO NEO Average Compensation Actually Paid Amount |
$ 3,779,974
|
2,252,023
|
1,802,760
|
761,586
|
1,097,771
|
| Adjustment to Non-PEO NEO Compensation Footnote |
| | | | | | | | | | | | | | | | | | | | | | Year | Average Summary Compensation Table Total for Non-PEO NEOs
($) | Average Exclusion of Change in Pension Value for Non-PEO NEOs
($) | Average Exclusion of Stock Awards for Non-PEO NEOs
($) | Average Inclusion of Pension Service Cost for Non-PEO NEOs
($) | Average Inclusion of Equity Values for Non-PEO NEOs
($) | Average Compensation Actually Paid to Non-PEO NEOs
($) | | 2025 | 3,077,948 | — | (999,966) | — | 1,701,992 | 3,779,974 |
| | | | | | | | | | | | | | | | | | | | | | Year | Average Year-End Fair Value of Equity Awards Granted During Year That Remained Unvested as of Last Day of Year for Non-PEO NEOs
($) | Average Change in Fair Value from Last Day of Prior Year to Last Day of Year of Unvested Equity Awards for Non-PEO NEOs
($) | Average Vesting-Date Fair Value of Equity Awards Granted During Year that Vested During Year for Non-PEO NEOs
($) | Average Change in Fair Value from Last Day of Prior Year to Vesting Date of Unvested Equity Awards that Vested During Year for Non-PEO NEOs ($) | Average Fair Value at Last Day of Prior Year of Equity Awards Forfeited During Year for Non-PEO NEOs
($) | Total - Average Inclusion of Equity Values for Non-PEO NEOs
($) | | 2025 | 1,513,588 | 222,122 | — | (33,718) | — | 1,701,992 |
|
|
|
|
|
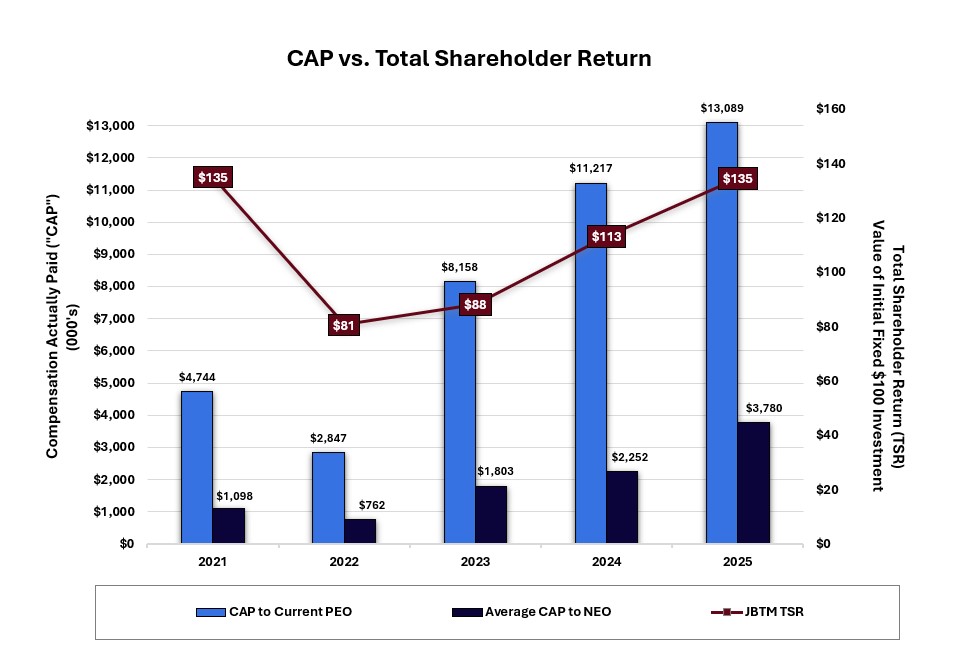
| Compensation Actually Paid vs. Total Shareholder Return |
Relationship Between CAP and PVP Performance Metrics The table below shows the relationship between compensation actually paid to our PEO, the average of the compensation actually paid to our other NEOs and our total shareholder return over five fiscal years ending December 31, 2025. As shown in the chart, the PEO and NEO CAP amounts trend similarly to JBTM’s TSR. This is primarily due to our pay for performance philosophy and the use of equity incentives, which are tied to company performance and our stock price.
|
|
|
|
|
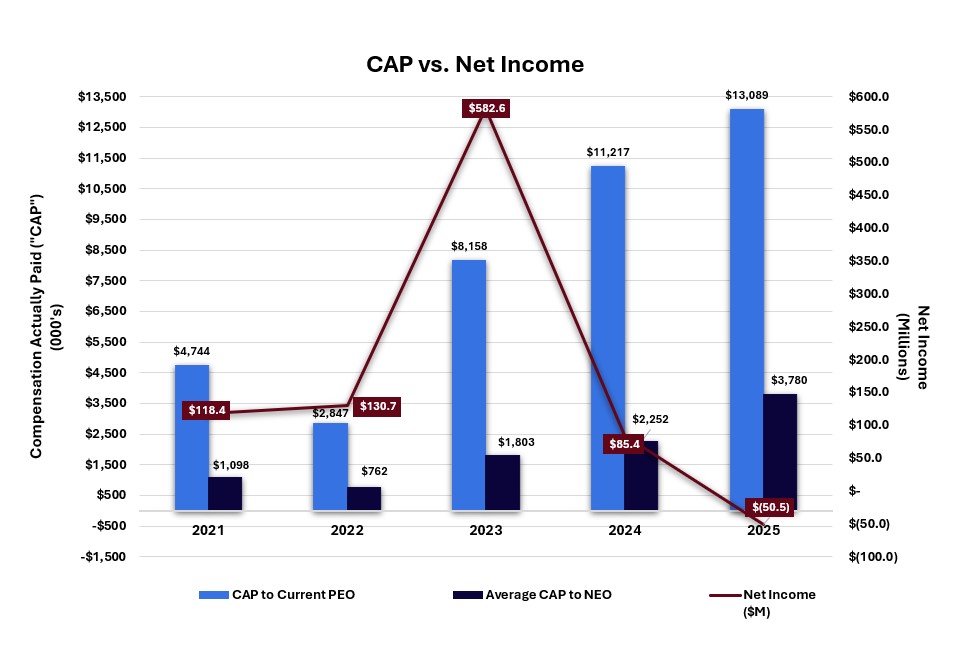
| Compensation Actually Paid vs. Net Income |
The table below shows the relationship between compensation actually paid to our PEO, the average of the compensation actually paid to our other NEOs and our net income over five fiscal years ending December 31, 2025.
|
|
|
|
|
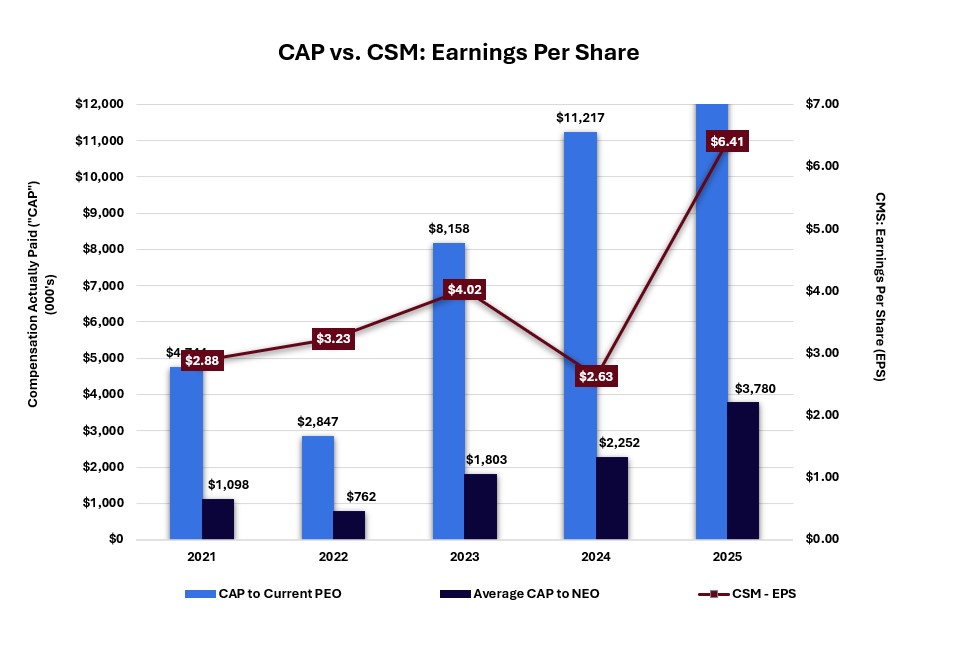
| Compensation Actually Paid vs. Company Selected Measure |
The table below shows the relationship between compensation actually paid to our PEO, the average of the compensation actually paid to our other NEOs and our company selected metric – Earning Per Share over five fiscal years ending December 31, 2025.
|
|
|
|
|
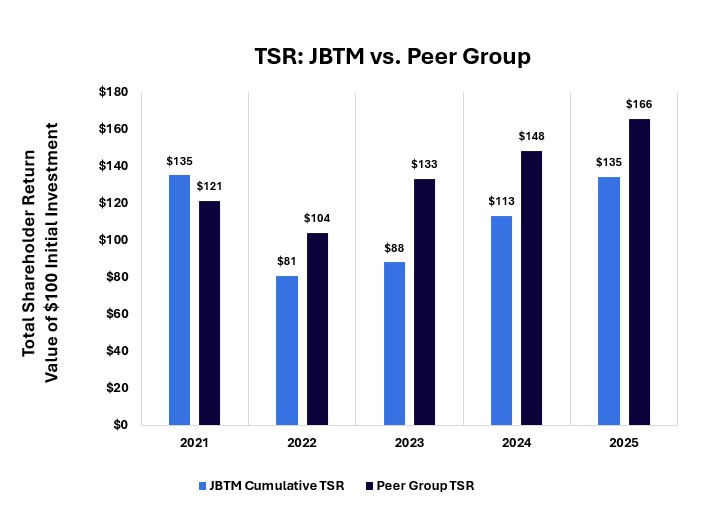
| Total Shareholder Return Vs Peer Group |
The table below shows the relationship between JBTM TSR and the TSR of the selected peer group, the S&P 1500 Industrial Machinery comparator group. The TSR is cumulative and depicted as a dollar value assuming $100 was invested as of January 1, 2021.
|
|
|
|
|
| Tabular List, Table |
| | | 2025 Most Important Measures (Unranked) | Adjusted EPS is calculated by making certain adjustments to GAAP earnings per share to exclude unusual, one-time and non-recurring items, including restructuring charges, M&A-related costs, acquisition-related amortization and depreciation, non-cash pension plan related settlement costs and the related tax impact. The Adjusted EPS award results are annually assessed with that year’s Adjusted EPS targets and averaged over the specified three-year period. As an incentive measure, we believe that linking sustained Adjusted EPS growth to compensation helps us drive our executive officers to improve overall earnings. | Adjusted EBITDA is calculated as earnings adjusted for income taxes, interest expense (income), net, other financing income, pension expense other than service cost, restructuring, M&A related and other costs and depreciation and amortization, including acquisition related depreciation and amortization. Adjusted EBITDA growth is one of our primary internal performance measures designed to align incentive opportunities with our internal benchmark for generating operating cash flow. | Adjusted EBITDA Margin is calculated as Adjusted EBITDA divided by revenue. We utilize Adjusted EBITDA Margin as a performance metric because it measures our ability to convert revenue into income. | ROIC takes our Adjusted EBITDA plus depreciation, net of tax, as a percentage of our invested capital. Our invested capital is the sum of cash and cash equivalents, debt and equity. | Financial Leverage Ratio is calculated as net debt divided by our trailing twelve months Adjusted EBITDA. Net debt is total debt less cash and cash equivalents. |
|
|
|
|
|
| Total Shareholder Return Amount |
$ 135
|
113
|
80
|
81
|
135
|
| Peer Group Total Shareholder Return Amount |
166
|
148
|
133
|
104
|
121
|
| Net Income (Loss) |
$ (50,500,000)
|
$ 85,400,000
|
$ 582,600,000
|
$ 130,700,000
|
$ 118,400,000
|
| Company Selected Measure Amount | $ / shares |
6.41
|
5.38
|
2.62
|
4.81
|
3.82
|
| PEO Name |
Brian A. Deck
|
|
|
|
|
| Additional 402(v) Disclosure |
SR is cumulative (i.e., 1 year for 2021, 2 years for 2022 and 3 years for 2023) and depicted as a dollar value assuming $100 was invested as of January 1, 2021.
|
|
|
|
|
| Measure:: 1 |
|
|
|
|
|
| Pay vs Performance Disclosure |
|
|
|
|
|
| Name |
Adjusted EPS is calculated by making certain adjustments to GAAP earnings per share to exclude unusual, one-time and non-recurring items, including restructuring charges, M&A-related costs, acquisition-related amortization and depreciation, non-cash pension plan related settlement costs and the related tax impact. The Adjusted EPS award results are annually assessed with that year’s Adjusted EPS targets and averaged over the specified three-year period. As an incentive measure, we believe that linking sustained Adjusted EPS growth to compensation helps us drive our executive officers to improve overall earnings.
|
|
|
|
|
| Non-GAAP Measure Description |
Adjusted EPS is calculated by making certain adjustments to GAAP earnings per share to exclude unusual, one-time and non-recurring items, including restructuring charges, M&A-related costs, acquisition-related amortization and depreciation, non-cash pension plan related settlement costs and the related tax impact. The Adjusted EPS award results are annually assessed with that year’s Adjusted EPS targets and averaged over the specified three-year period. As an incentive measure, we believe that linking sustained Adjusted EPS growth to compensation helps us drive our executive officers to improve overall earnings.
|
|
|
|
|
| Measure:: 2 |
|
|
|
|
|
| Pay vs Performance Disclosure |
|
|
|
|
|
| Name |
Adjusted EBITDA is calculated as earnings adjusted for income taxes, interest expense (income), net, other financing income, pension expense other than service cost, restructuring, M&A related and other costs and depreciation and amortization, including acquisition related depreciation and amortization. Adjusted EBITDA growth is one of our primary internal performance measures designed to align incentive opportunities with our internal benchmark for generating operating cash flow.
|
|
|
|
|
| Measure:: 3 |
|
|
|
|
|
| Pay vs Performance Disclosure |
|
|
|
|
|
| Name |
Adjusted EBITDA Margin is calculated as Adjusted EBITDA divided by revenue. We utilize Adjusted EBITDA Margin as a performance metric because it measures our ability to convert revenue into income.
|
|
|
|
|
| Measure:: 4 |
|
|
|
|
|
| Pay vs Performance Disclosure |
|
|
|
|
|
| Name |
ROIC takes our Adjusted EBITDA plus depreciation, net of tax, as a percentage of our invested capital. Our invested capital is the sum of cash and cash equivalents, debt and equity.
|
|
|
|
|
| Measure:: 5 |
|
|
|
|
|
| Pay vs Performance Disclosure |
|
|
|
|
|
| Name |
Financial Leverage Ratio is calculated as net debt divided by our trailing twelve months Adjusted EBITDA. Net debt is total debt less cash and cash equivalents.
|
|
|
|
|
| Current PEO [Member] |
|
|
|
|
|
| Pay vs Performance Disclosure |
|
|
|
|
|
| PEO Total Compensation Amount |
$ 7,966,447
|
$ 6,452,960
|
$ 6,176,099
|
$ 4,791,474
|
$ 5,023,977
|
| PEO Actually Paid Compensation Amount |
13,089,405
|
$ 11,217,470
|
$ 8,158,164
|
$ 2,847,190
|
$ 4,743,995
|
| PEO | Aggregate Change in Present Value of Accumulated Benefit for All Pension Plans Reported in Summary Compensation Table |
|
|
|
|
|
| Pay vs Performance Disclosure |
|
|
|
|
|
| Adjustment to Compensation, Amount |
0
|
|
|
|
|
| PEO | Aggregate Pension Adjustments Service Cost |
|
|
|
|
|
| Pay vs Performance Disclosure |
|
|
|
|
|
| Adjustment to Compensation, Amount |
0
|
|
|
|
|
| PEO | Aggregate Grant Date Fair Value of Equity Award Amounts Reported in Summary Compensation Table |
|
|
|
|
|
| Pay vs Performance Disclosure |
|
|
|
|
|
| Adjustment to Compensation, Amount |
(5,199,957)
|
|
|
|
|
| PEO | Equity Awards Adjustments, Excluding Value Reported in Compensation Table |
|
|
|
|
|
| Pay vs Performance Disclosure |
|
|
|
|
|
| Adjustment to Compensation, Amount |
10,322,915
|
|
|
|
|
| PEO | Year-end Fair Value of Equity Awards Granted in Covered Year that are Outstanding and Unvested |
|
|
|
|
|
| Pay vs Performance Disclosure |
|
|
|
|
|
| Adjustment to Compensation, Amount |
8,167,553
|
|
|
|
|
| PEO | Year-over-Year Change in Fair Value of Equity Awards Granted in Prior Years That are Outstanding and Unvested |
|
|
|
|
|
| Pay vs Performance Disclosure |
|
|
|
|
|
| Adjustment to Compensation, Amount |
2,544,717
|
|
|
|
|
| PEO | Vesting Date Fair Value of Equity Awards Granted and Vested in Covered Year |
|
|
|
|
|
| Pay vs Performance Disclosure |
|
|
|
|
|
| Adjustment to Compensation, Amount |
0
|
|
|
|
|
| PEO | Change in Fair Value as of Vesting Date of Prior Year Equity Awards Vested in Covered Year |
|
|
|
|
|
| Pay vs Performance Disclosure |
|
|
|
|
|
| Adjustment to Compensation, Amount |
(389,355)
|
|
|
|
|
| PEO | Prior Year End Fair Value of Equity Awards Granted in Any Prior Year that Fail to Meet Applicable Vesting Conditions During Covered Year |
|
|
|
|
|
| Pay vs Performance Disclosure |
|
|
|
|
|
| Adjustment to Compensation, Amount |
0
|
|
|
|
|
| Non-PEO NEO | Aggregate Change in Present Value of Accumulated Benefit for All Pension Plans Reported in Summary Compensation Table |
|
|
|
|
|
| Pay vs Performance Disclosure |
|
|
|
|
|
| Adjustment to Compensation, Amount |
0
|
|
|
|
|
| Non-PEO NEO | Aggregate Pension Adjustments Service Cost |
|
|
|
|
|
| Pay vs Performance Disclosure |
|
|
|
|
|
| Adjustment to Compensation, Amount |
0
|
|
|
|
|
| Non-PEO NEO | Aggregate Grant Date Fair Value of Equity Award Amounts Reported in Summary Compensation Table |
|
|
|
|
|
| Pay vs Performance Disclosure |
|
|
|
|
|
| Adjustment to Compensation, Amount |
(999,966)
|
|
|
|
|
| Non-PEO NEO | Equity Awards Adjustments, Excluding Value Reported in Compensation Table |
|
|
|
|
|
| Pay vs Performance Disclosure |
|
|
|
|
|
| Adjustment to Compensation, Amount |
1,701,992
|
|
|
|
|
| Non-PEO NEO | Year-end Fair Value of Equity Awards Granted in Covered Year that are Outstanding and Unvested |
|
|
|
|
|
| Pay vs Performance Disclosure |
|
|
|
|
|
| Adjustment to Compensation, Amount |
1,513,588
|
|
|
|
|
| Non-PEO NEO | Year-over-Year Change in Fair Value of Equity Awards Granted in Prior Years That are Outstanding and Unvested |
|
|
|
|
|
| Pay vs Performance Disclosure |
|
|
|
|
|
| Adjustment to Compensation, Amount |
222,122
|
|
|
|
|
| Non-PEO NEO | Vesting Date Fair Value of Equity Awards Granted and Vested in Covered Year |
|
|
|
|
|
| Pay vs Performance Disclosure |
|
|
|
|
|
| Adjustment to Compensation, Amount |
0
|
|
|
|
|
| Non-PEO NEO | Change in Fair Value as of Vesting Date of Prior Year Equity Awards Vested in Covered Year |
|
|
|
|
|
| Pay vs Performance Disclosure |
|
|
|
|
|
| Adjustment to Compensation, Amount |
(33,718)
|
|
|
|
|
| Non-PEO NEO | Prior Year End Fair Value of Equity Awards Granted in Any Prior Year that Fail to Meet Applicable Vesting Conditions During Covered Year |
|
|
|
|
|
| Pay vs Performance Disclosure |
|
|
|
|
|
| Adjustment to Compensation, Amount |
$ 0
|
|
|
|
|