Pay vs Performance Disclosure - USD ($)
Jan. 31, 2026
Jan. 31, 2025
Jan. 31, 2024
Jan. 31, 2023
Jan. 31, 2022
Pay Versus Performance Table
As required by Item 402(v) of Regulation
S-K,
we are providing the following information about the relationship between executive compensation actually paid (as defined by SEC rules) and certain financial performance measures of the Company. For further information about how we align executive compensation with the Company’s performance, see “Compensation of Executive Officers” above. The amounts in the table below are calculated in accordance with SEC rules and do not represent amounts actually earned or realized by our named executive officers (“NEOs”), including with respect to RSUs and PSUs. Fiscal Year |
Summary Compensation Table Total for PEO (1) |
Compensation Actually Paid to PEO (2) |
Average Summary Compensation Table Total for non-PEO Named Executive Officers (3) |
Average Compensation Actually Paid to non-PEO Named Executive Officers (4) |
Value of Initial Fixed $100 Investment Based On: |
Net Income (in thousands) |
Company-Selected Performance Measures |
|||||||||||||||||||||||||||||
Total Shareholder Return (5) |
Peer Group Total Shareholder Return (5)(6) |
Net Sales (in thousands) |
Operating Income (in thousands) |
|||||||||||||||||||||||||||||||||
2026 |
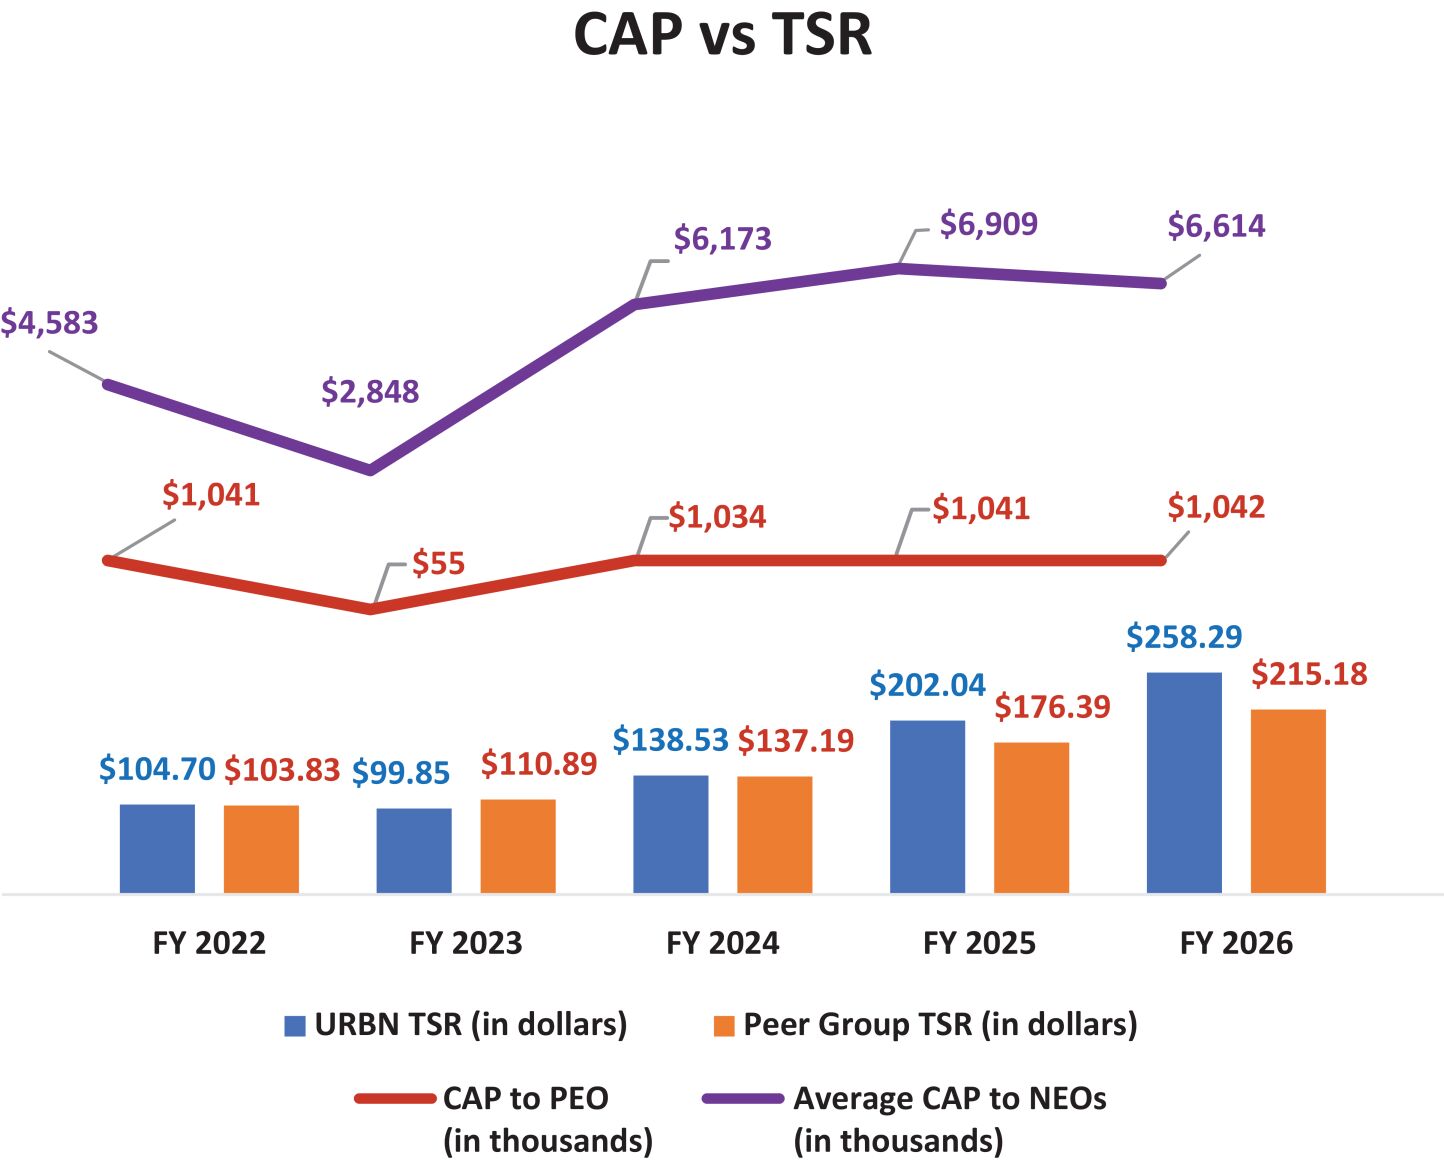
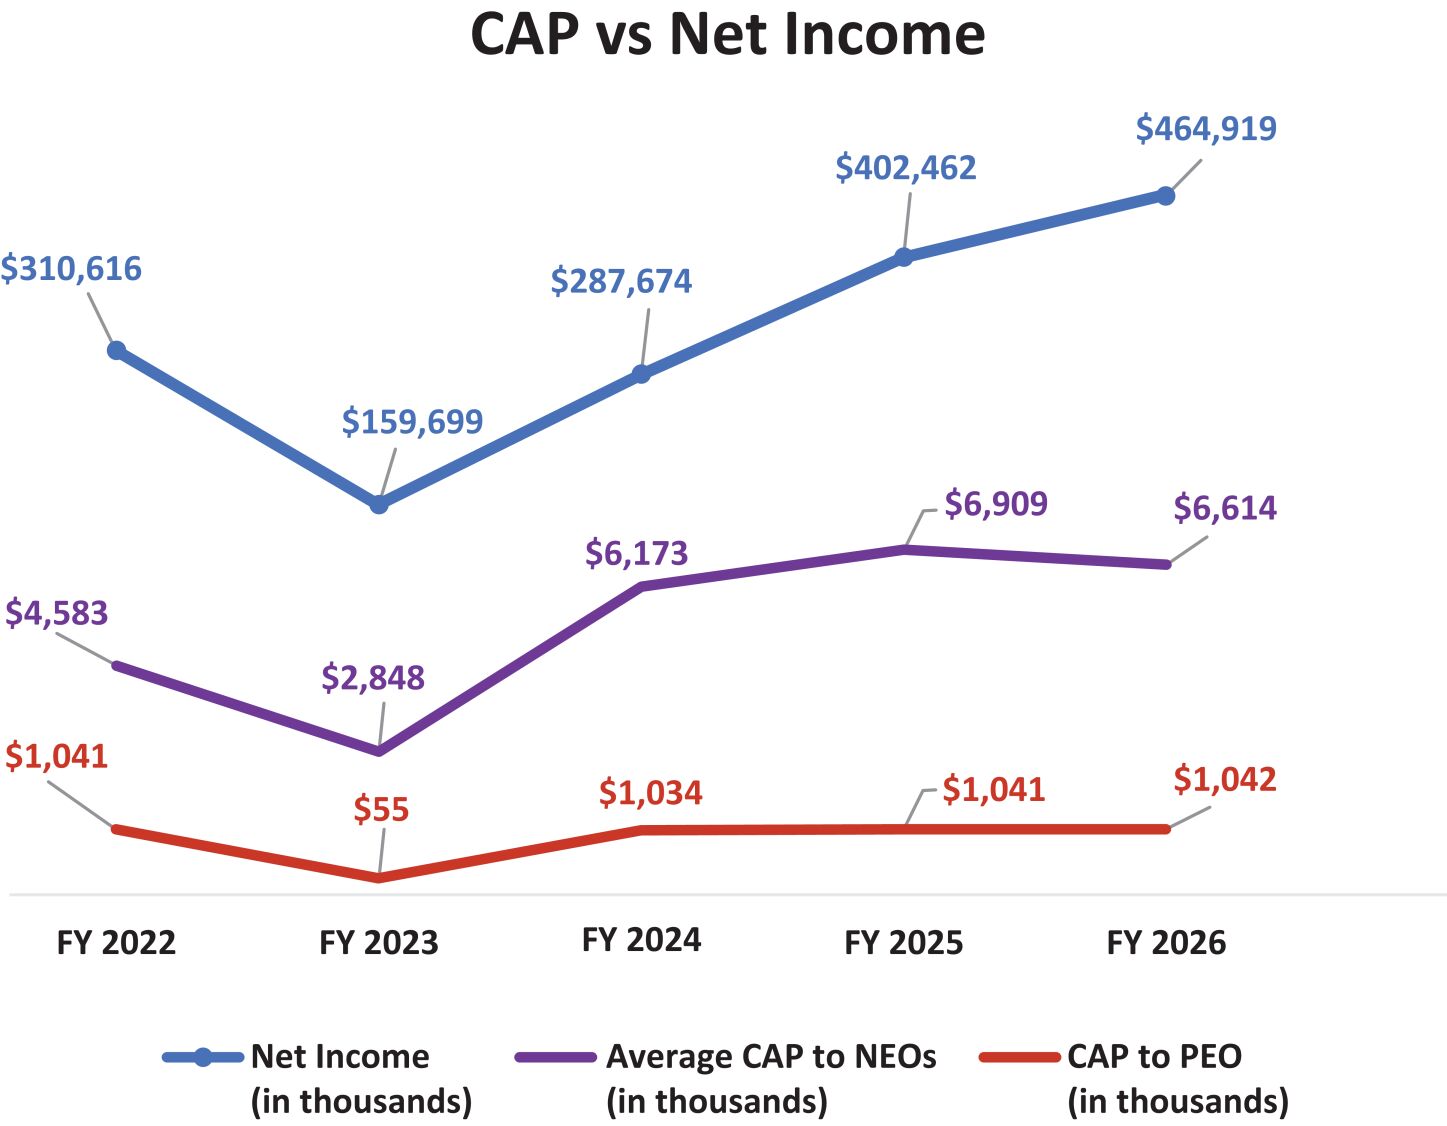
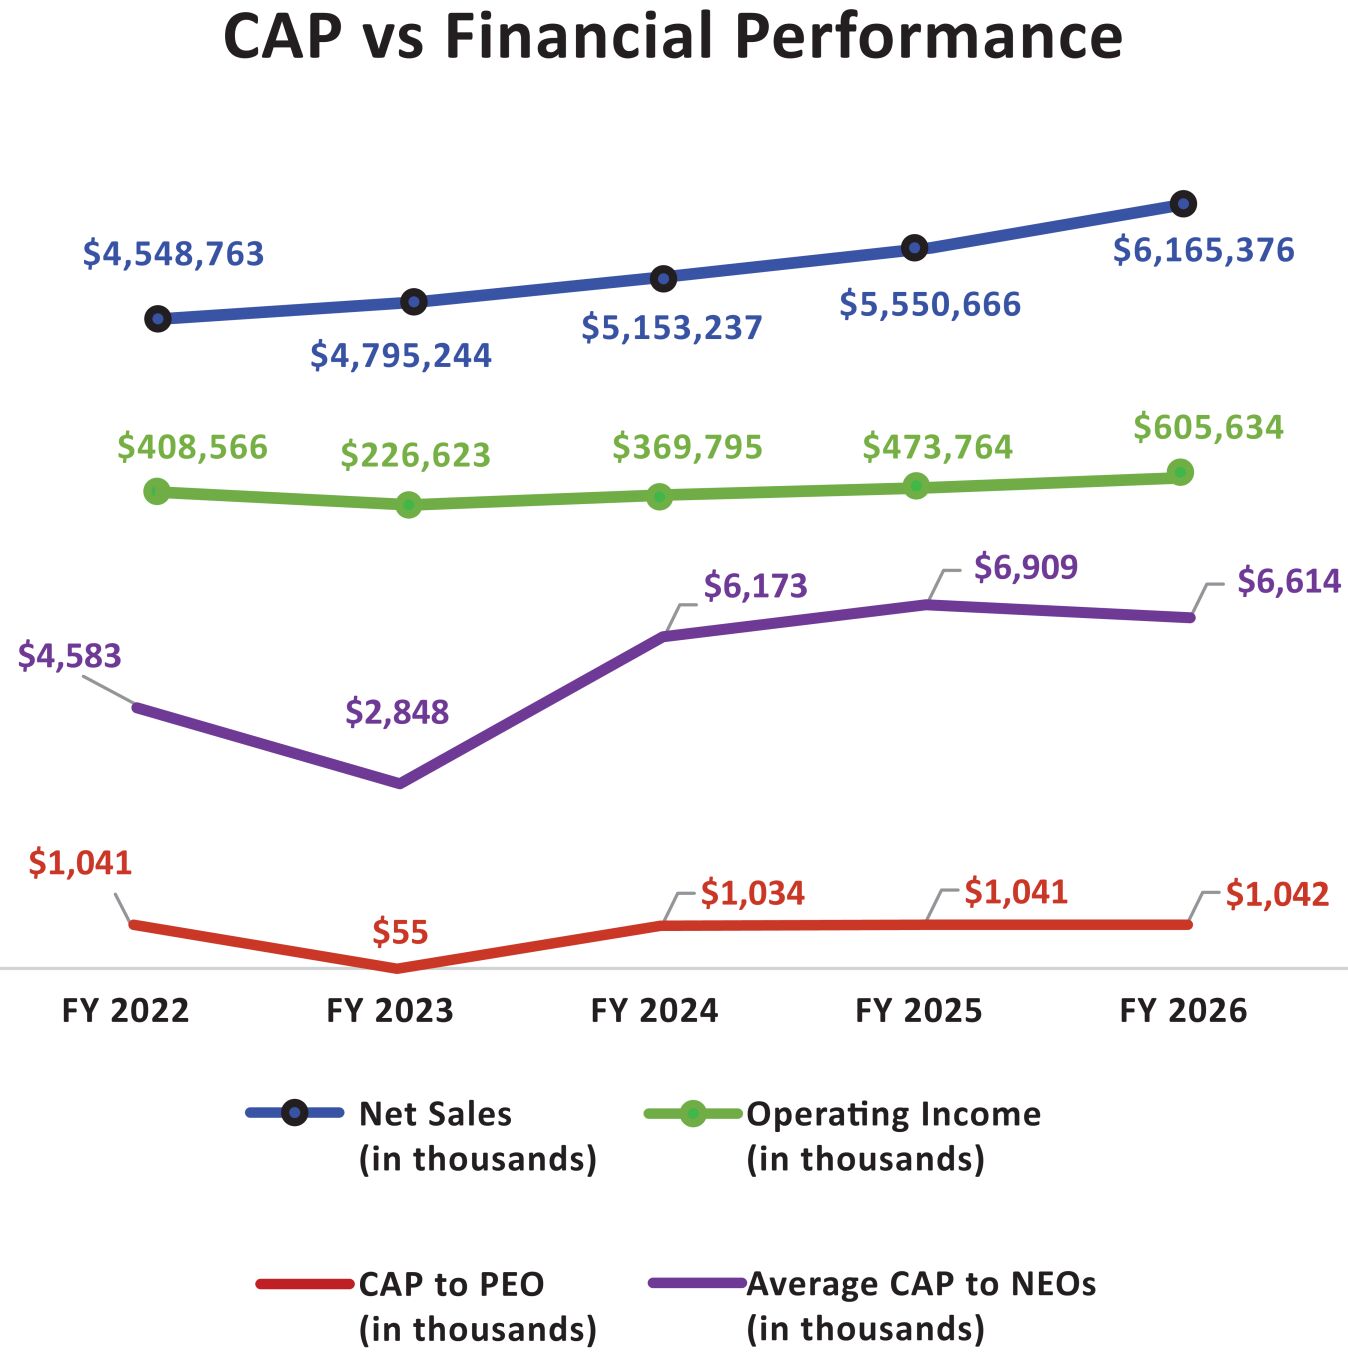
$ | 1,042,012 | $ | 1,042,012 | $ | 5,063,509 | $ | 6,613,750 | $ | 258.29 | $ | 215.18 | $ | 464,919 | $ | 6,165,376 | $ | 605,634 | ||||||||||||||||||
2025 |
$ | 1,041,140 | $ | 1,041,140 | $ | 4,251,737 | $ | 6,908,527 | $ | 202.04 | $ | 176.39 | $ | 402,462 | $ | 5,550,666 | $ | 473,764 | ||||||||||||||||||
2024 |
$ | 1,033,840 | $ | 1,033,840 | $ | 4,387,227 | $ | 6,173,466 | $ | 138.53 | $ | 137.19 | $ | 287,674 | $ | 5,153,237 | $ | 369,795 | ||||||||||||||||||
2023 |
$ | 55,462 | $ | 55,462 | $ | 2,901,291 | $ | 2,847,873 | $ | 99.85 | $ | 110.89 | $ | 159,699 | $ | 4,795,244 | $ | 226,623 | ||||||||||||||||||
2022 |
$ | 1,040,539 | $ | 1,040,539 | $ | 4,876,086 | $ | 4,582,685 | $ | 104.70 | $ | 103.83 | $ | 310,616 | $ | 4,548,763 | $ | 408,566 | ||||||||||||||||||
| (1) | The dollar amounts reported for Mr. Richard A. Hayne, our Chairman of the Board and Chief Executive Officer (“PEO”), under “Summary Compensation Table Total for PEO” are the amounts of total compensation reported for Mr. Hayne in the “Total” column of the Summary Compensation Table for each applicable year. |
| (2) | The dollar amounts reported for Mr. Hayne under “Compensation Actually Paid” represent the amount of “compensation actually paid” to Mr. Hayne, as computed in accordance with Item 402(v) of Regulation S-K in each applicable year. Mr. Hayne received no equity-based or pension-based compensation in any fiscal year presented on the table above, accordingly, no adjustments were required under Item 402(v) of Regulation S-K to determine Mr. Hayne’s compensation actually paid and none are presented herein. |
| (3) | The dollar amounts reported under “Average Summary Compensation Total for non-PEO Named Executive Officers” represent the average of the amounts reported for the Company’s NEOs as a group (excluding any individual serving as our CEO for such year) in the “Total” column of the Summary Compensation Table in each applicable year. The names of the NEOs included for purposes of calculating the average amounts in each applicable year are as follows: (i) for fiscal 2026, Francis J. Conforti, Sheila B. Harrington, Margaret A. Hayne and Melanie Marein-Efron; (ii) for fiscal 2025, Francis J. Conforti, Sheila B. Harrington, Margaret A. Hayne and Melanie Marein-Efron; (iii) for fiscal 2024, Francis J. Conforti, Sheila B. Harrington, Margaret A. Hayne and Melanie Marein-Efron; (iv) for fiscal 2023, Francis J. Conforti, Sheila B. Harrington, Melanie Marein-Efron and Tricia D. Smith; and (v) for fiscal 2022, Francis J. Conforti, Sheila B. Harrington, Margaret A. Hayne and Melanie Marein-Efron. |
| (4) | The dollar amounts reported under “Average Compensation Actually Paid for non-PEO Named Executive Office rs” represent the average amount of “compensation actually paid” to the NEOs as a group (excluding the CEO), as computed in accordance with Item 402(v) of Regulation S-K in each applicable year. The dollar amounts do not reflect the actual average amount of compensation earned by or paid to the NEOs as a group during the applicable year. In accordance with the requirements of Item 402(v) of Regulation S-K, the adjustments in the table below were made to the NEOs’ total compensation for each year to determine the compensation actually paid: |
NEO Averages |
||||||||||||||||||||
2026 |
2025 |
2024 |
2023 |
2022 |
||||||||||||||||
Total Compensation as reported in the Summary Compensation Table |
$ | 5,063,509 | $ | 4,251,737 | $ | 4,387,227 | $ | 2,901,291 | $ | 4,876,086 | ||||||||||
(Deduct): Fair value of equity compensation granted during the covered fiscal year as reported in the Summary Compensation Table |
$ | (1,524,587 | ) | $ | (1,449,971 | ) | $ | (1,450,003 | ) | $ | (1,395,900 | ) | $ | (2,718,188 | ) | |||||
Add: Fair value at year end of equity compensation granted in the covered fiscal year that was outstanding and unvested at the covered fiscal year end |
$ | 1,902,712 | $ | 1,916,922 | $ | 2,043,773 | $ | 1,506,450 | $ | 2,046,300 | ||||||||||
Add or (Deduct): The change in fair value of any awards granted in prior years that were outstanding and unvested as of the end of the covered fiscal year |
$ | 1,382,729 | $ | 2,018,421 | $ | 1,229,442 | $ | (121,363 | ) | $ | 240,148 | |||||||||
Add: Fair value as of the vesting date of awards granted and vested during the covered fiscal year |
$ | — | $ | — | $ | — | $ | — | $ | — | ||||||||||
Add or (Deduct): For awards granted in prior years for which all applicable vesting conditions were satisfied at the end of or during the covered fiscal year, the change in the fair value from the end of the prior fiscal year to the vesting date |
$ | (210,613 | ) | $ | 171,418 | $ | (36,973 | ) | $ | (42,605 | ) | $ | 138,339 | |||||||
Deduct: For awards granted in prior years that failed to meet the applicable vesting conditions during the covered fiscal year (i.e., were forfeited), the amount equal to the fair value at the end of the prior fiscal year |
$ | — | $ | — | $ | — | $ | — | $ | — | ||||||||||
Compensation Actually Paid to NEO |
$ | 6,613,750 | $ | 6,908,527 | $ | 6,173,466 | $ | 2,847,873 | $ | 4,582,685 | ||||||||||
In calculating compensation actually paid, the Company determined the fair value of outsta
nd
ing, vested and forfeited awards in the covered year in accordance with SEC rules for compensation actually paid and computed in a manner consistent with ASC 718 fair valuation used to account for share-based payments for purposes of the financial statements consistent with U.S. generally accepted accounting principles. Restricted stock units are valued based on the share price on the relevant measurement date. Performance stock units are also valued at the share price on the relevant measurement date, except that such values are multiplied by the estimated probability of achievement as of the measurement date. | (5) | Cumulative total shareholder return (“TSR”) is calculated assuming a fixed investment of $100, including the reinvestment of dividends (as applicable) measured from the market close on January 31, 2021, through and including the end of the fiscal year for each year reported on the table. |
| (6) | The peer group used for this purpose is the following published industry index: S&P 500 Apparel Retail. |
| (5) | Cumulative total shareholder return (“TSR”) is calculated assuming a fixed investment of $100, including the reinvestment of dividends (as applicable) measured from the market close on January 31, 2021, through and including the end of the fiscal year for each year reported on the table. |
| (6) | The peer group used for this purpose is the following published industry index: S&P 500 Apparel Retail. |
| (4) | The dollar amounts reported under “Average Compensation Actually Paid for non-PEO Named Executive Office rs” represent the average amount of “compensation actually paid” to the NEOs as a group (excluding the CEO), as computed in accordance with Item 402(v) of Regulation S-K in each applicable year. The dollar amounts do not reflect the actual average amount of compensation earned by or paid to the NEOs as a group during the applicable year. In accordance with the requirements of Item 402(v) of Regulation S-K, the adjustments in the table below were made to the NEOs’ total compensation for each year to determine the compensation actually paid: |
NEO Averages |
||||||||||||||||||||
2026 |
2025 |
2024 |
2023 |
2022 |
||||||||||||||||
Total Compensation as reported in the Summary Compensation Table |
$ | 5,063,509 | $ | 4,251,737 | $ | 4,387,227 | $ | 2,901,291 | $ | 4,876,086 | ||||||||||
(Deduct): Fair value of equity compensation granted during the covered fiscal year as reported in the Summary Compensation Table |
$ | (1,524,587 | ) | $ | (1,449,971 | ) | $ | (1,450,003 | ) | $ | (1,395,900 | ) | $ | (2,718,188 | ) | |||||
Add: Fair value at year end of equity compensation granted in the covered fiscal year that was outstanding and unvested at the covered fiscal year end |
$ | 1,902,712 | $ | 1,916,922 | $ | 2,043,773 | $ | 1,506,450 | $ | 2,046,300 | ||||||||||
Add or (Deduct): The change in fair value of any awards granted in prior years that were outstanding and unvested as of the end of the covered fiscal year |
$ | 1,382,729 | $ | 2,018,421 | $ | 1,229,442 | $ | (121,363 | ) | $ | 240,148 | |||||||||
Add: Fair value as of the vesting date of awards granted and vested during the covered fiscal year |
$ | — | $ | — | $ | — | $ | — | $ | — | ||||||||||
Add or (Deduct): For awards granted in prior years for which all applicable vesting conditions were satisfied at the end of or during the covered fiscal year, the change in the fair value from the end of the prior fiscal year to the vesting date |
$ | (210,613 | ) | $ | 171,418 | $ | (36,973 | ) | $ | (42,605 | ) | $ | 138,339 | |||||||
Deduct: For awards granted in prior years that failed to meet the applicable vesting conditions during the covered fiscal year (i.e., were forfeited), the amount equal to the fair value at the end of the prior fiscal year |
$ | — | $ | — | $ | — | $ | — | $ | — | ||||||||||
Compensation Actually Paid to NEO |
$ | 6,613,750 | $ | 6,908,527 | $ | 6,173,466 | $ | 2,847,873 | $ | 4,582,685 | ||||||||||
Financial Performance Measures
As described in greater detail in “Compensation of Executive Officers”, our approach to executive compensation is designed to directly link pay to performance, recognize both corporate and individual performance, promote long-term stock ownership, attract, retain and motivate talented executives, and balance risk and reward while taking into consideration stakeholder feedback as well as market trends and practices. As described in “Compensation of Executive Officers,” the Company uses Net Sales and Operating Income, subject to certain adjustments described therein, in determining executives’ annual bonuses, and uses Operating Income rate in PSU awards. Accordingly, the financial measures used by the Company to link compensation actually paid (as defined by SEC rules) to the Company’s named executive officers for the most recently completed fiscal year to the Company’s performance are:
| • | Net Sales, |
| • | Operating Income, and |
| • | Operating Income rate. |