The following table presents “Compensation Actually Paid” to the Principal Executive Officer (“PEO”) and the “Average Compensation Actually Paid” to the Non-PEO NEOs in 2025, 2024, 2023, 2022 and 2021, as calculated pursuant to SEC rules.
| Year (a) | Summary | Compensation | Average | Average | Value of Initial Fixed $100 Investment Based On: | Net Income | Annual Growth in Compensation Value per Share(d) | |
| Total | Peer Group Total | |||||||
| 2025 | 8,064,309 | 16,330,438 | 5,092,417 | 8,846,701 | 208.42 | 234.32 | 1,106.4 | 22.8% |
| 2024 | 7,422,958 | 14,100,992 | 4,213,430 | 6,247,597 | 175.12 | 227.67 | 230.4 | 8.3% |
| 2023 | 7,577,001 | 11,680,222 | 3,697,210 | 4,999,435 | 135.42 | 168.05 | 509.2 | 14.5% |
| 2022 | 7,191,754 | 23,147,640 | 3,169,569 | 7,992,051 | 127.17 | 151.65 | 792.8 | 23.9% |
| 2021 | 7,185,569 | 4,639,595 | 2,906,827 | 2,095,752 | 91.08 | 127.58 | (275.4) | -1.2% |
| (a) | The PEO and Non-PEO NEOs for the applicable years were as follows: |
| 2025 and 2024: Mr. Rountree served as PEO and Messrs. Caffrey, Harrison and Seelig and Ms. Hildreth served as Non-PEO NEOs | |
| 2023 and 2022: Mr. Rountree served as PEO and Messrs. Caffrey, Campbell and Seelig and Ms. Hildreth served as Non-PEO NEOs | |
| 2021: Mr. Rountree served as PEO and Messrs. Frank Bazos, Campbell and Seelig and Ms. Hildreth served as Non-PEO NEOs |
| (b) | The amounts reported as “Compensation Actually Paid” to our PEO and “Average Compensation Actually Paid” to our Non-PEO NEOs in each of 2025, 2024, 2023, 2022 and 2021 represent the respective amounts as determined in accordance with Item 402(v) of Regulation S-K. The amounts do not reflect the actual amount of compensation earned by or paid to our PEO or Non-PEO NEOs during the applicable year. The Summary Compensation Table totals reported for the PEO and the average of the Non-PEO NEOs for each year were subject to the following adjustments per Item 402(v)(2)(iii) of Regulation S-K to calculate “Compensation Actually Paid”: |
| PEO | ||||||||
| 2025 | 2024 | 2023 | 2022 | 2021 | ||||
| Summary Compensation Table (“SCT”) total | 8,064,309 | 7,422,958 | 7,577,001 | 7,191,754 | 7,185,569 | |||
| Less: Value Reported in the SCT of Stock Awards | (5,954,618) | (6,352,596) | (5,872,920) | (5,604,282) | (6,478,434) | |||
| Granted in the Covered Year | ||||||||
| Plus: Year-end Value for Stock Awards | 8,613,356 | 7,004,016 | 6,775,045 | 11,461,473 | 4,107,645 | |||
| Granted in the Covered Year | ||||||||
| Change in Fair Value of Unvested Stock | 6,146,203 | 4,766,206 | 2,602,290 | 9,901,354 | (1,500,285) | |||
| Awards from Prior Years that Remain Unvested | ||||||||
| Change in Fair Value of Stock Awards | (538,812) | 1,260,408 | 598,806 | 197,341 | 1,325,100 | |||
| from Prior Years that Vested in Covered Year | ||||||||
| Compensation Actually Paid | 16,330,438 | 14,100,992 | 11,680,222 | 23,147,640 | 4,639,595 | |||
| Average of the Non-PEO NEOs | ||||||||
| 2025 | 2024 | 2023 | 2022 | 2021 | ||||
| Summary Compensation Table (“SCT”) total | 5,092,417 | 4,213,430 | 3,697,210 | 3,169,569 | 2,906,827 | |||
| Less: Value Reported in the SCT of Stock Awards | (3,091,821) | (3,179,651) | (2,092,228) | (1,686,474) | (2,039,507) | |||
| Granted in the Covered Year | ||||||||
| Plus: Year-end Value for Stock Awards | 4,472,319 | 3,526,328 | 2,413,610 | 3,449,054 | 1,293,148 | |||
| Granted in the Covered Year | ||||||||
| Change in Fair Value of Unvested Stock | 2,535,929 | 1,500,763 | 808,963 | 3,003,988 | (528,501) | |||
| Awards from Prior Years that Remain Unvested | ||||||||
| Change in Fair Value of Stock Awards | (162,143) | 186,727 | 171,880 | 55,912 | 463,785 | |||
| from Prior Years that Vested in Covered Year | ||||||||
| Compensation Actually Paid | 8,846,701 | 6,247,597 | 4,999,435 | 7,992,051 | 2,095,752 | |||
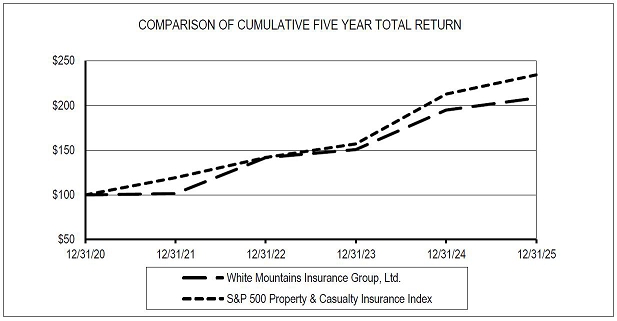
| (c) | Peer Group Total Shareholder Return “TSR” reflects the S&P 500 Property & Casualty Insurance Index as reflected in our Annual Report on the Form 10-K pursuant to Item 201(e) of Regulation S-K for the fiscal year ended December 31, 2025. Each year reflects what the cumulative value of $100 would be, including the reinvestment of dividends, if such amount had been invested on December 31, 2020. |
| (d) | For calendar years 2025 and forward, CVPS is the average of growth in book value per share (BVPS) and growth in intrinsic value per share, which is the BVPS including franchise value adjustments to reflect a conservative estimate of the fair value of certain subsidiaries/affiliates carried at book value. For calendar years through 2024, CVPS is the average of growth in adjusted book value per share (ABVPS) and growth in intrinsic value per share. See Annex A for a reconciliation of growth in ABVPS and BVPS to growth in intrinsic value per share. |
| (a) | The PEO and Non-PEO NEOs for the applicable years were as follows: |
| 2025 and 2024: Mr. Rountree served as PEO and Messrs. Caffrey, Harrison and Seelig and Ms. Hildreth served as Non-PEO NEOs | |
| 2023 and 2022: Mr. Rountree served as PEO and Messrs. Caffrey, Campbell and Seelig and Ms. Hildreth served as Non-PEO NEOs | |
| 2021: Mr. Rountree served as PEO and Messrs. Frank Bazos, Campbell and Seelig and Ms. Hildreth served as Non-PEO NEOs |
| (c) | Peer Group Total Shareholder Return “TSR” reflects the S&P 500 Property & Casualty Insurance Index as reflected in our Annual Report on the Form 10-K pursuant to Item 201(e) of Regulation S-K for the fiscal year ended December 31, 2025. Each year reflects what the cumulative value of $100 would be, including the reinvestment of dividends, if such amount had been invested on December 31, 2020. |
| (b) | The amounts reported as “Compensation Actually Paid” to our PEO and “Average Compensation Actually Paid” to our Non-PEO NEOs in each of 2025, 2024, 2023, 2022 and 2021 represent the respective amounts as determined in accordance with Item 402(v) of Regulation S-K. The amounts do not reflect the actual amount of compensation earned by or paid to our PEO or Non-PEO NEOs during the applicable year. The Summary Compensation Table totals reported for the PEO and the average of the Non-PEO NEOs for each year were subject to the following adjustments per Item 402(v)(2)(iii) of Regulation S-K to calculate “Compensation Actually Paid”: |
| PEO | ||||||||
| 2025 | 2024 | 2023 | 2022 | 2021 | ||||
| Summary Compensation Table (“SCT”) total | 8,064,309 | 7,422,958 | 7,577,001 | 7,191,754 | 7,185,569 | |||
| Less: Value Reported in the SCT of Stock Awards | (5,954,618) | (6,352,596) | (5,872,920) | (5,604,282) | (6,478,434) | |||
| Granted in the Covered Year | ||||||||
| Plus: Year-end Value for Stock Awards | 8,613,356 | 7,004,016 | 6,775,045 | 11,461,473 | 4,107,645 | |||
| Granted in the Covered Year | ||||||||
| Change in Fair Value of Unvested Stock | 6,146,203 | 4,766,206 | 2,602,290 | 9,901,354 | (1,500,285) | |||
| Awards from Prior Years that Remain Unvested | ||||||||
| Change in Fair Value of Stock Awards | (538,812) | 1,260,408 | 598,806 | 197,341 | 1,325,100 | |||
| from Prior Years that Vested in Covered Year | ||||||||
| Compensation Actually Paid | 16,330,438 | 14,100,992 | 11,680,222 | 23,147,640 | 4,639,595 | |||
| Average of the Non-PEO NEOs | ||||||||
| 2025 | 2024 | 2023 | 2022 | 2021 | ||||
| Summary Compensation Table (“SCT”) total | 5,092,417 | 4,213,430 | 3,697,210 | 3,169,569 | 2,906,827 | |||
| Less: Value Reported in the SCT of Stock Awards | (3,091,821) | (3,179,651) | (2,092,228) | (1,686,474) | (2,039,507) | |||
| Granted in the Covered Year | ||||||||
| Plus: Year-end Value for Stock Awards | 4,472,319 | 3,526,328 | 2,413,610 | 3,449,054 | 1,293,148 | |||
| Granted in the Covered Year | ||||||||
| Change in Fair Value of Unvested Stock | 2,535,929 | 1,500,763 | 808,963 | 3,003,988 | (528,501) | |||
| Awards from Prior Years that Remain Unvested | ||||||||
| Change in Fair Value of Stock Awards | (162,143) | 186,727 | 171,880 | 55,912 | 463,785 | |||
| from Prior Years that Vested in Covered Year | ||||||||
| Compensation Actually Paid | 8,846,701 | 6,247,597 | 4,999,435 | 7,992,051 | 2,095,752 | |||
Relationship Between Pay and Performance
In 2025, strong growth in CVPS positively correlated with growth in Compensation Actually Paid for the following reasons. Based on the Company’s performance of 22.8% growth in CVPS in 2025, the PEO and NEOs received bonuses of 200% of target for 2025. During 2025, the fair value of all performance shares included in the calculation of Compensation Actually Paid to the PEO and Average Compensation Actually Paid to the non-PEO NEOs increased significantly as (1) the level of growth in CVPS resulted in higher projected payout percentages on all outstanding performance cycles and (2) the Company’s share price increased by 6.8% during 2025. The fair value of all restricted shares outstanding used in the calculation of Compensation Actually Paid to the PEO and Average Compensation Actually Paid to the non-PEO NEOs also increased in 2025 as a direct result of the 6.8% increase in the Company’s share price during the year. The increase in the Company’s net income also positively correlated with growth in compensation actually paid as net income drove the increase in growth in CVPS. The Company’s TSR also positively correlated with the level of compensation actually paid, though not as much as growth in CVPS, as the increase in share price partially accounted for the increase in value in outstanding performance shares and restricted shares. In 2024, Compensation Actually Paid to the PEO and Average Compensation Actually Paid to the non-PEO NEOs increased compared to 2023. The primary driver was an increase in the fair value of all performance and restricted shares included in the calculation of Compensation Actually Paid to the PEO and Average Compensation Actually Paid to the non-PEO NEOs as the Company’s share price increased by 29.2% during 2024, compared to a 6.4% increase during 2023. Partially mitigating this increase, CVPS grew at a slower pace in 2024 than in 2023 resulting in a slightly lower projected payout percentage on the 2023-2025 performance cycle in 2024. Based on the Company’s performance of 8.3% growth in CVPS in 2024, the PEO and NEOs received bonuses of 47% of target for 2024 compared to 170% of target for 2023. The Company’s net income of $230.4 million in 2024 compared to $509.2 million in 2023 contributed to the decrease in growth in CVPS. The Company’s TSR positively correlated with the level of Compensation Actually Paid as the increase in the Company’s share price primarily accounted for the increase in value in outstanding performance shares and restricted shares. In 2023, CVPS grew at a slower pace than in 2022 resulting in a decrease in Compensation Actually Paid in 2023 compared to 2022. Based on the Company’s performance of 14.5% growth in CVPS in 2023, the PEO and NEOs received bonuses of 170% of target for 2023. During 2023, the fair value of all performance shares included in the calculation of Compensation Actually Paid to the PEO and Average Compensation Actually Paid to the non-PEO NEOs increased as (1) the level of growth in CVPS resulted in a higher projected payout percentage on the 2021-2023 performance cycle and (2) the Company’s share price increased by 6.4% during 2023. However, both of these factors increased at a lower rate than in 2022. The fair value of all restricted shares outstanding used in the calculation of Compensation Actually Paid to the PEO and Average Compensation Actually Paid to the non-PEO NEOs also increased in 2023 as a direct result of the 6.4% increase in the Company’s share price during the year, which was lower than the 39.5% increase in 2022. The Company’s net income of |
|
$509.2 million in 2023 positively correlated with growth in compensation actually paid as net income drove the increase in growth in CVPS. The Company’s TSR also positively correlated with the level of compensation actually paid, though not as much as growth in CVPS, as the increase in share price partially accounted for the increase in value in outstanding performance shares and restricted shares. In 2022, strong growth in CVPS positively correlated with growth in Compensation Actually Paid for the following reasons. Based on the Company’s performance of 23.9% growth in CVPS in 2022, the PEO and NEOs received bonuses of 200% of target for 2022. During 2022, the fair value of all performance shares included in the calculation of Compensation Actually Paid to the PEO and Average Compensation Actually Paid to the non-PEO NEOs increased significantly as (1) the level of growth in CVPS resulted in higher projected payout percentages on all outstanding performance cycles and (2) the Company’s share price increased by 39.5% during 2022. The fair value of all restricted shares outstanding used in the calculation of Compensation Actually Paid to the PEO and Average Compensation Actually Paid to the non-PEO NEOs also increased in 2022 as a direct result of the 39.5% increase in the Company’s share price during the year. The increase in the Company’s net income also positively correlated with growth in compensation actually paid as net income drove the increase in growth in CVPS. The Company’s TSR also positively correlated with the level of compensation actually paid, though not as much as growth in CVPS, as the increase in share price partially accounted for the increase in value in outstanding performance shares and restricted shares. In 2021, negative growth in CVPS correlated with a decrease in compensation actually paid. For 2021, the PEO and NEOs received no bonuses and projected payout percentages on outstanding performance shares decreased from the prior year end. The decrease in the Company’s net income also correlated with the decrease in compensation actually paid as the net loss drove the decrease in growth in CVPS. The Company’s TSR of 1.4% somewhat correlated with the lower level of compensation actually paid. The small increase in the value of each restricted share and performance share outstanding was more than offset by the reduction in the projected payout percentages on all outstanding performance share cycles due to the negative growth in CVPS. The following chart provides a graphical representation of the Company's five-year cumulative TSR versus our industry peer group, the S&P 500 Property & Casualty Insurance Index. |
Financial Performance Measures
As described in more detail in “Compensation Discussion & Analysis” beginning on page 28, our approach to executive compensation is designed with the primary goal of maximizing shareholder value over long periods of time. We believe that this goal is best pursued by utilizing a pay-for-performance program that closely aligns the financial interests of management with those of our shareholders while rewarding appropriate risk taking. We accomplish this by emphasizing variable long-term compensation, the value of which is tied to performance over a number of years rather than fixed entitlements (such as base salary, pensions, and employee benefits). Annual growth in CVPS determines the level of payout under our formulaic annual bonus program, and annual growth in CVPS over the three-year performance cycle determines the number of shares earned from each grant of performance shares. The market value of our shares is not included as a direct measure of performance, but it determines the ultimate value of earned performance and restricted share awards. The most important financial measure used by the Company to link compensation actually paid (as defined by SEC rules) to the Company’s NEOs for 2025 to the Company’s performance is growth in CVPS.
| (d) | For calendar years 2025 and forward, CVPS is the average of growth in book value per share (BVPS) and growth in intrinsic value per share, which is the BVPS including franchise value adjustments to reflect a conservative estimate of the fair value of certain subsidiaries/affiliates carried at book value. For calendar years through 2024, CVPS is the average of growth in adjusted book value per share (ABVPS) and growth in intrinsic value per share. See Annex A for a reconciliation of growth in ABVPS and BVPS to growth in intrinsic value per share. |