Performance Management - Cantor Fitzgerald Commodity Return Strategy Portfolio |
Apr. 01, 2026 |
||||||||||||||||||||||||||||||||||||||||||||||||||||||||||||||||||||||||||||||||||||||||
|---|---|---|---|---|---|---|---|---|---|---|---|---|---|---|---|---|---|---|---|---|---|---|---|---|---|---|---|---|---|---|---|---|---|---|---|---|---|---|---|---|---|---|---|---|---|---|---|---|---|---|---|---|---|---|---|---|---|---|---|---|---|---|---|---|---|---|---|---|---|---|---|---|---|---|---|---|---|---|---|---|---|---|---|---|---|---|---|---|---|
| Prospectus [Line Items] | |||||||||||||||||||||||||||||||||||||||||||||||||||||||||||||||||||||||||||||||||||||||||
| Bar Chart and Performance Table [Heading] | Performance | ||||||||||||||||||||||||||||||||||||||||||||||||||||||||||||||||||||||||||||||||||||||||
| Performance Narrative [Text Block] | The accompanying bar chart and table provide an indication of the risks of investing in the portfolio. The bar chart shows you how performance of the portfolio’s Class 1 shares (which was previously an undesignated share class of the portfolio), has varied from year to year for up to 10 years. The table compares the portfolio’s performance to that of a broad-based securities market index (i.e., a regulatory index). The portfolio’s regulatory index is the Bloomberg US Aggregate Bond Index. The portfolio’s regulatory index is shown in connection with certain regulatory requirements to provide a broad measure of market performance. The table also compares the portfolio’s performance to the BCOM Index, which is currently composed of futures contracts on 25 physical commodities. Prior to April 1, 2026, the portfolio’s investment adviser was UBS Asset Management (Americas) LLC. Effective April 1, 2026, the portfolio’s investment adviser changed from UBS Asset Management (Americas) LLC to O’Connor Alternative Investments. There were no changes to the portfolio’s investment objective or investment strategies in connection with the change in the portfolio’s investment adviser. The bar chart and table do not reflect additional charges and expenses which are, or may be, imposed under the variable contracts or plans; such charges and expenses are described in the prospectus of the insurance company separate account or in the plan documents or other informational materials supplied by plan sponsors. Inclusion of these charges would reduce the total return for the periods shown. As with all mutual funds, past performance is not a prediction of future performance.
The portfolio makes updated performance available at the portfolio’s website (https://commodities.cantorassetmanagement.com/) or by calling the portfolio at 855-922-6867. |
||||||||||||||||||||||||||||||||||||||||||||||||||||||||||||||||||||||||||||||||||||||||
| Performance Past Does Not Indicate Future [Text] | As with all mutual funds, past performance is not a prediction of future performance. | ||||||||||||||||||||||||||||||||||||||||||||||||||||||||||||||||||||||||||||||||||||||||
| Performance Information Illustrates Variability of Returns [Text] | The accompanying bar chart and table provide an indication of the risks of investing in the portfolio. | ||||||||||||||||||||||||||||||||||||||||||||||||||||||||||||||||||||||||||||||||||||||||
| Bar Chart Does Not Reflect Sales Loads [Text] | The bar chart and table do not reflect additional charges and expenses which are, or may be, imposed under the variable contracts or plans; such charges and expenses are described in the prospectus of the insurance company separate account or in the plan documents or other informational materials supplied by plan sponsors. Inclusion of these charges would reduce the total return for the periods shown. | ||||||||||||||||||||||||||||||||||||||||||||||||||||||||||||||||||||||||||||||||||||||||
| Bar Chart [Heading] | Year-by-year total returns | ||||||||||||||||||||||||||||||||||||||||||||||||||||||||||||||||||||||||||||||||||||||||
| Bar Chart [Table] |
|
||||||||||||||||||||||||||||||||||||||||||||||||||||||||||||||||||||||||||||||||||||||||
| Bar Chart Closing [Text Block] | 
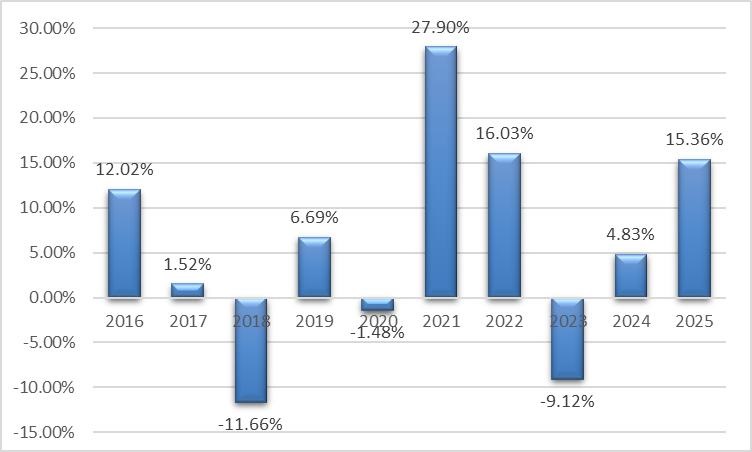
Best quarter: 25.39% () Inception date: 2/28/06 |
||||||||||||||||||||||||||||||||||||||||||||||||||||||||||||||||||||||||||||||||||||||||
| Highest Quarterly Return, Label [Optional Text] | Best quarter | ||||||||||||||||||||||||||||||||||||||||||||||||||||||||||||||||||||||||||||||||||||||||
| Highest Quarterly Return | 25.39% | ||||||||||||||||||||||||||||||||||||||||||||||||||||||||||||||||||||||||||||||||||||||||
| Highest Quarterly Return, Date | Mar. 31, 2022 | ||||||||||||||||||||||||||||||||||||||||||||||||||||||||||||||||||||||||||||||||||||||||
| Lowest Quarterly Return, Label [Optional Text] | Worst quarter | ||||||||||||||||||||||||||||||||||||||||||||||||||||||||||||||||||||||||||||||||||||||||
| Lowest Quarterly Return | (22.17%) | ||||||||||||||||||||||||||||||||||||||||||||||||||||||||||||||||||||||||||||||||||||||||
| Lowest Quarterly Return, Date | Mar. 31, 2020 | ||||||||||||||||||||||||||||||||||||||||||||||||||||||||||||||||||||||||||||||||||||||||
| Performance Table Heading | Average annual total returns | ||||||||||||||||||||||||||||||||||||||||||||||||||||||||||||||||||||||||||||||||||||||||
| Performance [Table] |
|
||||||||||||||||||||||||||||||||||||||||||||||||||||||||||||||||||||||||||||||||||||||||
| Index No Deduction for Fees, Expenses, or Taxes [Text] | (reflects no deductions for fees or expenses) | ||||||||||||||||||||||||||||||||||||||||||||||||||||||||||||||||||||||||||||||||||||||||
| Performance Availability Website Address [Text] | https://commodities.cantorassetmanagement.com | ||||||||||||||||||||||||||||||||||||||||||||||||||||||||||||||||||||||||||||||||||||||||
| Performance Availability Phone [Text] | 855-922-6867 | ||||||||||||||||||||||||||||||||||||||||||||||||||||||||||||||||||||||||||||||||||||||||