Shareholder Report
|
12 Months Ended |
|
Jan. 31, 2026
USD ($)
Holding
|
|---|
| Shareholder Report [Line Items] |
|
|
| Document Type |
N-CSR
|
|
| Amendment Flag |
false
|
|
| Registrant Name |
AMERICAN BEACON SELECT FUNDS
|
|
| Entity Central Index Key |
0001096012
|
|
| Entity Investment Company Type |
N-1A
|
|
| Document Period End Date |
Jan. 31, 2026
|
|
| Shareholder Report Annual or Semi-Annual |
Annual Shareholder Report
|
|
| C000243995 |
|
|
| Shareholder Report [Line Items] |
|
|
| Fund Name |
AHL Trend ETF
|
|
| Trading Symbol |
AHLT
|
|
| Security Exchange Name |
NYSE
|
|
| Annual or Semi-Annual Statement [Text Block] |
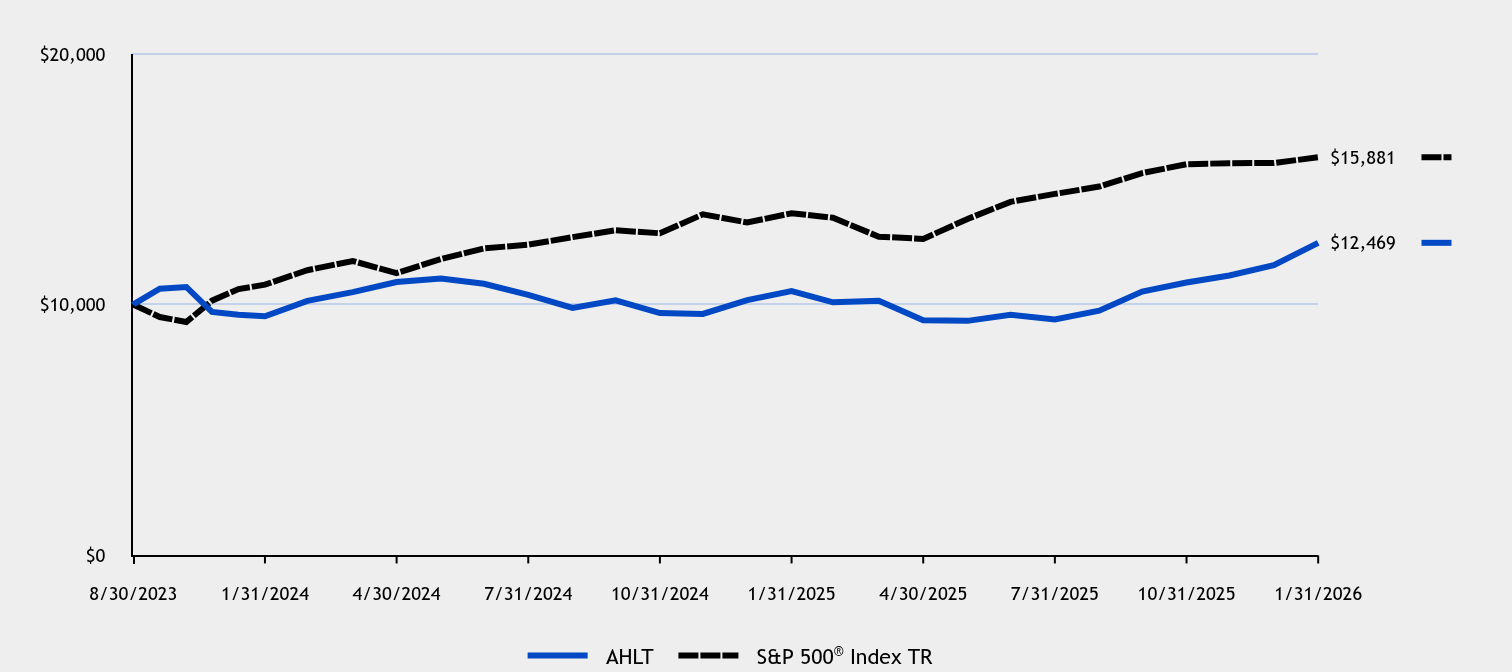
This annual shareholder report contains important information about American Beacon AHL Trend ETF for the period of February 1, 2025 to January 31, 2026.
|
|
| Additional Information [Text Block] |
You can find additional information about the Fund at www.americanbeaconfunds.com/fund-resources/. You can request this information by contacting us at 833-471-3562.
|
|
| Additional Information Phone Number |
833-471-3562
|
|
| Additional Information Website |
www.americanbeaconfunds.com/fund-resources/
|
|
| Expenses [Text Block] |
What were the Fund costs for the last year?(based on a hypothetical $10,000 investment)
Table Summary
Fund Name |
Costs of a $10,000 investment |
Costs paid as a percentage of a $10,000 investment |
AHL Trend ETF |
$104 |
0.96% | |
|
| Expenses Paid, Amount |
$ 104
|
|
| Expense Ratio, Percent |
0.96%
|
|
| Factors Affecting Performance [Text Block] |
How did the Fund perform and what affected its performance? The ETF returned 17.40% for the twelve months ended January 31, 2026, compared to the S&P 500® Index TR return of 16.35%. • The investment strategy of the Fund’s sub-advisor is designed to capitalize on price trends in a broad range of global markets across multiple asset classes. • Overall, the market environment over the twelve-month period was conducive to the sub-advisor’s trend following strategy led by performance in commodities and to a lesser extent equities. • Positions in fixed income and currencies detracted during the period. |
|
| Performance Past Does Not Indicate Future [Text] |
Performance shown is historical and is not indicative of future returns.
|
|
| Line Graph [Table Text Block] |
Table Summary
|
AHLT |
S&P 500® Index TR |
8/30/2023 |
$10,000 |
$10,000 |
8/31/2023 |
$10,036 |
$9,986 |
9/30/2023 |
$10,636 |
$9,510 |
10/31/2023 |
$10,708 |
$9,310 |
11/30/2023 |
$9,712 |
$10,161 |
12/31/2023 |
$9,598 |
$10,622 |
1/31/2024 |
$9,542 |
$10,801 |
2/29/2024 |
$10,156 |
$11,377 |
3/31/2024 |
$10,501 |
$11,743 |
4/30/2024 |
$10,904 |
$11,264 |
5/31/2024 |
$11,046 |
$11,822 |
6/30/2024 |
$10,834 |
$12,246 |
7/31/2024 |
$10,389 |
$12,395 |
8/31/2024 |
$9,875 |
$12,696 |
9/30/2024 |
$10,177 |
$12,967 |
10/31/2024 |
$9,667 |
$12,850 |
11/30/2024 |
$9,632 |
$13,604 |
12/31/2024 |
$10,182 |
$13,280 |
1/31/2025 |
$10,545 |
$13,650 |
2/28/2025 |
$10,095 |
$13,471 |
3/31/2025 |
$10,160 |
$12,712 |
4/30/2025 |
$9,382 |
$12,626 |
5/31/2025 |
$9,356 |
$13,421 |
6/30/2025 |
$9,598 |
$14,103 |
7/31/2025 |
$9,412 |
$14,420 |
8/31/2025 |
$9,762 |
$14,712 |
9/30/2025 |
$10,523 |
$15,249 |
10/31/2025 |
$10,886 |
$15,606 |
11/30/2025 |
$11,167 |
$15,645 |
12/31/2025 |
$11,576 |
$15,654 |
1/31/2026 |
$12,469 |
$15,881 |
|
|
| Average Annual Return [Table Text Block] |
Table Summary
Average Annual Total Returns (%) |
1 Year |
Since Inception (8/30/23) |
AHLTFootnote Reference1 |
17.40% |
9.26% |
S&P 500® Index TR |
16.35% |
21.22% | |
|
| Performance Inception Date |
Aug. 30, 2023
|
|
| No Deduction of Taxes [Text Block] |
The graph and table do not reflect the deduction of taxes that a shareholder would pay on fund distributions or redemption of fund shares.
|
|
| AssetsNet |
$ 50,021,323
|
|
| Holdings Count | Holding |
8
|
|
| Advisory Fees Paid, Amount |
$ 462,461
|
|
| InvestmentCompanyPortfolioTurnover |
0.00%
|
|
| Additional Fund Statistics [Text Block] |
Table Summary
Total Net Assets |
$50,021,323 |
# of Portfolio Holdings |
8 |
Portfolio Turnover RateFootnote Reference** |
0% |
Total Management Fees Paid |
$462,461 |
| Footnote |
Description |
Footnote** |
Portfolio turnover is based on the lesser of long-term purchases or sales divided by the average long-term fair value during the period. The Fund did not invest in any long-term securities during the reporting period. | |
|
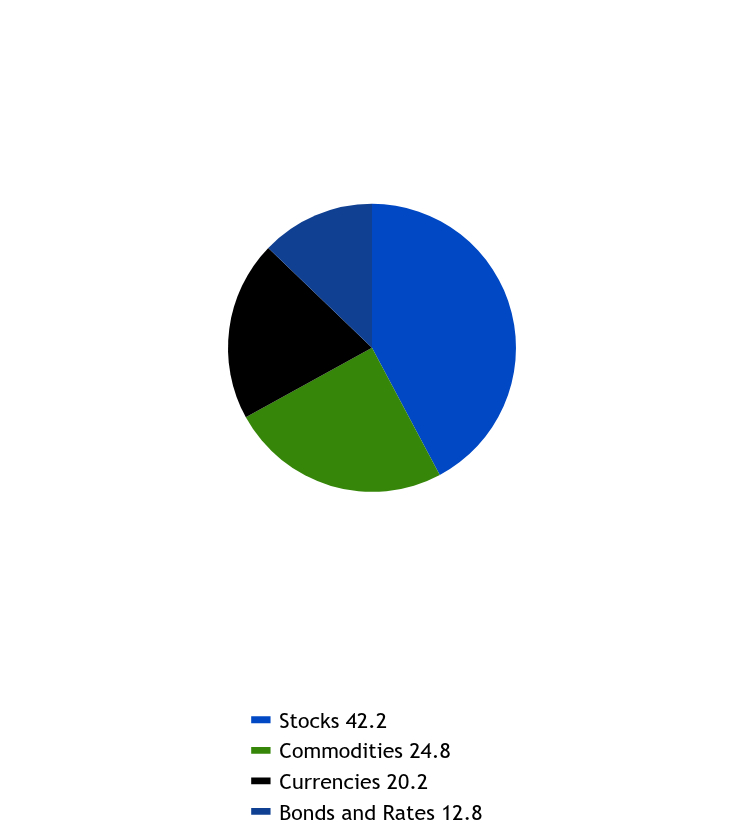
| Holdings [Text Block] |
Asset Class Exposure % of VaR*
Table Summary
Value |
Value |
Stocks |
42.2 |
Commodities |
24.8 |
Currencies |
20.2 |
Bonds and Rates |
12.8 | * Value at Risk (“VaR”) is a measure of the potential loss in value of a portfolio over a defined period for a given confidence interval. A one-day VaR at the 95% confidence level represents that there is a 5% probability that the mark-to-market loss on the portfolio over a one day horizon will exceed this value (assuming normal markets and no trading in the portfolio). Top Active Exposures by Asset Class % of VaR*
Table Summary
Commodities |
Header |
% of VaR |
Gold |
Long |
8.2 |
Silver |
Long |
7.4 |
Crude Oil |
Long |
5.6 |
Copper |
Long |
4.5 |
Currencies |
Header |
% of VaR |
Australian Dollar/US Dollar |
Long/Short |
8.6 |
Japanese Yen/US Dollar |
Short/Long |
6.1 |
UK Sterling/US Dollar |
Long/Short |
5.6 |
Euro/US Dollar |
Long/Short |
4.4 |
New Zealand/US Dollar |
Long/Short |
0.5 |
Equities |
Header |
% of VaR |
S&P 500 Index |
Long |
8.3 |
Russell 2000 Index |
Long |
6.2 |
Euro-STOXX |
Long |
5.4 |
NASDAQ 100 Index |
Long |
4.5 |
FTSE 100 |
Long |
4.4 |
Fixed Income |
Header |
% of VaR |
Euro-BUND |
Short |
5.1 |
US Treasuries |
Short |
2.6 |
Euro-BOBL |
Short |
2.5 |
Gilts |
Long |
1.3 | Exposure Summary (Consolidated with Subsidiary)
Table Summary
Number of Long Holdings |
12 |
Number of Currency Pairs |
7 |
Number of Short Holdings |
3 | |
|
| Largest Holdings [Text Block] |
Top Ten Exposures % of VaR*
Table Summary
Australian Dollar/US Dollar |
Long/Short |
8.6 |
S&P 500 Index |
Long |
8.3 |
Gold |
Long |
8.2 |
Silver |
Long |
7.4 |
Russell 2000 Index |
Long |
6.2 |
Japanese Yen/US Dollar |
Short/Long |
6.1 |
UK Sterling/US Dollar |
Long/Short |
5.6 |
Crude Oil |
Long |
5.6 |
Euro-STOXX |
Long |
5.4 |
Euro-BUND |
Short |
5.1 | |
|
| Material Fund Change [Text Block] |
|
|
| C000247981 |
|
|
| Shareholder Report [Line Items] |
|
|
| Fund Name |
GLG Natural Resources ETF
|
|
| Trading Symbol |
MGNR
|
|
| Security Exchange Name |
NYSE
|
|
| Annual or Semi-Annual Statement [Text Block] |
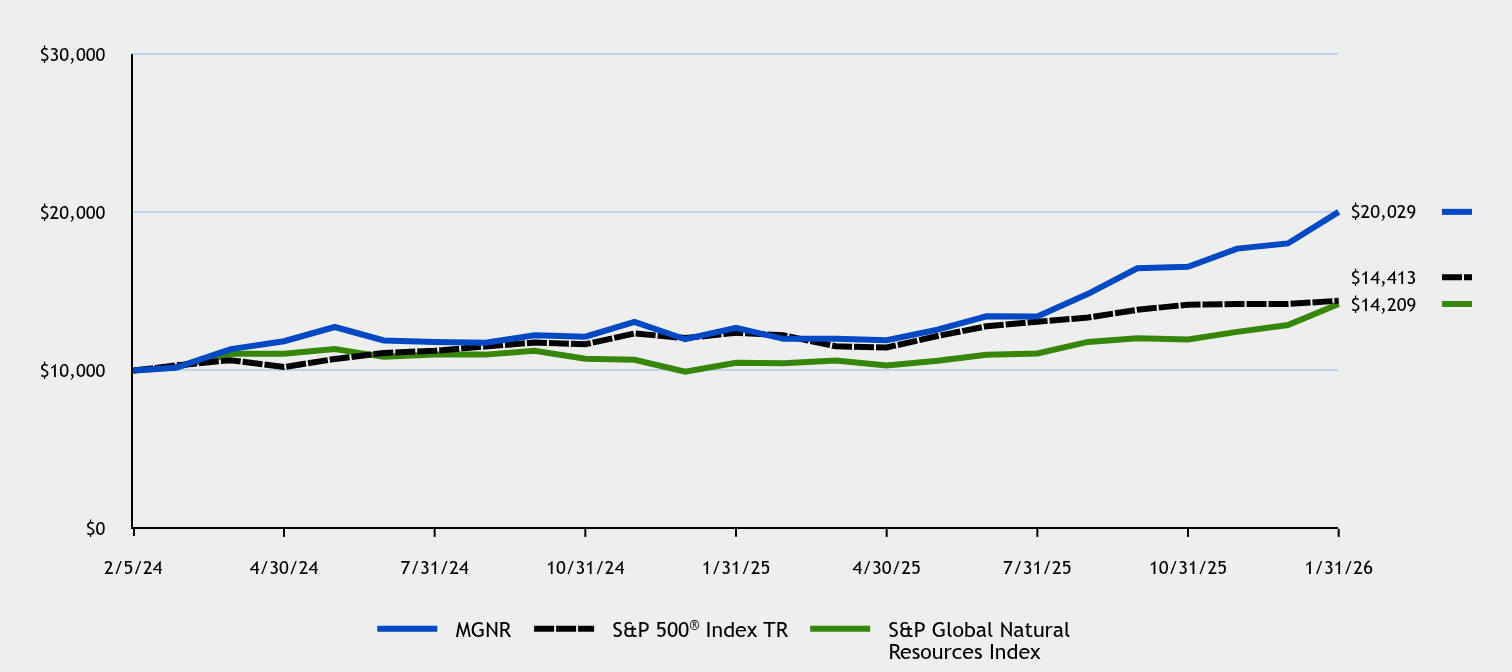
This annual shareholder report contains important information about American Beacon GLG Natural Resources ETF for the period of February 1, 2025 to January 31, 2026.
|
|
| Additional Information [Text Block] |
You can find additional information about the Fund at www.americanbeaconfunds.com/fund-resources/. You can request this information by contacting us at 833-471-3562.
|
|
| Additional Information Phone Number |
833-471-3562
|
|
| Additional Information Website |
www.americanbeaconfunds.com/fund-resources/
|
|
| Expenses [Text Block] |
What were the Fund costs for the last year?(based on a hypothetical $10,000 investment)
Table Summary
Fund Name |
Costs of a $10,000 investment |
Costs paid as a percentage of a $10,000 investment |
GLG Natural Resources ETF |
$97 |
0.75% | |
|
| Expenses Paid, Amount |
$ 97
|
|
| Expense Ratio, Percent |
0.75%
|
|
| Factors Affecting Performance [Text Block] |
How did the Fund perform and what affected its performance? The ETF returned 58.13% for the period ended January 31, 2026, compared to the S&P 500® Index TR return of 16.35% and S&P Global Natural Resources Index return of 35.50%. • The market had positive returns over the period, largely driven by precious and base metals, as geopolitical concerns pushed investors to search for safety. • The Fund benefitted the most from security selection in the Metals & Mining industry and the Electrical Equipment industry. |
|
| Performance Past Does Not Indicate Future [Text] |
Performance shown is historical and is not indicative of future returns.
|
|
| Line Graph [Table Text Block] |
Table Summary
|
MGNR |
S&P 500® Index TR |
S&P Global Natural Resources Index |
2/5/24 |
$10,000 |
$10,000 |
$10,000 |
2/29/24 |
$10,184 |
$10,326 |
$10,213 |
3/31/24 |
$11,356 |
$10,658 |
$11,063 |
4/30/24 |
$11,855 |
$10,223 |
$11,058 |
5/31/24 |
$12,754 |
$10,730 |
$11,364 |
6/30/24 |
$11,903 |
$11,115 |
$10,867 |
7/31/24 |
$11,808 |
$11,250 |
$11,018 |
8/31/24 |
$11,764 |
$11,523 |
$11,008 |
9/30/24 |
$12,226 |
$11,769 |
$11,254 |
10/31/24 |
$12,144 |
$11,662 |
$10,752 |
11/30/24 |
$13,082 |
$12,347 |
$10,679 |
12/31/24 |
$11,979 |
$12,052 |
$9,930 |
1/31/25 |
$12,708 |
$12,388 |
$10,487 |
2/28/25 |
$12,007 |
$12,226 |
$10,470 |
3/31/25 |
$12,007 |
$11,537 |
$10,637 |
4/30/25 |
$11,922 |
$11,459 |
$10,314 |
5/31/25 |
$12,589 |
$12,181 |
$10,622 |
6/30/25 |
$13,425 |
$12,800 |
$11,000 |
7/31/25 |
$13,418 |
$13,087 |
$11,081 |
8/31/25 |
$14,850 |
$13,352 |
$11,811 |
9/30/25 |
$16,462 |
$13,840 |
$12,046 |
10/31/25 |
$16,556 |
$14,164 |
$11,964 |
11/30/25 |
$17,705 |
$14,199 |
$12,445 |
12/31/25 |
$18,033 |
$14,207 |
$12,876 |
1/31/26 |
$20,029 |
$14,413 |
$14,209 |
|
|
| Average Annual Return [Table Text Block] |
Table Summary
Average Annual Total Returns (%) |
1 Year |
Since Inception (2/5/24) |
MGNRFootnote Reference1 |
58.13% |
41.83% |
S&P 500® Index TR |
16.35% |
19.95% |
S&P Global Natural Resources Index |
35.50% |
18.32% | |
|
| Performance Inception Date |
Feb. 05, 2024
|
|
| No Deduction of Taxes [Text Block] |
The graph and table do not reflect the deduction of taxes that a shareholder would pay on fund distributions or redemption of fund shares.
|
|
| AssetsNet |
$ 487,536,841
|
|
| Holdings Count | Holding |
51
|
|
| Advisory Fees Paid, Amount |
$ 1,653,014
|
|
| InvestmentCompanyPortfolioTurnover |
80.00%
|
|
| Additional Fund Statistics [Text Block] |
Table Summary
Total Net Assets |
$487,536,841 |
# of Portfolio Holdings |
51 |
Portfolio Turnover Rate |
80% |
Total Management Fees Paid |
$1,653,014 | |
|
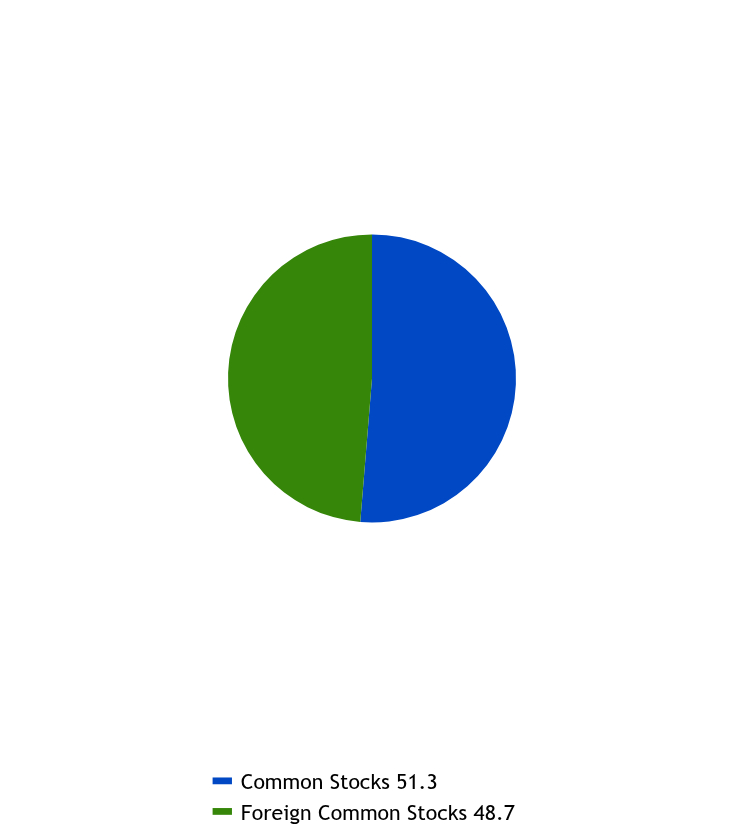
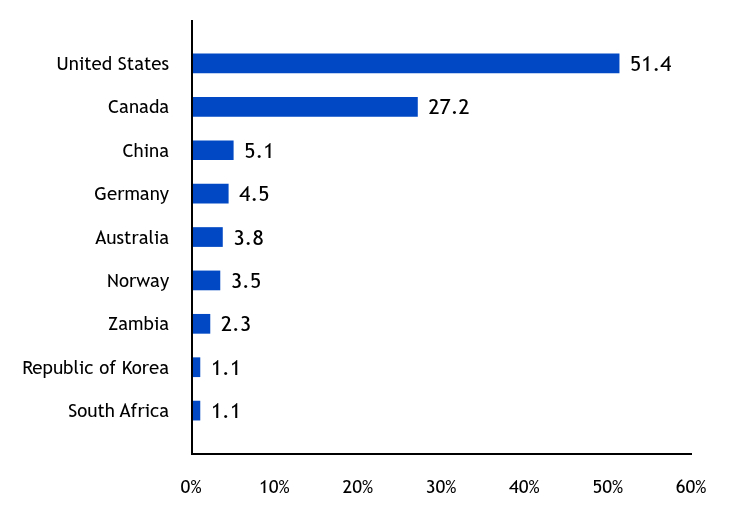
| Holdings [Text Block] |
Asset Allocation - % Investments
Table Summary
Value |
Value |
Common Stocks |
51.3 |
Foreign Common Stocks |
48.7 | Country Exposure - % Equities
Table Summary
Value |
Value |
South Africa |
1.1 |
Republic of Korea |
1.1 |
Zambia |
2.3 |
Norway |
3.5 |
Australia |
3.8 |
Germany |
4.5 |
China |
5.1 |
Canada |
27.2 |
United States |
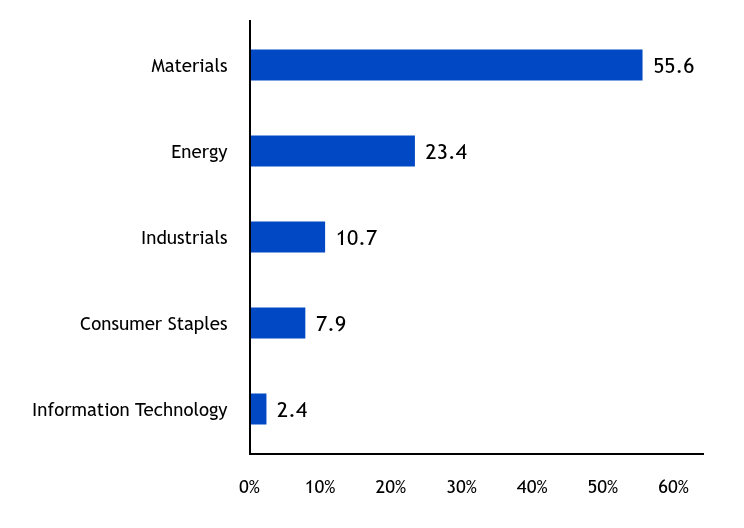
51.4 | Sector Allocation - % Equities
Table Summary
Value |
Value |
Information Technology |
2.4 |
Consumer Staples |
7.9 |
Industrials |
10.7 |
Energy |
23.4 |
Materials |
55.6 | |
|
| Largest Holdings [Text Block] |
Top Ten Holdings - % Net Assets
Table Summary
Hudbay Minerals, Inc. |
4.3 |
Teck Resources Ltd., Class B |
4.2 |
Equinox Gold Corp. |
3.8 |
Kinross Gold Corp. |
3.8 |
Anglogold Ashanti PLC |
3.7 |
Range Resources Corp. |
3.5 |
Bunge Global SA |
3.1 |
ArcelorMittal SA |
3.0 |
Antero Resources Corp. |
3.0 |
Methanex Corp. |
2.9 | |
|
| Material Fund Change [Text Block] |
|
|
| C000257150 |
|
|
| Shareholder Report [Line Items] |
|
|
| Fund Name |
Ionic Inflation Protection ETF
|
|
| Trading Symbol |
CPII
|
|
| Security Exchange Name |
NYSE
|
|
| Annual or Semi-Annual Statement [Text Block] |
This annual shareholder report contains important information about American Beacon Ionic Inflation Protection ETF for the period of May 1, 2025 to January 31, 2026.
|
|
| Additional Information [Text Block] |
You can find additional information about the Fund at www.americanbeaconfunds.com/fund-resources/. You can request this information by contacting us at 833-471-3562.
|
|
| Additional Information Phone Number |
833-471-3562
|
|
| Additional Information Website |
www.americanbeaconfunds.com/fund-resources/
|
|
| Expenses [Text Block] |
What were the Fund costs for the last year?(based on a hypothetical $10,000 investment)
Table Summary
Fund Name |
Costs of a $10,000 investment |
Costs paid as a percentage of a $10,000 investment |
Ionic Inflation Protection ETF |
$53 |
0.70%Footnote Reference* |
| Footnote |
Description |
Footnote* |
Annualized. | |
|
| Expenses Paid, Amount |
$ 53
|
|
| Expense Ratio, Percent |
0.70%
|
[1] |
| Factors Affecting Performance [Text Block] |
How did the Fund perform and what affected its performance? The ETF returned 1.96% for the twelve months ended January 31, 2026, compared to the Bloomberg US Aggregate Bond Index return of 6.85%. • The U.S. bond market performed well as yields remained high with only slight cuts to the Federal Funds Rate towards the end of the year. • The Fund seeks capital appreciation in elevated and rising inflationary environments. Inflation slightly cooled throughout the year, which led to the Fund’s modest performance. |
|
| Performance Past Does Not Indicate Future [Text] |
Performance shown is historical and is not indicative of future returns.
|
|
| Line Graph [Table Text Block] |
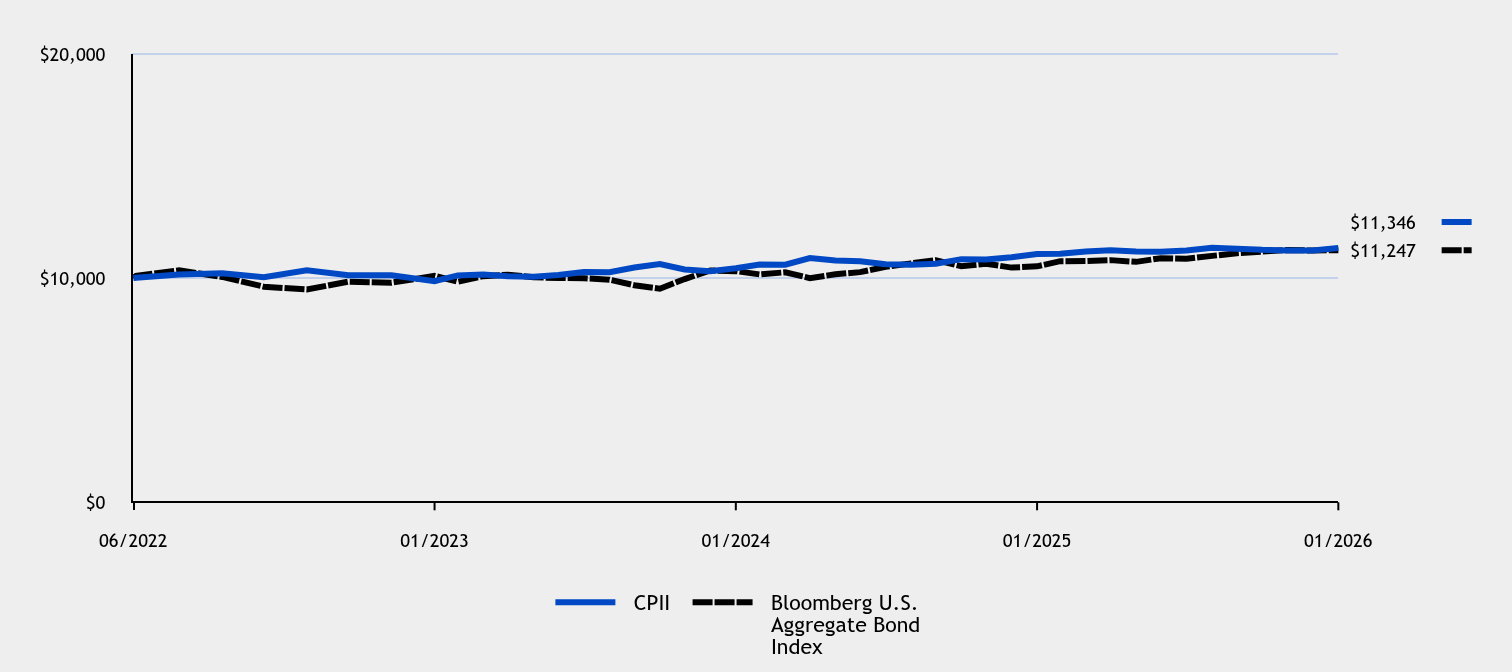
Table Summary
|
CPII |
Bloomberg U.S. Aggregate Bond Index |
06/2022 |
$10,000 |
$10,000 |
06/2022 |
$10,018 |
$10,100 |
07/2022 |
$10,168 |
$10,346 |
08/2022 |
$10,216 |
$10,054 |
09/2022 |
$10,038 |
$9,620 |
10/2022 |
$10,350 |
$9,495 |
11/2022 |
$10,125 |
$9,844 |
12/2022 |
$10,129 |
$9,800 |
01/2023 |
$9,867 |
$10,101 |
02/2023 |
$10,122 |
$9,840 |
03/2023 |
$10,158 |
$10,090 |
04/2023 |
$10,089 |
$10,151 |
05/2023 |
$10,068 |
$10,041 |
06/2023 |
$10,144 |
$10,005 |
07/2023 |
$10,275 |
$9,998 |
08/2023 |
$10,262 |
$9,934 |
09/2023 |
$10,474 |
$9,682 |
10/2023 |
$10,629 |
$9,529 |
11/2023 |
$10,387 |
$9,960 |
12/2023 |
$10,312 |
$10,342 |
01/2024 |
$10,438 |
$10,313 |
02/2024 |
$10,607 |
$10,167 |
03/2024 |
$10,600 |
$10,261 |
04/2024 |
$10,899 |
$10,002 |
05/2024 |
$10,791 |
$10,172 |
06/2024 |
$10,758 |
$10,268 |
07/2024 |
$10,622 |
$10,508 |
08/2024 |
$10,600 |
$10,659 |
09/2024 |
$10,647 |
$10,802 |
10/2024 |
$10,848 |
$10,534 |
11/2024 |
$10,831 |
$10,645 |
12/2024 |
$10,937 |
$10,471 |
01/2025 |
$11,074 |
$10,526 |
02/2025 |
$11,086 |
$10,758 |
03/2025 |
$11,191 |
$10,762 |
04/2025 |
$11,246 |
$10,804 |
05/2025 |
$11,187 |
$10,727 |
06/2025 |
$11,174 |
$10,892 |
07/2025 |
$11,231 |
$10,863 |
08/2025 |
$11,353 |
$10,993 |
09/2025 |
$11,317 |
$11,113 |
10/2025 |
$11,263 |
$11,183 |
11/2025 |
$11,239 |
$11,252 |
12/2025 |
$11,239 |
$11,235 |
01/2026 |
$11,346 |
$11,247 |
|
|
| Average Annual Return [Table Text Block] |
Table Summary
Average Annual Total Returns (%) |
1 Year |
Since Inception (6/28/22) |
CPIIFootnote Reference1 |
1.96%Footnote Reference2 |
3.47% |
Bloomberg U.S. Aggregate Bond Index |
6.85% |
3.33% | |
|
| Performance Inception Date |
Jun. 28, 2022
|
|
| No Deduction of Taxes [Text Block] |
The graph and table do not reflect the deduction of taxes that a shareholder would pay on fund distributions or redemption of fund shares.
|
|
| AssetsNet |
$ 10,451,164
|
|
| Holdings Count | Holding |
9
|
|
| Advisory Fees Paid, Amount |
$ 55,129
|
|
| InvestmentCompanyPortfolioTurnover |
17.00%
|
|
| Additional Fund Statistics [Text Block] |
Table Summary
Total Net Assets |
$10,451,164 |
# of Portfolio Holdings |
9 |
Portfolio Turnover Rate |
17% |
Total Management Fees Paid |
$55,129 | |
|
| Holdings [Text Block] |
Asset Allocation - % Investments
Table Summary
U.S. Treasury Obligations |
98.3 |
Investment Companies |
1.3 |
Inflation Swap |
0.3 |
Interest Rate Swaptions |
0.1 | |
|
| Largest Holdings [Text Block] |
Top Ten Holdings - % Net Assets
Table Summary
U.S. Treasury Inflation-Indexed Notes, 0.375%, Due 7/15/2027 |
13.2 |
U.S. Treasury Inflation-Indexed Notes, 0.125%, Due 4/15/2027 |
13.1 |
U.S. Treasury Inflation-Indexed Notes, 0.125%, Due 4/15/2026 |
12.6 |
U.S. Treasury Inflation-Indexed Notes, 0.125%, Due 7/15/2026 |
12.5 |
U.S. Treasury Inflation-Indexed Notes, 0.125%, Due 10/15/2026 |
12.5 |
U.S. Treasury Inflation-Indexed Notes, 1.625%, Due 10/15/2027 |
12.4 |
U.S. Treasury Inflation-Indexed Notes, 0.375%, Due 1/15/2027 |
11.5 |
U.S. Treasury Inflation-Indexed Notes, 0.500%, Due 1/15/2028 |
10.0 |
Swap, 2.415%, Due 1/16/2031 |
0.3 |
2-Year Interest Rate Swap, 5.220%, Due 1/13/2027 |
0.1 | Excludes cash equivalents. |
|
| Material Fund Change [Text Block] |
|
|
|
|