Exhibit 99.2

7. ASR Nederland N.V. Financial statements ‘Financial health and cost-efficiency are more than metrics;
they form the foundation for growth and responsible entrepreneurship, ensuring long-term value creation.’ Paul van Ammelrooij, Director Group Finance 7.1 Introduction 2 7.2 Consolidated financial statements 3 7.3 Accounting policies 9 7.4
Group structure and segment information 32 7.5 Notes to the consolidated balance sheet 43 7.6 Notes to the consolidated income statement 88 7.7 Other notes 95 7.8 Risk management 112 7.9 Capital management 145 7.10 Operating result 149 7.11 Company
financial statements 152
Annual Report 2025 ASR Nederland N.V. 2 7.1 Introduction 7.1.1 General information ASR Nederland N.V. (a.s.r.
or ‘the Group’) is one of the largest insurers in the Netherlands. a.s.r. helps its customers share risks and build up capital for the future. a.s.r. does this with services and products that are good for ‘Nu, later en
altijd’, in the fields of insurance, pensions, and mortgages for customers, businesses and employers. a.s.r. is also active as an asset manager for third parties. In 2025, a.s.r. sold insurance products under the following labels: a.s.r.,
Aegon, and Loyalis. a.s.r. is listed on Euronext Amsterdam and is included in the AEX index. a.s.r. has a total of 8,689 internal FTE’s (2024: 7,373). a.s.r. is a public limited company under Dutch law having its registered office located at
Archimedeslaan 10, 3584 BA in Utrecht, the Netherlands. Country of incorporation is the Netherlands. a.s.r. has chosen the Netherlands as ‘country of origin’ (land van herkomst) for the issued share capital and some corporate bonds which
are listed on Euronext Amsterdam and Euronext Dublin (Ticker: ASRNL). a.s.r. is registered under number 30070695 in the register of the Chamber of Commerce. The consolidated financial statements are presented in millions of euros (€), being the
functional currency of a.s.r. and all its group entities. All amounts quoted in these financial statements are in euros and rounded to the nearest million, unless otherwise indicated. Calculations are made using unrounded figures. As a result
rounding differences can occur. These statements have been prepared on a going concern basis. The financial statements for 2025 were authorised for issue by the Executive Board (EB) and approved by the Supervisory Board (SB) on 24 March 2026. The
financial statements 2025 will be presented to the Annual General Meeting (AGM) of Shareholders for adoption on 20 May 2026. 7.1.2 Statement of compliance The consolidated financial statements of a.s.r. have been prepared in accordance with
International Financial Reporting Standards Accounting Standards (IFRS) – including the International Accounting Standards (IAS) and Interpretations – as adopted by the EU (EU-IFRS), and with the
financial reporting requirements included in Title 9, Book 2 of the Dutch Civil Code, where applicable. a.s.r.’s interpretation of EU-IFRS is included in the a.s.r. accounting manual. The accounting
policies included in section 7.3 are a summary of the relevant accounting policies of the a.s.r. accounting manual. EU-IFRS differs from International Financial Reporting Standards Accounting Standards as
issued by the International Accounting Standards Board (IFRS). Under EU-IFRS, a.s.r. applies fair value hedge accounting for portfolio hedges of interest rate risk (macro hedging) under the EU ‘carve
out’ of IFRS. This is the only difference between EU-IFRS as applied by a.s.r. and IFRS. Pursuant to the options offered by Section 362, Book 2 of the Dutch Civil Code, a.s.r. has prepared its
company financial statements in accordance with the same principles as those used for the consolidated financial statements. Financial statements Introduction Consolidated financial statements Accounting policies Group structure and segment
information Notes to the consolidated balance sheet Notes to the consolidated income statement Other notes Risk management Capital management Operating result Company financial statements
Annual Report 2025 ASR Nederland N.V. 3 7.2 Consolidated financial statements 7.2.1 Consolidated balance sheet
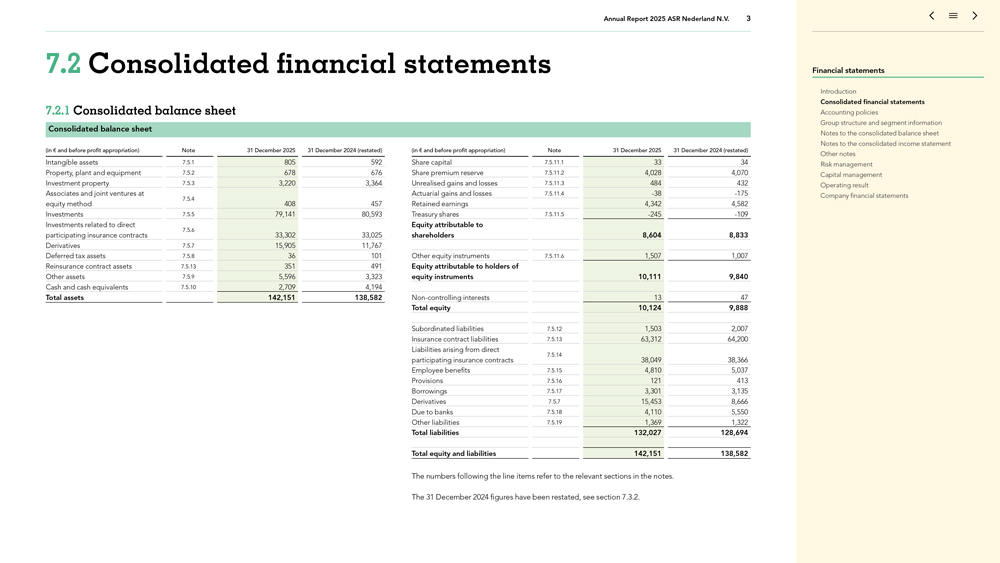
Consolidated balance sheet (in € and before profit appropriation) Note 31 December 2025 31 December 2024 (restated) Intangible assets 7.5.1 805 592 Property, plant and equipment 7.5.2 678 676 Investment property 7.5.3 3,220 3,364
Associates and joint ventures at 7.5.4 equity method 408 457 Investments 7.5.5 79,141 80,593 Investments related to direct 7.5.6 participating insurance contracts 33,302 33,025 Derivatives 7.5.7 15,905 11,767 Deferred tax assets 7.5.8 36 101
Reinsurance contract assets 7.5.13 351 491 Other assets 7.5.9 5,596 3,323 Cash and cash equivalents 7.5.10 2,709 4,194 Total assets 142,151 138,582 (in € and before profit appropriation) Note 31 December 2025 31 December 2024 (restated)
Share capital 7.5.11.1 33 34 Share premium reserve 7.5.11.2 4,028 4,070 Unrealised gains and losses 7.5.11.3 484 432 Actuarial gains and losses 7.5.11.4 -38 -175 Retained earnings 4,342 4,582 Treasury shares 7.5.11.5 -245 -109 Equity attributable to
shareholders 8,604 8,833 Other equity instruments 7.5.11.6 1,507 1,007 Equity attributable to holders of equity instruments 10,111 9,840 Non-controlling interests 13 47 Total equity 10,124 9,888 Subordinated
liabilities 7.5.12 1,503 2,007 Insurance contract liabilities 7.5.13 63,312 64,200 Liabilities arising from direct 7.5.14 participating insurance contracts 38,049 38,366 Employee benefits 7.5.15 4,810 5,037 Provisions 7.5.16 121 413 Borrowings
7.5.17 3,301 3,135 Derivatives 7.5.7 15,453 8,666 Due to banks 7.5.18 4,110 5,550 Other liabilities 7.5.19 1,369 1,322 Total liabilities 132,027 128,694 Total equity and liabilities 142,151 138,582 The numbers following the line items refer to the
relevant sections in the notes. The 31 December 2024 figures have been restated, see section 7.3.2. Financial statements Introduction Consolidated financial statements Accounting policies Group structure and segment information Notes to the
consolidated balance sheet Notes to the consolidated income statement Other notes Risk management Capital management Operating result Company financial statements
7.2 Consolidated financial statements Annual Report 2025 ASR Nederland N.V. 4 7.2.2 Consolidated income
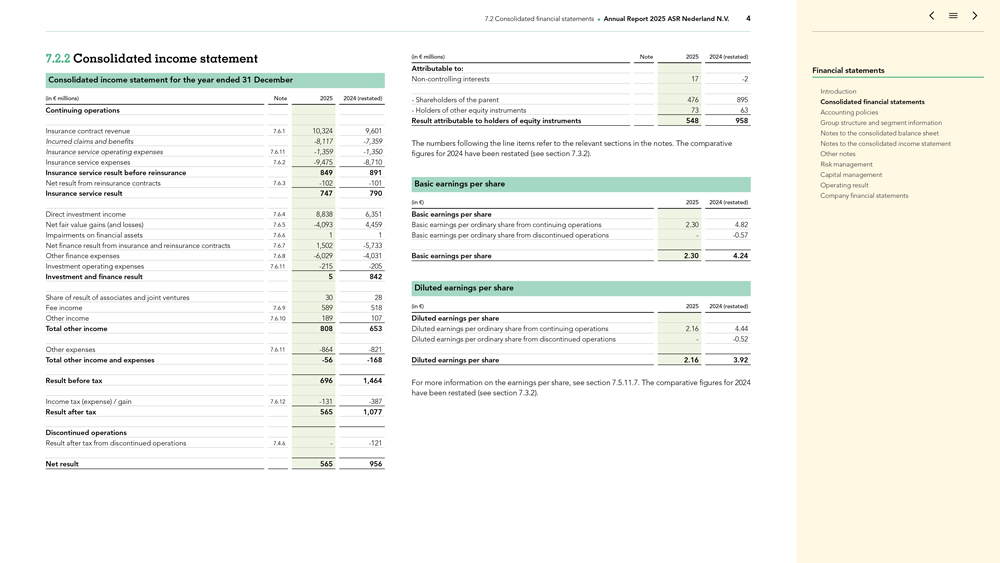
statement Consolidated income statement for the year ended 31 December (in € millions) Note 2025 2024 (restated) Continuing operations Insurance contract revenue 7.6.1 10,324 9,601 Incurred claims and benefits -8,117 -7,359 Insurance
service operating expenses 7.6.11 -1,359 -1,350 Insurance service expenses 7.6.2 -9,475 -8,710 Insurance service result before reinsurance 849 891 Net result from reinsurance contracts 7.6.3 -102 -101 Insurance service result 747 790 Direct
investment income 7.6.4 8,838 6,351 Net fair value gains (and losses) 7.6.5 -4,093 4,459 Impairments on financial assets 7.6.6 1 1 Net finance result from insurance and reinsurance contracts 7.6.7 1,502 -5,733 Other finance expenses 7.6.8 -6,029
-4,031 Investment operating expenses 7.6.11 -215 -205 Investment and finance result 5 842 Share of result of associates and joint ventures 30 28 Fee income 7.6.9 589 518 Other income 7.6.10 189 107 Total other income 808 653 Other expenses 7.6.11
-864 -821 Total other income and expenses -56 -168 Result before tax 696 1,464 Income tax (expense) / gain 7.6.12 -131 -387 Result after tax 565 1,077 Discontinued operations Result after tax from discontinued operations 7.4.6 - -121 Net result 565
956 (in € millions) Note 2025 2024 (restated) Attributable to: Non-controlling interests 17 -2 - Shareholders of the parent 476 895 - Holders of other equity instruments 73 63 Result attributable to
holders of equity instruments 548 958 The numbers following the line items refer to the relevant sections in the notes. The comparative figures for 2024 have been restated (see section 7.3.2) . Basic earnings per share (in €) 2025 2024
(restated) Basic earnings per share Basic earnings per ordinary share from continuing operations 2.30 4.82 Basic earnings per ordinary share from discontinued operations - -0.57 Basic earnings per share 2.30 4.24 Diluted earnings per share (in
€) 2025 2024 (restated) Diluted earnings per share Diluted earnings per ordinary share from continuing operations 2.16 4.44 Diluted earnings per ordinary share from discontinued operations - -0.52 Diluted earnings per share 2.16 3.92 For more
information on the earnings per share, see section 7.5.11.7. The comparative figures for 2024 have been restated (see section 7.3.2) . Financial statements Introduction Consolidated financial statements Accounting policies Group structure and
segment information Notes to the consolidated balance sheet Notes to the consolidated income statement Other notes Risk management Capital management Operating result Company financial statements
7.2 Consolidated financial statements Annual Report 2025 ASR Nederland N.V. 5 7.2.3 Consolidated statement of
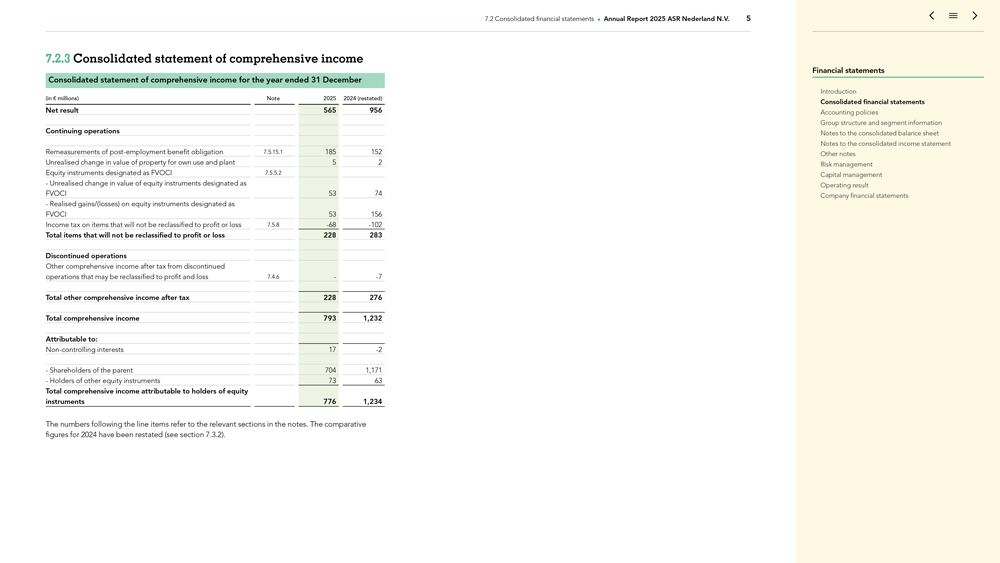
comprehensive income Consolidated statement of comprehensive income for the year ended 31 December (in € millions) Note 2025 2024 (restated) Net result 565 956 Continuing operations Remeasurements of post-employment benefit obligation
7.5.15.1 185 152 Unrealised change in value of property for own use and plant 5 2 Equity instruments designated as FVOCI 7.5.5.2 - Unrealised change in value of equity instruments designated as FVOCI 53 74 - Realised gains/(losses) on equity
instruments designated as FVOCI 53 156 Income tax on items that will not be reclassified to profit or loss 7.5.8 -68 -102 Total items that will not be reclassified to profit or loss 228 283 Discontinued operations Other comprehensive income after
tax from discontinued operations that may be reclassified to profit and loss 7.4.6 - -7 Total other comprehensive income after tax 228 276 Total comprehensive income 793 1,232 Attributable to: Non-controlling
interests 17 -2 - Shareholders of the parent 704 1,171 - Holders of other equity instruments 73 63 Total comprehensive income attributable to holders of equity instruments 776 1,234 The numbers following the line items refer to the relevant sections
in the notes. The comparative figures for 2024 have been restated (see section 7.3.2) . Financial statements Introduction Consolidated financial statements Accounting policies Group structure and segment information Notes to the consolidated balance
sheet Notes to the consolidated income statement Other notes Risk management Capital management Operating result Company financial statements
7.2 Consolidated financial statements Annual Report 2025 ASR Nederland N.V. 6 7.2.4 Consolidated statement of
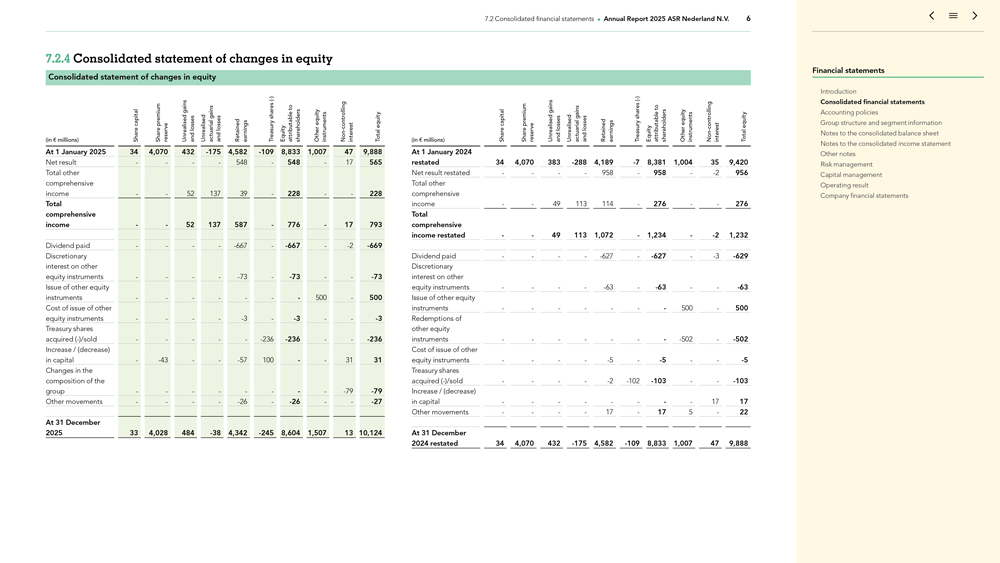
changes in equity Consolidated statement of changes in equity (-) controlling premium gains to gains shares capital equity actuarial earnings losses losses Treasuryequity (in € millions) Share Share reserve Unrealised and Unrealised and
Retained Equity attributable shareholders Other instruments Non- interest Total At 1 January 2025 34 4,070 432 -175 4,582 -109 8,833 1,007 47 9,888 Net result - - - - 548 - 548 - 17 565 Total other comprehensive income - - 52 137 39 - 228 - - 228
Total comprehensive income - - 52 137 587 - 776 - 17 793 Dividend paid - - - - -667 - -667 - -2 -669 Discretionary interest on other equity instruments - - - - -73 - -73 - - -73 Issue of other equity instruments - - - - - - - 500 - 500 Cost of issue
of other equity instruments - - - - -3 - -3 - - -3 Treasury shares acquired (-)/sold - - - - - -236 -236 - - -236 Increase / (decrease) in capital - -43 - - -57 100 - - 31 31 Changes in the composition of the group - - - - - - - - -79 -79 Other
movements - - - - -26 - -26 - - -27 At 31 December 2025 33 4,028 484 -38 4,342 -245 8,604 1,507 13 10,124 (-) controlling premium gains to gains shares capital equity actuarial earnings losses losses Treasuryequity (in € millions) Share
Share reserve Unrealised and Unrealised and Retained Equity attributable shareholders Other instruments Non- interest Total At 1 January 2024 restated 34 4,070 383 -288 4,189 -7 8,381 1,004 35 9,420 Net result restated - - - - 958 - 958 - -2 956
Total other comprehensive income - - 49 113 114 - 276 - - 276 Total comprehensive income restated - - 49 113 1,072 - 1,234 - -2 1,232 Dividend paid - - - - -627 - -627 - -3 -629 Discretionary interest on other equity instruments - - - - -63 - -63 -
- -63 Issue of other equity instruments - - - - - - - 500 - 500 Redemptions of other equity instruments - - - - - - - -502 - -502 Cost of issue of other equity instruments - - - - -5 - -5 - - -5 Treasury shares acquired (-)/sold - - - - -2 -102 -103
- - -103 Increase / (decrease) in capital - - - - - - - - 17 17 Other movements - - - - 17 - 17 5 - 22 At 31 December 2024 restated 34 4,070 432 -175 4,582 -109 8,833 1,007 47 9,888 Financial statements Introduction Consolidated financial statements
Accounting policies Group structure and segment information Notes to the consolidated balance sheet Notes to the consolidated income statement Other notes Risk management Capital management Operating result Company financial statements
7.2 Consolidated financial statements Annual Report 2025 ASR Nederland N.V. 7 The comparative figures for 2024
have been restated (see section 7.3.2) . For more information on the share premium reserve, see section 7.5.11.2. For more information on the actuarial gains and losses related to the pension obligation, see section 7.5.11.4. For more information on
treasury shares acquired and sold, see section 7.5.11.5. For more information on the issue and redemption of other equity instruments in 2025, see section 7.5.11.6. In 2025, changes in composition of the group of
Non-controlling interests relate to the deconsolidation of ASR Dutch Science Park Fund (ASR DSPF). As per April 2025 a.s.r. lost control of ASR DSPF, see sections 7.5.3 and 7.5.4. Financial statements
Introduction Consolidated financial statements Accounting policies Group structure and segment information Notes to the consolidated balance sheet Notes to the consolidated income statement Other notes Risk management Capital management Operating
result Company financial statements
7.2 Consolidated financial statements Annual Report 2025 ASR Nederland N.V. 8 7.2.5 Consolidated statement of
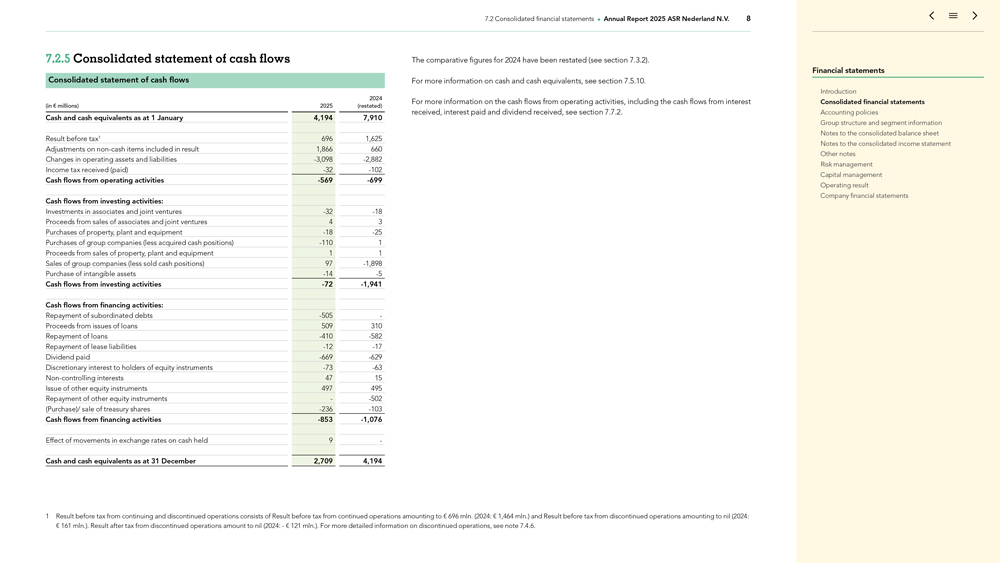
cash flows Consolidated statement of cash flows 2024 (in € millions) 2025 (restated) Cash and cash equivalents as at 1 January 4,194 7,910 Result before tax1 696 1,625 Adjustments on non-cash items
included in result 1,866 660 Changes in operating assets and liabilities -3,098 -2,882 Income tax received (paid) -32 -102 Cash flows from operating activities -569 -699 Cash flows from investing activities: Investments in associates and joint
ventures -32 -18 Proceeds from sales of associates and joint ventures 4 3 Purchases of property, plant and equipment -18 -25 Purchases of group companies (less acquired cash positions) -110 1 Proceeds from sales of property, plant and equipment 1 1
Sales of group companies (less sold cash positions) 97 -1,898 Purchase of intangible assets -14 -5 Cash flows from investing activities -72 -1,941 Cash flows from financing activities: Repayment of subordinated debts -505 -Proceeds from issues of
loans 509 310 Repayment of loans -410 -582 Repayment of lease liabilities -12 -17 Dividend paid -669 -629 Discretionary interest to holders of equity instruments -73 -63 Non-controlling interests 47 15 Issue
of other equity instruments 497 495 Repayment of other equity instruments - -502 (Purchase)/ sale of treasury shares -236 -103 Cash flows from financing activities -853 -1,076 Effect of movements in exchange rates on cash held 9 - Cash and cash
equivalents as at 31 December 2,709 4,194 The comparative figures for 2024 have been restated (see section 7.3.2) . For more information on cash and cash equivalents, see section 7.5.10. For more information on the cash flows from operating
activities, including the cash flows from interest received, interest paid and dividend received, see section 7.7.2. 1 Result before tax from continuing and discontinued operations consists of Result before tax from continued operations amounting to
€ 696 mln. (2024: € 1,464 mln.) and Result before tax from discontinued operations amounting to nil (2024: € 161 mln.). Result after tax from discontinued operations amount to nil (2024: - € 121 mln.). For
more detailed information on discontinued operations, see note 7.4.6. Financial statements Introduction Consolidated financial statements Accounting policies Group structure and segment information Notes to the consolidated balance sheet Notes to
the consolidated income statement Other notes Risk management Capital management Operating result Company financial statements
Annual Report 2025 ASR Nederland N.V. 9 7.3 Accounting policies 7.3.1 and Changes Interpretations in EU
effective endorsed in published 2025 IFRS Standards In 2025, no changes in EU endorsed published IFRS Standards and Interpretations are relevant to a.s.r. 7.3.2 Changes in accounting policies and presentations 7.3.2.1 Changes in accounting policies
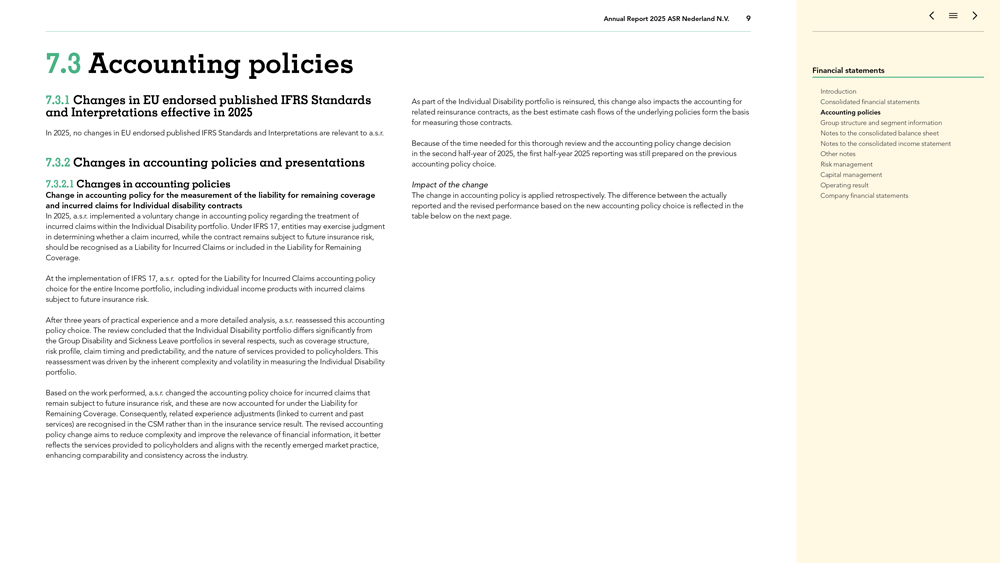
Change in accounting policy for the measurement of the liability for remaining coverage and incurred claims for Individual disability contracts In 2025, a.s.r. implemented a voluntary change in accounting policy regarding the treatment of incurred
claims within the Individual Disability portfolio. Under IFRS 17, entities may exercise judgment in determining whether a claim incurred, while the contract remains subject to future insurance risk, should be recognised as a Liability for Incurred
Claims or included in the Liability for Remaining Coverage. At the implementation of IFRS 17, a.s.r. opted for the Liability for Incurred Claims accounting policy choice for the entire Income portfolio, including individual income products with
incurred claims subject to future insurance risk. After three years of practical experience and a more detailed analysis, a.s.r. reassessed this accounting policy choice. The review concluded that the Individual Disability portfolio differs
significantly from the Group Disability and Sickness Leave portfolios in several respects, such as coverage structure, risk profile, claim timing and predictability, and the nature of services provided to policyholders. This reassessment was driven
by the inherent complexity and volatility in measuring the Individual Disability portfolio. Based on the work performed, a.s.r. changed the accounting policy choice for incurred claims that remain subject to future insurance risk, and these are now
accounted for under the Liability for Remaining Coverage. Consequently, related experience adjustments (linked to current and past services) are recognised in the CSM rather than in the insurance service result. The revised accounting policy change
aims to reduce complexity and improve the relevance of financial information, it better reflects the services provided to policyholders and aligns with the recently emerged market practice, enhancing comparability and consistency across the
industry. As part of the Individual Disability portfolio is reinsured, this change also impacts the accounting for related reinsurance contracts, as the best estimate cash flows of the underlying policies form the basis for measuring those
contracts. Because of the time needed for this thorough review and the accounting policy change decision in the second half-year of 2025, the first half-year 2025 reporting was still prepared on the previous accounting policy choice. Impact of the
change The change in accounting policy is applied retrospectively. The difference between the actually reported and the revised performance based on the new accounting policy choice is reflected in the table below on the next page. Financial
statements Introduction Consolidated financial statements Accounting policies Group structure and segment information Notes to the consolidated balance sheet Notes to the consolidated income statement Other notes Risk management Capital management
Operating result Company financial statements
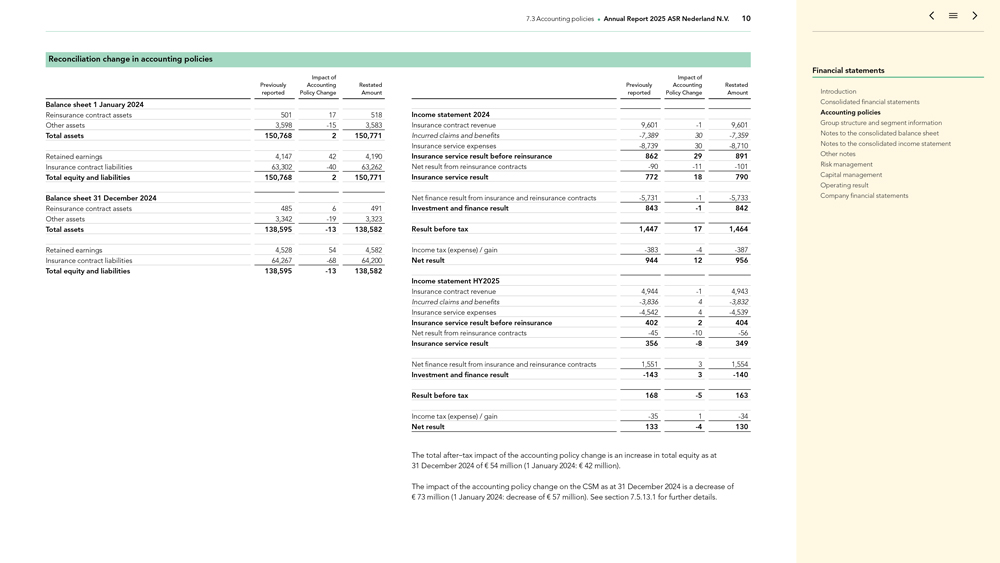
7.3 Accounting policies Annual Report 2025 ASR Nederland N.V. 10 Reconciliation change in accounting policies
Impact of Previously Accounting Restated reported Policy Change Amount Balance sheet 1 January 2024 Reinsurance contract assets 501 17 518 Other assets 3,598 -15 3,583 Total assets 150,768 2 150,771 Retained earnings 4,147 42 4,190 Insurance
contract liabilities 63,302 -40 63,262 Total equity and liabilities 150,768 2 150,771 Balance sheet 31 December 2024 Reinsurance contract assets 485 6 491 Other assets 3,342 -19 3,323 Total assets 138,595 -13 138,582 Retained earnings 4,528 54 4,582
Insurance contract liabilities 64,267 -68 64,200 Total equity and liabilities 138,595 -13 138,582 Impact of Previously Accounting Restated reported Policy Change Amount Income statement 2024 Insurance contract revenue 9,601 -1 9,601 Incurred claims
and benefits -7,389 30 -7,359 Insurance service expenses -8,739 30 -8,710 Insurance service result before reinsurance 862 29 891 Net result from reinsurance contracts -90 -11 -101 Insurance service result 772 18 790 Net finance result from insurance
and reinsurance contracts -5,731 -1 -5,733 Investment and finance result 843 -1 842 Result before tax 1,447 17 1,464 Income tax (expense) / gain -383 -4 -387 Net result 944 12 956 Income statement HY2025 Insurance contract revenue 4,944 -1 4,943
Incurred claims and benefits -3,836 4 -3,832 Insurance service expenses -4,542 4 -4,539 Insurance service result before reinsurance 402 2 404 Net result from reinsurance contracts -45 -10 -56 Insurance service result 356 -8 349 Net finance result
from insurance and reinsurance contracts 1,551 3 1,554 Investment and finance result -143 3 -140 Result before tax 168 -5 163 Income tax (expense) / gain -35 1 -34 Net result 133 -4 130 The total after-tax impact of the accounting policy change is
an increase in total equity as at 31 December 2024 of € 54 million (1 January 2024: € 42 million). The impact of the accounting policy change on the CSM as at 31 December 2024 is a decrease of € 73 million (1
January 2024: decrease of € 57 million). See section 7.5.13.1 for further details. Financial statements Introduction Consolidated financial statements Accounting policies Group structure and segment information Notes to the consolidated
balance sheet Notes to the consolidated income statement Other notes Risk management Capital management Operating result Company financial statements
7.3 Accounting policies Annual Report 2025 ASR Nederland N.V. 11 7.3.2.2 Changes in presentation In 2025, no
changes in presentation are made by a.s.r. 7.3.3 interpretations, Upcoming changes not yet effective in published in 2025 IFRS standards and The following new standards, amendments to existing standards and interpretations, relevant to a.s.r. and
published prior to 1 January 2026 and effective for accounting periods beginning on or after 1 January 2026, were not early adopted by a.s.r.: IFRS 18: Presentation and Disclosure in Financial Statements (2027); IFRS 18 Presentation and Disclosure
in Financial Statements IFRS 18 replaces IAS 1, carrying forward many of the requirements in IAS 1 unchanged and introduces the following key changes: present specified categories (operating, investing, financing) and defined subtotals in the income
statement; provide disclosures on management-defined performance measures (MPMs) in the notes to the financial statements; enhance criteria for aggregating and disaggregating financial statement line items; the operating profit subtotal is the
starting point for the statement of cash flows when presenting the operating cash flows under the indirect method. In 2025, a high-level impact assessment has been performed and a.s.r. has set up a project to implement IFRS 18. IFRS 18 will be
applied retrospectively from 1 January 2027. Based on current analysis, the impact on a.s.r.’s financial statements is expected to be limited to presentation and disclosure changes, with no change expected to result for the year. At this
stage, other quantitative effects cannot yet be reliably estimated. 7.3.4 Key accounting policies A. Estimates and assumptions The preparation of the financial statements requires a.s.r. to make estimates, assumptions and judgements in applying
accounting policies that have an effect on the reported amounts in the financial statements. These relate primarily to the following: The estimated useful life, residual value and fair value of property, plant and equipment, investment property, and
intangible assets (see accounting policy C, D and P); The fair value and impairments of unlisted financial instruments (see accounting policy B and E); The recoverable amount of impaired assets (see accounting policy B and E ); The fair value used
to determine the net asset value in acquisitions (see section 7.4.5); The fair value used in measuring the assets held for sale and liabilities related to the assets held for sale (see section 7.4.6); The measurement of insurance contract
liabilities and liabilities arising from direct participating insurance contracts (see section 7.5.13.4); Actuarial assumptions used for measuring employee benefit obligations (see section 7.5.15); When forming provisions, the required estimate of
existing obligations arising from past events (see section 7.5.16) . The estimates and assumptions are based on management’s best knowledge of current facts, actions and events. The actual outcomes may ultimately differ from the results
reported earlier on the basis of estimates and assumptions. A detailed explanation of the estimates and assumptions are given in the relevant notes to the consolidated financial statements. a.s.r. takes into account in the expense assumptions the
estimated synergy effects from the Aegon NL business combination for the part that can be assessed within the budget period. B. Fair value of assets and liabilities The fair value is the price that a.s.r. would receive to sell an asset or pay to
transfer a liability in an orderly transaction between market participants on the transaction date or reporting date in the principal market for the asset or liability, or in the most advantageous market for the asset or liability and assuming the
highest and best use for non-financial assets. Where possible, a.s.r. determines the fair value of assets and liabilities on the basis of quoted prices in an active market. In the absence of an active market
for a financial instrument, the fair value is determined using valuation techniques. Although valuation techniques are based on observable market data where possible, results are affected by the assumptions used, such as discount rates and estimates
of future cash flows. In the unlikely event that the fair value of a financial instrument cannot be measured, it is carried at cost. Fair value hierarchy The following three hierarchical levels are used to determine the fair value of financial
instruments and non-financial instruments when accounting for assets and liabilities at fair value and disclosing the comparative fair value of assets and liabilities: Financial statements Introduction
Consolidated financial statements Accounting policies Group structure and segment information Notes to the consolidated balance sheet Notes to the consolidated income statement Other notes Risk management Capital management Operating result Company
financial statements
7.3 Accounting policies Annual Report 2025 ASR Nederland N.V. 12 Level 1. Fair value based on quoted
prices in an active market Level 1 includes assets and liabilities whose value is determined by quoted (unadjusted) prices in the primary active market for identical assets or liabilities. A financial instrument is quoted in an active market
if: Quoted prices are readily and regularly available (from an exchange, dealer, broker, sector organisation, third-party pricing service, or a regulatory body); and These prices represent actual and regularly occurring transactions on an at
arm’s length basis. Financial instruments in this category primarily consist of bonds and equities listed in active markets. Cash and cash equivalents (excluding money market instruments), reverse repurchase agreements and cash collateral
received are also included as level 1. Level 2. Fair value based on observable market data Determining fair value on the basis of Level 2 involves the use of valuation techniques that use inputs other than quoted prices included within
Level 1 that are observable for the asset or liability, either directly (that is, as prices) or indirectly (that is derived from prices of identical or similar assets and liabilities). These observable inputs are obtained from a broker or
third-party pricing service and include: Quoted prices in active markets for similar (not identical) assets or liabilities; Quoted prices for identical or similar assets or liabilities in inactive markets; Input variables other than quoted prices
observable for the asset or liability. These include interest rates and yield curves observable at commonly quoted intervals, volatility, loss ratio, credit risks and default percentages. This category primarily includes: I. Financial instruments:
unlisted fixed-interest preference shares and interest rate contracts; II. Financial instruments: loans (excluding mortgage loans and reverse repurchase agreements); III. Other financial assets and liabilities.1 I. Financial instruments: unlisted
fixed-interest preference shares and interest rate contracts This category includes unlisted fixed-interest preference shares and interest rate contracts. The valuation techniques for financial instruments use present value calculations and in the
case of derivatives, include forward pricing and swap models. The observable market data contains yield curves based on company ratings and characteristics of the unlisted fixed-interest preference shares. II. Financial instruments: Loans (excluding
mortgage loans and reverse repurchase agreements) The fair value of the loans is based on the discounted cash flow method. It is obtained by calculating the present value based on expected future cash flows and assuming an interest rate curve used
in the market that includes an additional spread based on the risk profile of the counterparty. III. Other financial assets and liabilities For other financial assets and liabilities where the fair value is disclosed these fair values are based on
observable market inputs, primarily being the price paid to acquire the asset or received to assume the liability on initial recognition, assuming that the transactions have taken place on an at arm’s length basis. Valuation techniques using
present value calculations are applied using current interest rates where the payment terms are longer than one year. Level 3. Fair value not based on observable market data The fair value of the level 3 assets and liabilities are determined in
whole or in part using a valuation technique based on assumptions that are not supported by prices from observable current market transactions in the same instrument and for which any significant inputs are not based on available observable market
data. The financial assets and liabilities in this category are assessed individually. Valuation techniques are used to the extent that observable inputs are not available. The basic principle of fair value measurement is still to determine a fair,
at arm’s length price. Unobservable inputs therefore reflect management’s own assumptions about the assumptions that market participants would use in pricing the asset or liability (including assumptions about risk). These inputs are
generally based on the available observable data (adjusted for factors that contribute towards the value of the asset) and own source information. This category primarily includes: I. Financial instruments: private equity investments (or private
equity partners) and equity funds third parties directly investing in real estate; II. Financial instruments: mortgage loans and mortgage equity funds; III. Investment property, real estate equity funds associates, rural property contracts,
buildings for own use and plant (e.g. wind farms); IV. Financial instruments: asset-backed securities. I. Financial instruments: private equity investments and real estate equity funds third parties The main
non-observable market input for private equity investments and equity funds third parties directly investing in real estate is the net asset value of the investment as published by the private equity company
(or partner) and real estate equity funds respectively. II. Financial instruments: mortgage loans and mortgage equity funds The fair value of the mortgage loan portfolio is based on the discounted cash flow method. It is obtained by calculating the
present value based on expected future cash flows and assuming an interest rate curve used in the market that includes an additional spread based on the risk profile of the counterparty. The valuation method used to determine the fair value of the
mortgage loan portfolio derives the spread from consumer rates, adapted for a delayed response to interest rate movements, and includes assumptions for originating cost and risks. The method of determining the fair value of the mortgage equity funds
is similar to that of mortgage loans. 1 Not measured at fair value on the balance sheet and for which the fair value is disclosed. Financial statements Introduction Consolidated financial statements Accounting policies Group structure and segment
information Notes to the consolidated balance sheet Notes to the consolidated income statement Other notes Risk management Capital management Operating result Company financial statements
7.3 Accounting policies Annual Report 2025 ASR Nederland N.V. 13 III. Investment property, real estate equity
funds associates, rural property contracts, buildings for own use and plant The following categories of investment properties, buildings for own use and plant are recognised and methods of calculating fair value are distinguished: Residential
– based on reference transaction and discounted cash flow method; Retail – based on reference transaction and income capitalisation method; Rural – based on reference transaction and discounted cash flow method; Offices –
based on reference transaction and discounted cash flow method (including buildings for own use); Other investment property – based on reference transaction and discounted cash flow method; Property under development – based on both
discounted cash flow and income capitalisation method; Plant - based on reference transaction and discounted cash flow method. The following valuation methods are available for the calculation of fair value by the external professional appraisers
for investment property, including real estate equity funds associates, rural property contracts, buildings for own use and plant: Reference transactions Independent professional appraisers use transactions in comparable properties and plant as a
reference for determining the fair value of the property and plant. The reference transactions of comparable objects are generally based on observable data consisting of the land register ‘Kadaster’ and the rural land price monitor as
published by the Dutch government ‘grondprijsmonitor’ in an active property market and in some instances accompanied by own use information. The external professional appraisers valuate the property or plant using the reference
transaction in combination with the following valuation methods to ensure the appropriate valuation of the property: Discounted cash flow method; Income capitalisation method (property only). Discounted cash flow method Under the discounted cash
flow method, fair value is estimated using assumptions regarding the benefits and liabilities of ownership over the asset’s life including an exit or terminal value. This method involves the projection of a series of cash flows on the
investment property or plant dependent on the duration of the lease contracts. A market-derived discount rate is applied to these projected cash flow series in order to establish the present value of the cash flows associated with the asset. The
exit yield is normally determined separately, and differs from the discount rate. The duration of the cash flows and the specific timing of inflows and outflows are determined by events such as rent reviews, lease renewal and related re-letting, redevelopment, or refurbishment. The appropriate duration is typically driven by market behaviour, which depends on the class of investment property. Periodic cash flow is typically estimated as gross
rental income less vacancy (apart from the rural category), non-recoverable expenses, collection losses, lease incentives, maintenance costs, agent and commission costs and other operating and management
expenses. The series of periodic net operating income, along with an estimate of the terminal value anticipated at the end of the projection period, is then discounted. For the categories residential, offices and other in applying the discounted
cash flow method, the significant inputs are the discount rate and market rental value. These inputs are verified with the following market observable data (that are adjusted to reflect the state and condition, location, development potential etc.
of the specific property): Market rent per square meter for renewals and their respective re-letting rates; Reviewed rent per square meter; Investment transactions of comparable objects; 10 Year Dutch
Government Bond Yield (%) as published by the DNB. When applying the discounted cash flow method for rural valuations, the significant inputs are the discount rate and market lease values. These inputs are verified with the following market
observable data (that are adjusted to reflect the state and condition, location, development potential etc. of the specific property): Market value per acre per region in accordance with the ‘rural land price monitor’; 10 Year Dutch
Government Bond Yield (%) as published by the DNB. Income capitalisation method Under the income capitalisation method, a property’s fair value is estimated based on the normalised net operating income generated by the property, which is
divided by the capitalisation rate (the investor’s rate of return). The difference between gross and net rental income includes the same expense categories as those for the discounted cash flow method with the exception that certain expenses
are not measured over time, but included on the basis of a time weighted average, such as the average lease-up costs. Under the income capitalisation method, rents above or below the market rent are
capitalised separately. The significant inputs for retail valuations are the reversionary yield and the market or reviewed rental value. These inputs are generally verified with the following observable data (that are adjusted to reflect the state
and condition, location, development potential etc. of the specific property): Market rent per square meter for renewals; Reviewed rent per square meter (based on the rent reviews performed in accordance with Section 303, Book 7 of the Dutch
Civil Code). The fair value of investment properties and buildings for own use, are appraised annually. Valuations are conducted by independent professional appraisers who hold recognised and relevant professional qualifications and have recent
experience in the location and category of the property being valued. Market value property valuations were prepared in accordance with the Royal Institution of Chartered Surveyors (RICS) Valuation Standards, 7th Edition (the ‘Red
Book’). a.s.r. provides adequate information to the professional appraisers, in order to conduct a comprehensive valuation. The professional appraisers are changed or rotated at least once every three years. IV. Financial instruments:
asset-backed securities The fair value of the asset-backed securities is based on quotes published by an independent data vendor. Financial statements Introduction Consolidated financial statements Accounting policies Group structure and segment
information Notes to the consolidated balance sheet Notes to the consolidated income statement Other notes Risk management Capital management Operating result Company financial statements
7.3 Accounting policies Annual Report 2025 ASR Nederland N.V. 14 Transfers between levels The hierarchical
level per individual instrument, or group of instruments, is reassessed at every reporting period. If the instrument, or group of instruments, no longer complies with the criteria of the level in question, it is transferred to the hierarchical level
that does meet the criteria. A transfer can for instance be when the market becomes less liquid or when quoted market prices for the instrument are no longer available. C. Intangible assets Intangible assets are carried at cost, less any accumulated
amortisation and impairment losses. The residual value and the estimated useful life of intangible assets are assessed on each balance sheet date and adjusted where applicable. Goodwill Acquisitions by a.s.r. are accounted for using the acquisition
method. Goodwill represents the excess of the cost of an acquisition over the fair value of a.s.r.’s share of the net identifiable assets and liabilities and contingent liabilities of the acquired company at acquisition date. If there is no
excess (purchase gain), the carrying amount is directly recognised through the income statement. At the acquisition date, goodwill is allocated to the cash-generating units (CGUs) that are expected to benefit from the business combination. Goodwill
has an indefinite useful life and is not amortised. a.s.r. performs an impairment test annually, or more frequently if events or circumstances warrant so, to ascertain whether goodwill has been subject to impairment. As part of this, the carrying
amount of the cash-generating unit to which the goodwill has been allocated is compared with its recoverable amount. The recoverable amount is the higher of a CGU’s fair value less costs to sell and value in use. The carrying value is
determined as the net asset value including goodwill. The methodologies applied to arrive at the best estimate of the recoverable amount involves two steps. In the first step of the impairment test, the best estimate of the recoverable amount of the
CGU to which goodwill is allocated is determined separately based on Price to Earnings or Price to Book ratios (fair value less cost to sell model). The ratio(s) used per CGU depends on the characteristics of the entity in question. The main
assumptions in this valuation are the multiples for the aforementioned ratios. These are developed internally but are either derived from or corroborated against market information that is related to observable transactions in the market for
comparable businesses. If the outcome of the first step indicates that the difference between the recoverable amount and the carrying value may not be sufficient to support the amount of goodwill allocated to the CGU, step two is performed. In step
two an additional analysis is performed in order to determine a recoverable amount in a manner that better addresses the specific characteristics of the relevant CGU. The additional analysis is based on internal value-in-use models, wherein managements assumptions in relation to cash flow projections for budget periods up to and including five years are used and, if deemed justified, expanded to a longer period given
the nature of the insurance activities. Other assumptions, such as the (pre-tax) discount rate and the steady state growth rate, are determined on the advice of an independent external party and are based on a
Capital Asset Pricing Model (CAPM). This methodology is based on a risk-free rate plus a risk premium. Operating assumptions are best estimate assumptions and based on historical data where available. Economic assumptions are based on observable
market data and projections of future trends. If the recoverable amount is lower than its carrying amount, the difference is directly charged to the income statement as an impairment loss. In the event of impairment, a.s.r. first reduces the
carrying amount of the goodwill allocated to the CGU. After that, the carrying amount of the other assets included in the unit is reduced pro rata to the carrying amount of all the assets in the unit. D. Investment property Investment property is
property held to earn rent and for capital appreciation. Property interests held under operating leases are classified and accounted for as investment property. In some cases, a.s.r. is the owner-occupier of investment properties. If owner-occupied
properties cannot be sold separately, they are treated as investment property only if a.s.r. holds an insignificant portion for use in the supply of services or for administrative purposes. Property held for own uses (owner-occupied) is recognised
within property, plant and equipment. Investment property is primarily recognised using the fair value model. After initial recognition, a.s.r. remeasures all of its investment property (see accounting policy B) whereby any gain or loss arising from
a change in the fair value of the specific investment property is recognised in the income statement under fair value gains and losses. Residential property is generally let for an indefinite period. Other investment property is let for defined
periods under leases that cannot be terminated early. Some contracts contain renewal options. Rentals are accounted for as investment income in the period to which they relate. If there is a change in the designation of property, it can lead to:
Reclassification from property, plant and equipment to investment property: at the end of the period of owner-occupation or at inception of an operating lease with a third party; or Reclassification from investment property to property, plant and
equipment: at the commencement of owner-occupation or at the start of developments initiated with a view to selling the property to a third party. Financial statements Introduction Consolidated financial statements Accounting policies Group
structure and segment information Notes to the consolidated balance sheet Notes to the consolidated income statement Other notes Risk management Capital management Operating result Company financial statements
7.3 Accounting policies Annual Report 2025 ASR Nederland N.V. 15 The following categories of investment
property are recognised by a.s.r. based primarily on the techniques used in determining the fair value of the investment property: Retail; Residential; Rural; Offices; Other (consisting primarily of parking); Investment property under development.
Property under development for future use as investment property is recognised as investment property. The valuation of investment property takes (expected) vacancies into account. Borrowing costs directly attributable to the acquisition or
development of an asset are capitalised and are part of the cost of that asset. Borrowing costs are capitalised when the following conditions are met: Expenditures for the asset and borrowing costs are incurred; and Activities are undertaken that
are necessary to prepare an asset for its intended use. Borrowing costs are no longer capitalised when the asset is ready for use or sale. If the development of assets is interrupted for a longer period, capitalisation of borrowing costs is
suspended. If the construction is completed in stages and each part of an asset can be used separately, the borrowing costs for each part that reaches completion are no longer capitalised. E. Financial assets and financial liabilities Recognition
and initial measurement a.s.r. recognises deposits and loans and borrowings on the date on which they originate. All other financial instruments are recognised at the transaction date, which is the date on which a.s.r. becomes party to the
contractual stipulations of the instrument. Financial assets or financial liabilities are initially measured at fair value plus, for a financial asset or financial liability not measured at FVTPL, transaction costs that are directly attributable to
its acquisition or issue. Classification and subsequent measurement When a.s.r. becomes party to a financial asset contract, the related assets are classified into one of the following categories: Amortised cost; Financial assets at fair value
through other comprehensive income (FVOCI); or Financial assets at fair value through profit or loss (FVTPL). The classification of the financial assets is determined at initial recognition. The classification and measurement of certain financial
assets (debt instruments) is based on a.s.r.’s business models in which a financial asset is managed, and its contractual cash flow characteristics. For detailed information on the fair value of the financial assets see accounting policy B.
Financial assets at amortised cost A financial asset (debt instrument) can be measured at amortised cost if it meets both of the following conditions and is not designated as FVTPL: It is held within a business model whose objective is to hold
assets to collect contractual cash flows; and Its contractual terms give rise on specified dates to cash flows that are solely payments of principal and interest on the principal amount outstanding. This is known as the SPPI test. Debt instruments
at amortised cost include mortgage loans and private loans held by Aegon Hypotheken B.V. (Aegon hypotheken). Financial assets that are designated as hedged items are measured in accordance with the requirements for hedge accounting. Financial assets
at FVOCI Equity instruments can be measured at FVOCI if they are not held for trading. There is no subsequent recycling of fair value gains and losses to profit or loss following the derecognition of the investment if elected to measure the equity
investments as FVOCI. a.s.r. classifies most equity instruments at FVOCI to reduce volatility in the income statement. Financial assets at FVTPL All financial assets not classified as measured at amortised cost or FVOCI, as described above, are
measured at FVTPL. Financial assets at FVTPL include: Derivatives that do not qualify for hedge accounting; Financial assets that are managed and whose performance is evaluated on a fair value basis, such as: - Debt instruments for which a.s.r. has
identified the business model Other; - Investments related to direct participating contracts; - Financial assets held for trading; Associates for which a.s.r. elects to measure at FVTPL under IFRS 9. Financial statements Introduction Consolidated
financial statements Accounting policies Group structure and segment information Notes to the consolidated balance sheet Notes to the consolidated income statement Other notes Risk management Capital management Operating result Company financial
statements
7.3 Accounting policies Annual Report 2025 ASR Nederland N.V. 16 Hedge accounting To qualify for hedge
accounting, the hedge relationship is designated and formally documented at inception, detailing the particular risk management objective and strategy for the hedge (which includes the item and risk that is being hedged), the derivative that is
being used and how hedge effectiveness is being assessed. A derivative has to be effective in accomplishing the objective of offsetting either changes in fair value or cash flows for the risk being hedged. The effectiveness of the hedging
relationship is evaluated on a prospective and retrospective basis using qualitative and quantitative measures of correlation. A hedging relationship is considered effective if the results of the hedging instrument are within a ratio of 80% to 125%
of the results of the hedged item. a.s.r. has elected to continue to apply the hedge accounting requirements of IAS 39 for macro fair value hedges (EU ‘carve out’) on adoption of IFRS 9. As part of its asset liability management, a.s.r.
enters into economic hedges to limit its risk exposure at Aegon hypotheken. These transactions are assessed to determine whether hedge accounting can and should be applied. a.s.r. currently applies hedge accounting for fair value hedges. Fair value
hedges a.s.r. applies fair value hedge accounting to portfolio hedges of interest rate risk (fair value macro hedging) under the EU ‘carve out’ of EU-IFRS. The EU ‘carve out’ macro
hedging enables a group of derivatives (or proportions thereof) to be viewed in combination and jointly designated as the hedging instrument and removes some of the limitations in fair value hedge accounting. Under the EU ‘carve out’,
ineffectiveness in fair value hedge accounting only arises when the revised projection of the amount of cash flows in scheduled time buckets falls below the designated amount of that bucket. a.s.r. applies fair value hedge accounting for portfolio
hedges of interest rate risk (macro hedging) under the EU ‘carve out’ to mortgage loans. Changes in the fair value of the derivatives are recognised in the income statement, together with the fair value adjustment on the mortgage loans
(hedged items) insofar as attributable to interest rate risk (the hedged risk). If the hedge relationship no longer meets the criteria for hedge accounting, the cumulative adjustment of the hedged item is, in the case of interest bearing
instruments, amortised through the income statement over the remaining term of the original hedge or recognised directly when the hedged item is derecognised. Aegon hypotheken holds portfolios of long-term fixed rate mortgages and therefore is
exposed to changes in fair value due to movements in market interest rates. Aegon hypotheken manages this risk exposure by entering into pay fixed/receive floating interest rate swaps. Only the interest rate risk element is hedged and therefore
other risks, such as credit risk, are managed but not hedged by Aegon hypotheken. This hedging strategy is applied to the portion of exposure that is not naturally offset against matching positions held by Aegon hypotheken. Changes in fair value of
the long-term fixed rate mortgages arising from changes in interest rate are usually the largest component of the overall change in fair value. This strategy is designated as a fair value hedge and its effectiveness is assessed by comparing changes
in the fair value of the loans attributable to changes in the benchmark rate of interest with changes in the fair value of the interest rate swaps. Aegon hypotheken establishes the hedging ratio by matching the notional of the derivatives with the
principal of the portfolio being hedged. Possible sources of ineffectiveness are as follows: Differences between the expected and actual volume of prepayments, as Aegon hypotheken hedges to the expected repayment date taking into account expected
prepayments based on past experience; Difference in the discounting between the hedged item and the hedging instrument, as cash collateralised interest rate swaps are discounted using Overnight Indexed Swaps (OIS) discount curves, which are not
applied to the fixed rate mortgages; Hedging derivatives with a non-zero fair value at the date of initial designation as a hedging instrument; and Counterparty credit risk which impacts the fair value of
uncollateralised interest rate swaps but not the hedged items. Aegon hypotheken manages the interest rate risk arising from fixed rate mortgages by entering into interest rate swaps on a monthly basis. The exposure from these portfolios frequently
changes due to new loans originated, contractual repayments and early prepayments made by customers in each period. As a result, Aegon hypotheken adopts a dynamic hedging strategy (sometime referred to as a ‘macro’ or
‘portfolio’ hedge) to hedge the exposure profile by closing and entering into new swap agreements at each month-end. Aegon hypotheken uses the portfolio fair value hedge of interest rate risk to
recognise fair value changes related to changes in interest rate risk in the mortgage portfolio, and therefore reduce the profit or loss volatility that would otherwise arise from changes in fair value of the interest rate swaps alone. Accrued
interest In line with Solvency II reporting a.s.r. accounts for debt instruments at their ‘dirty’ fair value, thus including any related accrued interest. Business model assessment The business model is determined at a level that
reflects how groups of financial assets are managed together to achieve a particular business objective. a.s.r.’s business models refer to how a.s.r. manages its financial assets in order to generate cash flows. a.s.r. applies the business
model Hold to Collect for the mortgage loans and private loans held by Aegon hypotheken and the business model Other for all other debt instruments. Based on these business models the mortgage loans and private loans of Aegon hypotheken that meet
the SPPI test are measured at amortised cost. All other debt instruments are measured at FVTPL. Financial statements Introduction Consolidated financial statements Accounting policies Group structure and segment information Notes to the consolidated
balance sheet Notes to the consolidated income statement Other notes Risk management Capital management Operating result Company financial statements
7.3 Accounting policies Annual Report 2025 ASR Nederland N.V. 17 Assessment whether contractual cash flows are
solely payments of principal and interest (SPPI) For the purpose of this assessment, principal is defined as the fair value of the financial asset on initial recognition. However, the principal may change over time – e.g. if there are
repayments of principal. Interest is defined as consideration for the time value of money, for the credit risk associated with the principal amount outstanding during a particular period of time and for other basic lending risks (e.g. liquidity
risk) and costs (e.g. administrative costs), as well as a profit margin that is consistent with a basic lending arrangement. Financial assets with embedded derivatives are considered in their entirety when determining whether their cash flows are
SPPI. a.s.r. assesses the SPPI for the loans portfolio held by Aegon hypotheken and for its other financial assets. All other debt instruments are mandatorily designated as at FVTPL (business model Other). Subsequent measurement and gains and losses
Financial assets at amortised cost Financial assets at amortised cost are measured at amortised cost using the effective interest method. Interest income, foreign exchange gains and losses and impairment are recognised in profit or loss. Any gain or
loss on derecognition is also recognised in profit or loss. Financial assets at FVOCI Equity investments at FVOCI are measured at fair value. All fair value gains and losses are recorded in OCI, without recycling to profit or loss. Dividends from
such investments continue to be recognised in profit or loss as Investment income when a.s.r.’s right to receive payments is established. Impairment requirements are not applicable to equity investments measured as FVOCI. Financial assets at
FVTPL Financial assets at FVTPL are measured at fair value. Net gains and losses, including any interest or dividend income and foreign exchange gains and losses, are recognised in profit or loss. Impairment requirements are not applicable to
financial assets measured at FVTPL. See accounting policy W3. Financial liabilities Classification a.s.r. classifies its liabilities into one of the following categories: financial liabilities at FVTPL (derivatives); or financial liabilities at
amortised cost (all other financial liabilities). Subsequent measurement and gains and losses Financial liabilities at FVTPL Financial liabilities at FVTPL are measured at fair value. Net gains and losses, including any interest expenses and foreign
exchange gains and losses, are recognised in profit or loss. Financial liabilities at amortised cost Financial liabilities at amortised cost are measured at amortised cost using the effective interest method. Interest expenses, foreign exchange
gains and losses are recognised in profit or loss. Any gain or loss on derecognition is also recognised in profit or loss. Accrued interest In line with Solvency II reporting a.s.r. accounts for financial liabilities at their ‘dirty’
fair value, thus including any related accrued interest. Interest on financial liabilities Interest expenses are calculated by applying the effective interest rate to the amortised cost of the liability. When calculating the effective interest rate,
a.s.r. estimates future cash flows considering all contractual terms of the liability. Derivatives including embedded derivatives Derivatives within the insurance entities are primarily used by a.s.r. for hedging interest rate and exchange rate
risks, for hedging future transactions and the exposure to market risks. These derivatives are classified as held-for-trading. Derivatives are measured at fair value
with changes in fair value recognised in profit or loss. Derivatives may be embedded in another contractual arrangement (a host contract). For contracts where the host contract is a financial asset in the scope of IFRS 9, the hybrid financial
instrument as a whole is assessed for classification and the embedded derivative is not separated from the host contract. A derivative embedded in a host insurance or reinsurance contract is not accounted for separately from the host contract if the
embedded derivate itself meets the definition of an insurance or reinsurance contract. For other contracts, a.s.r. accounts for an embedded derivative separately from the host contract when: the hybrid contract is not measured at FVTPL; the terms of
the embedded derivative would have met the definition of a derivative if they were contained in a separate contract; and the economic characteristics and risks of the embedded derivative are not closely related to those of the host contract.
Financial statements Introduction Consolidated financial statements Accounting policies Group structure and segment information Notes to the consolidated balance sheet Notes to the consolidated income statement Other notes Risk management Capital
management Operating result Company financial statements
7.3 Accounting policies Annual Report 2025 ASR Nederland N.V. 18 Impairments in the P&L a.s.r. recognises
loss allowances for ECL on debt instruments measured at amortised cost. a.s.r. uses the low credit risk simplification for investment grade debt instruments and recognises a lifetime ECL for other financial assets using the simplified approach.
Lifetime ECL are the ECL that result from all possible default events over the expected life of a financial instrument. ECLs are a probability-weighted estimate of credit losses. Credit losses are measured as the present value of all cash shortfalls
(i.e. the difference between the cash flows due to a.s.r. in accordance with the contract and the cash flows that a.s.r. expects to receive). The maximum period considered when estimating ECLs is the maximum contractual period over which a.s.r. is
exposed to credit risk. Write-off The gross carrying amount of a financial asset is written off (either partially or in full) to the extent that there is no realistic prospect of recovery. This is generally
the case when a.s.r. determines that the borrower does not have assets or resources of income that could generate sufficient cash flows to repay the amounts subject to the write-off. However, financial assets
that are written off could still be subject to enforcement activities in order to comply with a.s.r.’s procedures for recovery of amounts due. Should amounts be recovered these are then recognised when the payment has been received.
Derecognition and contract modification Financial assets a.s.r. derecognises a financial asset when the contractual rights to the cash flows from the financial asset expire, or it transfers the rights to receive the contractual cash flows in a
transaction in which substantially all of the risks and rewards of ownership of the financial asset are transferred or in which a.s.r. neither transfers nor retains substantially all of the risks and rewards of ownership and it does not retain
control of the financial asset. On derecognition of a financial asset, the difference between the carrying amount at the date of derecognition and the consideration received (including any new asset obtained less any new liability assumed) is
recognised in the income statement, unless the financial asset is an equity instrument and is measured at fair value through other comprehensive income. For these instruments any revaluation amount is transferred within equity from unrealised gains
and losses to retained earnings. a.s.r. enters into transactions whereby it transfers assets recognised in its balance sheet, but retains either all or substantially all of the risks and rewards of the transferred assets. In these cases, the
transferred assets are not derecognised. Examples of such transactions are repurchase agreements and securities lending. The asset recognised for cash paid on reverse repurchase agreements is presented under investments. The liability recognised for
cash collateral received on repurchase agreements is presented under the line item due to banks. In transactions in which a.s.r. neither retains nor transfers substantially all of the risks and rewards of ownership of a financial asset and it
retains control over the asset, a.s.r. continues to recognise the asset to the extent of its continuing involvement, determined by the extent to which it is exposed to changes in the value of the transferred asset. If the terms of a financial asset
are modified, then a.s.r. evaluates whether the cash flows of the modified asset are substantially different. If the cash flows are substantially different, then the contractual rights to cash flows from the original financial asset are deemed to
have expired. In this case, the original financial asset is derecognised and a new financial asset is recognised at fair value. If a financial asset measured at amortised cost is modified but not substantially, then the financial asset is not
derecognised. If the asset has not been derecognised, then a.s.r. recalculates the gross carrying amount of the financial asset by discounting the modified contractual cash flows at the original effective interest rate and recognises the resulting
adjustment to the gross carrying amount as a modification gain or loss in profit or loss. If such a modification is carried out because of financial difficulties of the borrower, then the gain or loss is presented together with impairment losses; in
other cases, it is presented as interest revenue. Financial liabilities a.s.r. generally derecognises a financial liability when its contractual obligations expire or are discharged or cancelled. a.s.r. also derecognises a financial liability when
its terms are modified and the cash flows of the modified liability are substantially different (i.e. the net present value of the of the cash flows under the new terms discounted at the original effective interest rate is at least 10% different
from the discounted present value of the remaining cash flows of the original debt instrument), in which case a new financial liability based on the modified terms is recognised at fair value. On derecognition of a financial liability, the
difference between the carrying amount extinguished and the consideration paid (including any non-cash assets transferred or liabilities assumed) is recognised in profit or loss. If a financial liability
measured at amortised cost is not substantially modified, then it is not derecognised. For such financial liabilities, a.s.r. recalculates the amortised cost of the financial liability by discounting the modified contractual cash flows at the
original effective interest rate and recognises any resulting adjustment to the amortised cost as a modification gain or loss in ‘other finance expenses’ in profit or loss. Any costs and fees incurred adjust the carrying amount of the
liability and are amortised over the remaining term of the modified liability. Financial statements Introduction Consolidated financial statements Accounting policies Group structure and segment information Notes to the consolidated balance sheet
Notes to the consolidated income statement Other notes Risk management Capital management Operating result Company financial statements
7.3 Accounting policies Annual Report 2025 ASR Nederland N.V. 19 F1. Insurance contracts Classification
Insurance contracts issued by a.s.r. are contracts that transfer significant insurance risks, and in some cases also financial risk, from the policyholder to a.s.r. Contracts measured using the General Measurement Model ( GMM) or Premium Allocation
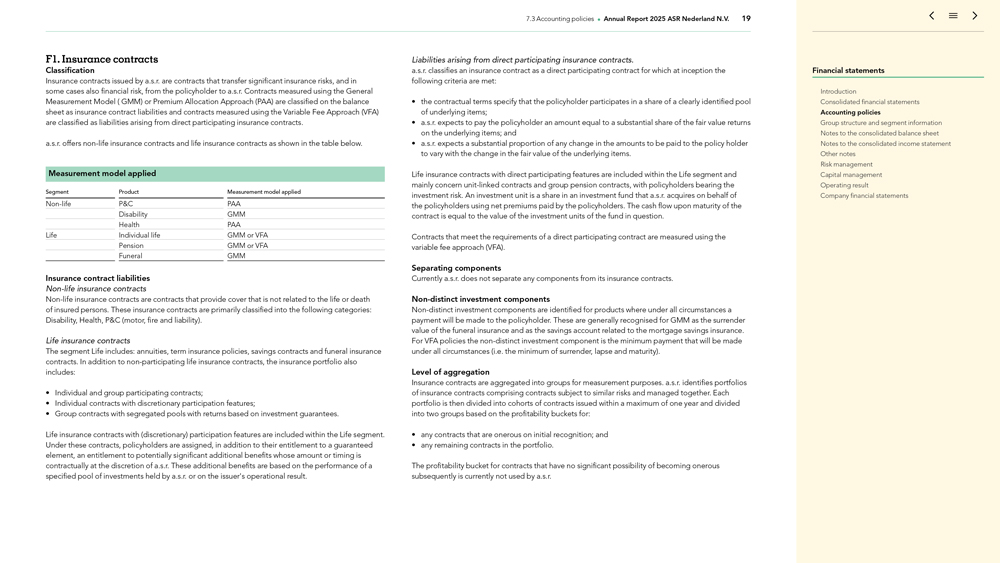
Approach (PAA) are classified on the balance sheet as insurance contract liabilities and contracts measured using the Variable Fee Approach (VFA) are classified as liabilities arising from direct participating insurance contracts. a.s.r. offers non-life insurance contracts and life insurance contracts as shown in the table below. Measurement model applied Segment Product Measurement model applied Non-life P&C PAA
Disability GMM Health PAA Life Individual life GMM or VFA Pension GMM or VFA Funeral GMM Insurance contract liabilities Non-life insurance contracts Non-life insurance
contracts are contracts that provide cover that is not related to the life or death of insured persons. These insurance contracts are primarily classified into the following categories: Disability, Health, P&C (motor, fire and liability). Life
insurance contracts The segment Life includes: annuities, term insurance policies, savings contracts and funeral insurance contracts. In addition to non-participating life insurance contracts, the insurance
portfolio also includes: Individual and group participating contracts; Individual contracts with discretionary participation features; Group contracts with segregated pools with returns based on investment guarantees. Life insurance contracts with
(discretionary) participation features are included within the Life segment. Under these contracts, policyholders are assigned, in addition to their entitlement to a guaranteed element, an entitlement to potentially significant additional benefits
whose amount or timing is contractually at the discretion of a.s.r. These additional benefits are based on the performance of a specified pool of investments held by a.s.r. or on the issuer’s operational result. Liabilities arising from direct
participating insurance contracts. a.s.r. classifies an insurance contract as a direct participating contract for which at inception the following criteria are met: the contractual terms specify that the policyholder participates in a share of a
clearly identified pool of underlying items; a.s.r. expects to pay the policyholder an amount equal to a substantial share of the fair value returns on the underlying items; and a.s.r. expects a substantial proportion of any change in the amounts to
be paid to the policy holder to vary with the change in the fair value of the underlying items. Life insurance contracts with direct participating features are included within the Life segment and mainly concern unit-linked contracts and group
pension contracts, with policyholders bearing the investment risk. An investment unit is a share in an investment fund that a.s.r. acquires on behalf of the policyholders using net premiums paid by the policyholders. The cash flow upon maturity of
the contract is equal to the value of the investment units of the fund in question. Contracts that meet the requirements of a direct participating contract are measured using the variable fee approach (VFA). Separating components Currently a.s.r.
does not separate any components from its insurance contracts. Non-distinct investment components Non-distinct investment components are identified for products where
under all circumstances a payment will be made to the policyholder. These are generally recognised for GMM as the surrender value of the funeral insurance and as the savings account related to the mortgage savings insurance. For VFA policies the non-distinct investment component is the minimum payment that will be made under all circumstances (i.e. the minimum of surrender, lapse and maturity). Level of aggregation Insurance contracts are aggregated into
groups for measurement purposes. a.s.r. identifies portfolios of insurance contracts comprising contracts subject to similar risks and managed together. Each portfolio is then divided into cohorts of contracts issued within a maximum of one year and
divided into two groups based on the profitability buckets for: any contracts that are onerous on initial recognition; and any remaining contracts in the portfolio. The profitability bucket for contracts that have no significant possibility of
becoming onerous subsequently is currently not used by a.s.r. Financial statements Introduction Consolidated financial statements Accounting policies Group structure and segment information Notes to the consolidated balance sheet Notes to the
consolidated income statement Other notes Risk management Capital management Operating result Company financial statements
7.3 Accounting policies Annual Report 2025 ASR Nederland N.V. 20 Similar risks managed together are generally
based on the homogeneous risk groups similar to those used in Solvency II at inception, more or less granularity is applied where applicable. Contracts within a portfolio that would fall into different groups only because law or regulation
specifically constraints a.s.r.’s practical ability to set a different price or level of benefits for policyholders with different characteristics are included in the same group. This applies to contracts issued in Europe that are required by
EU regulation to be priced on a gender-neutral basis. The resulting groups represent the level at which the recognition and measurement accounting policies are applied. The groups are established on initial recognition and their composition is not
subsequently reassessed. Whether a contract is onerous or not is a policy (test) which is set per business. Part of this policy will be pricing and thresholds and forward-looking metrics available within a.s.r. The test is performed based on the
contracts which are issued in any specific calendar year and are grouped according to the similar risks managed together criteria as described above. The test is generally performed on a set of contracts using reasonable and supportable information,
considering that the outcome would be the same had the individual policy assessment been performed. Recognition a.s.r. recognises a group of insurance contracts issued from the earliest of: the beginning of the coverage period of the group of
contracts. The coverage period is the period during which a.s.r. provides services (insurance services, investment-return services or investment-related services) in respect of all premiums within the boundary of the insurance contract; the date
when the first payment from a policyholder in the group becomes due. If there is no contractual due date, then it is considered to be the date when the first payment is received from the policyholder; or the group of onerous contracts, the date when
the group becomes onerous. Insurance contracts acquired in a (portfolio) transfer or a business combination are recognised on the date of acquisition. When the contract is recognised, it is added to an existing group of contracts or, if the contract
does not qualify for inclusion in an existing group, it forms a new group to which future contracts can be added. Groups of contracts are established on initial recognition and their composition is not revised once all contracts have been added to
the group. Contract boundaries The measurement of a group of contracts includes all of the future cash flows within the boundary of each contract in the group. Cash flows are within the boundary of a contract if they arise from substantive rights
and obligations that exist during the reporting period under which a.s.r. can compel the policyholder to pay premiums or has a substantive obligation to provide services. A substantive obligation to provide services ends when: a.s.r. has the
practical ability to reassess the risks of the particular policyholder and can set a price or level of benefits that fully reflects those reassessed risks; or a.s.r. has the practical ability to reassess the risks of the portfolio that contains the
contract and can set a price or level of benefits that fully reflects the risks of that portfolio; and the pricing of the premiums for coverage up to the reassessment date does not consider risks that relate to periods after the reassessment date.
For individual contracts with discretionary features the contract boundary is defined so that cash flows are within the contract boundary if they result from a substantive obligation of a.s.r. to deliver cash at a present or future date. The
contract boundary is reassessed at each reporting period and more frequently if and when product characteristics and/or conditions fundamentally change and, therefore, may change over time. Measurement a.s.r. uses the following measurement models:
the general measurement model (GMM); the variable fee approach (VFA) for contracts with a direct participating feature; and the premium allocation approach (PAA) which is a simplified version of the GMM and is used mainly for short-duration
contracts. Measurement – contracts measured under the GMM Initial measurement On initial recognition, a.s.r. measures a group of insurance contracts as the total of: the fulfilment cash flows, which comprise estimates of future cash flows,
adjusted to reflect the time value of money and the associated financial risk and the risk adjustment for non-financial risk (RA); and the CSM. The measurement of the fulfilment cash flows of a group of
insurance contracts does not reflect non-performance risk of a.s.r. It is the net present value of the projected cash flows of benefits and expenses, less the net present value of premiums, adjusted for the
risk adjustment. These cash flows are estimated using realistic, ‘best estimate’, assumptions in relation to mortality, longevity, disability, lapse rate, expense and inflation. The best estimate assumptions include mortality and
longevity trend assumptions for life expectancy. Mortality rate tables applied are generally developed based on a blend of company experience and industry wide studies, taking into consideration product characteristics, own risk selection criteria,
the insured population, recent mortality trend assumptions for life expectancy in the Netherlands and past experience. Mortality experience is monitored through regular studies, the results of which are fed into the pricing cycle for new products
and reflected in the liability calculation when appropriate. The best estimate includes the intrinsic value and the time value Financial statements Introduction Consolidated financial statements Accounting policies Group structure and segment
information Notes to the consolidated balance sheet Notes to the consolidated income statement Other notes Risk management Capital management Operating result Company financial statements
7.3 Accounting policies Annual Report 2025 ASR Nederland N.V. 21 of options and guarantees (TVOG: Time Value of
Financial Options and Guarantees) and is calculated using stochastic techniques. Where applicable, the direct or discretionary participating features of the insurance contracts, such as profit sharing, and any guaranteed benefits at maturity are
considered in the future cash flows. The cash flows are discounted using an interest curve whose construction is related to the Solvency II curve construction published by EIOPA. The construction differs in that a different CRA is determined and
used, there is no VA but there is a Liability Illiquidity Premium (LIP), a different UFR is used (2025: 3.20%, 2024: 3.25%; whereas Solvency II used 2025: 3.30%, 2024: 3.30%) and the convergence to the UFR follows a different methodology. Insurance pre-recognition cash flows consist of pre-acquisition cash flows and pre-paid premium cash flows for insurance contracts not yet
recognised. Insurance pre-acquisition cash flows that a.s.r. pays before the related group of contracts is recognised (i.e. for renewals of insurance contracts or insurance contracts recognised in the
following period), are presented as an asset under the insurance contract liabilities. When the group of contracts is recognised, these cash flows are included by way of expected acquisition cash flows in the measurement of the group and the
previously recognised asset is transferred and included as part of expected acquisition cash flows initially recognised in the insurance liability. The insurance pre-acquisition cash flow asset is reassessed
for a possible impairment trigger at each reporting date. The risk adjustment for a group of insurance contracts is the compensation required for bearing uncertainty about the amount and timing of the cash flows that arises from non-financial risk. a.s.r. disaggregates changes in the risk adjustment for non-financial risk between the insurance service result and insurance finance income or expenses.
See section 7.5.13.4. The CSM of a group of insurance contracts represents the unearned profit that a.s.r. will recognise as it provides service under those contracts. On initial recognition of a group of insurance contracts, if the total fulfilment
cash flows allocated to the contract, any previously recognised insurance acquisition cash flows, pre-paid premium cash flows and any cash flows arising from the contract at the date of initial recognition is
a net inflow, then the group is not onerous. In this case, the CSM is measured as the equal and opposite amount of the net inflow, which results in no income or expenses arising on initial recognition. For groups of contracts acquired, the
consideration received for the contracts is included in the fulfilment cash flows as a proxy for the premiums received at the date of acquisition. For business combinations see accounting policy H. If the total of the fulfilment cash flows is a net
outflow, then the group is onerous. In this case, the net outflow is recognised as a loss in the income statement, or as an adjustment to goodwill or a gain on a bargain purchase if the contracts are acquired in a business combination. A loss
component is created as part of the insurance liabilities to depict any losses recognised in the income statement, which determines the amounts that are subsequently presented in the income statement as reversals of losses on onerous groups.
Subsequent measurement The carrying amount of a group of insurance contract liabilities at each reporting date is the sum of the liability for remaining coverage and the liability for incurred claims. The liability for remaining coverage comprises:
the fulfilment cash flows that relate to services that will be provided under the contracts in future periods including the risk adjustment; and any remaining CSM at that date. The liability for incurred claims comprises the fulfilment cash flows
for incurred claims and attributable expenses that have not yet been paid, including claims that have been incurred but not yet reported, and the handling of the payments to policyholders. For the contracts in the
Non-life segment this previously concerned all future payments related to the incurred claim (the LIC option). However, following a change in accounting policy, the liability for incurred claims (LIC) option
no longer applies to the Individual Disability portfolio, see section 7.3.2.1. For this portfolio, the liability for remaining coverage (LRC) option now applies. Under the LRC approach, the liability reflects amounts payable for future insurance
services, including those related to claims incurred but still subject to insurance risk. This is consistent with the treatment in the Life segment, where the LRC option is used to account for amounts payable for the period. The accounting policy
LIC option of the Group Disability and Sickness leave portfolios remain unchanged. The fulfilment cash flows of groups of insurance contracts are measured at the reporting date using current estimates of future cash flows, current discount rates and
current estimates of the risk adjustment for non-financial risk. Changes in fulfilment cash flows are recognised as follows: Changes relating to future services are adjusted against the CSM (or recognised in
the insurance service result in profit or loss if the group is onerous); Changes relating to current or past services are recognised in the insurance service result in the income statement; Effects of the time value of money, financial risk and
changes therein on estimated future cash flows and risk adjustment for non-financial risk are recognised as insurance finance income or expenses. The CSM of each group of contracts is subsequently calculated
at each reporting date. The carrying amount of the CSM at the end of each reporting period is the carrying amount at the start of the reporting period, adjusted for: The CSM of any new contracts that are added to the group in the period; Interest
accreted on the carrying amount of the CSM during the period, measured at the discount rates on nominal cash flows that do not vary based on the returns on any underlying items determined on initial recognition; Changes in fulfilment cash flows that
relate to future services, except to the extent that: - Any increases in the fulfilment cash flows exceed the carrying amount of the CSM, in which case the excess is recognised as a loss in the income statement and creates a loss component; or - Any
decreases in the fulfilment cash flows are allocated to the loss component, reversing losses previously recognised in profit or loss; and Financial statements Introduction Consolidated financial statements Accounting policies Group structure and
segment information Notes to the consolidated balance sheet Notes to the consolidated income statement Other notes Risk management Capital management Operating result Company financial statements
7.3 Accounting policies Annual Report 2025 ASR Nederland N.V. 22 The amount recognised as insurance contract
revenue due to the services provided in the period. Changes in fulfilment cash flows that relate to future services comprise: Experience adjustments arising from premiums received in the period that relate to future services and related cash flows,
measured at the discount rates determined on initial recognition and non-distinct investment components; Changes in estimates of the present value of future cash flows in the liability for remaining coverage,
measured at the discount rates determined on initial recognition, except for those that relate to the effects of the time value of money, financial risk and changes therein; and Changes in the risk adjustment for
non-financial risk that relate to future services. CSM is recognised as insurance contract revenue following the services provided. The amount is determined by identifying coverage units in the group. The
number of coverage units in the group is the quantity of insurance contract services provided by the contracts, determined by considering for each contract the quantity of benefits provided and its expected coverage period. Changes in discretionary
cash flows are regarded as relating to future services and accordingly adjust the CSM. a.s.r. allocates the CSM to each period based on the passage of time as the service (insurance services and investment-return services) is deemed to be delivered
equally over the coverage period. To determine whether changes in cash flows are deemed to be changes in discretionary cash flows, a.s.r. exercises judgement in specifying at inception what is regarded as their commitment under the contract. How
a.s.r. specifies its commitment under the contract will determine how much of the changes in expected future cash flows will be reflected immediately in profit or loss or will adjust CSM. Measurement – contracts measured under the VFA The VFA
measurement model is used for direct participating contracts. This measurement model is identical to the GMM at initial recognition, however, subsequent measurement differs from the GMM. Direct participating insurance contracts are contracts under
which a.s.r.’s obligation to the policyholder is the net of: The obligation to pay the policyholder an amount equal to the fair value of the underlying items; and A variable fee in exchange for future services provided by the contracts, being
a.s.r.’s share of the fair value of the underlying items less fulfilment cash flows that do not vary based on the returns on underlying items. a.s.r. provides investment-related services under these contracts by promising an investment return
based on underlying items, in addition to insurance coverage. When measuring a group of direct participating contracts, a.s.r. adjusts the fulfilment cash flows for the whole of the changes in the obligation to pay policyholders an amount equal to
the fair value of the underlying items. These changes do not relate to future services and are recognised in the income statement. a.s.r. then adjusts any CSM for changes in a.s.r.’s share of the fair value of the underlying items, which
relates to future services, as explained below. Subsequent measurement The carrying amount of the CSM at the end of each reporting period is the carrying amount at the start of the reporting period, adjusted for: The CSM of any new contracts that
are added to the group in the period; a.s.r.’s share of the change in the fair value of the underlying items and changes in fulfilment cash flows that relate to future services, except to the extent that: - a.s.r. has chosen to exclude from
the CSM changes in the effect of financial risk on its share of the underlying items; - a.s.r.’s share of a decrease in the fair value of the underlying items, or an increase in the fulfilment cash flows that relate to future services, exceeds
the carrying amount of the CSM, giving rise to a loss in the income statement (included in insurance service expenses) and creating a loss component; or - a.s.r.’s share of an increase in the fair value of the underlying items, or a decrease
in the fulfilment cash flows that relate to future services, is allocated to the loss component, reversing losses previously recognised in the income statement (included in insurance service expenses); and The amount recognised as insurance contract
revenue because of the services provided in the period. Changes in fulfilment cash flows that relate to future services include the changes relating to future services specified above for contracts with direct participation features (measured at
current discount rates) , the effect of the time value of money and financial risks and the risk mitigation option where applicable. CSM is recognised as insurance contract revenue following the services provided. The amount is determined by
identifying coverage units in the group. The number of coverage units in the group is the quantity of insurance contract services provided by the contracts, determined by considering for each contract the quantity of benefits provided and its
expected coverage period. a.s.r. allocates the CSM to each period based on the passage of time as the investment-related services provided in relation to the investment component and the insurance services provided in relation to the insurance
component are deemed to be delivered equally over the coverage period. Risk mitigation a.s.r. has chosen to apply the risk mitigation option to certain VFA contracts, thereby not recognising a change in the CSM to reflect some or all of the changes
in the effect of the time value of money and financial risk (that would normally adjust the CSM) on: The amount of a.s.r.’s share of the underlying items if a.s.r. mitigates the effect of financial risk on that amount using derivatives or
reinsurance contracts held; and The fulfilment cash flows if a.s.r. mitigates the effect of financial risk on those fulfilment cash flows using derivatives, non-derivative financial instruments measured at
FVTPL, or reinsurance contracts held. Financial statements Introduction Consolidated financial statements Accounting policies Group structure and segment information Notes to the consolidated balance sheet Notes to the consolidated income statement
Other notes Risk management Capital management Operating result Company financial statements
7.3 Accounting policies Annual Report 2025 ASR Nederland N.V. 23 If a.s.r. mitigates the effect of financial
risk using derivatives or non-derivative financial instruments measured at FVTPL, it shall include insurance finance income or expenses for the period arising from the application of the risk mitigation in
profit or loss. If a.s.r. mitigates the effect of financial risk using reinsurance contracts held, it shall apply the same accounting policy for the presentation of insurance finance income or expenses arising from the application of the risk
mitigation as a.s.r. applies to other reinsurance contracts held. a.s.r. does not currently use reinsurance as a hedge instrument dedicated to financial risks. Measurement – contracts measured under the PAA The PAA simplifies the measurement
of groups of contracts when: the coverage period of each contract in the group of contracts is one year or less; or a.s.r. expects that the resulting measurement would not differ materially from the result of applying the GMM. Initial measurement On
initial recognition of each group of contracts, the carrying amount of the liability for remaining coverage is measured at the premiums received on initial recognition. Insurance acquisition cash flows are recognised as expenses when they are
incurred making use of the option under IFRS 17. The risk adjustment is an implicit part of the valuation of the related liability. Subsequent measurement. Subsequently, the carrying amount of the liability for remaining coverage is increased by any
premiums received and decreased by the amount recognised as insurance contract revenue for coverage provided. This is recognised over the coverage period based on the passage of time. If at any time during the coverage period, facts and
circumstances indicate that a group of contracts is onerous, then a.s.r. recognises a loss in the income statement and increases the liability for remaining coverage to the extent that the current estimates of the fulfilment cash flows that relate
to remaining coverage (including the risk adjustment for non-financial risk) exceed the carrying amount of the liability for remaining coverage. a.s.r. recognises the liability for incurred claims of a group
of insurance contracts at the amount of the fulfilment cash flows relating to incurred claims, including a risk adjustment for non-financial risk. The fulfilment cash flows are discounted at current rates.
Derecognition and contract modification a.s.r. derecognises a contract when it is extinguished – i.e. when the specified obligations in the contract expire or are discharged or cancelled. a.s.r. also derecognises a contract if its terms are
modified in a way that would have changed the accounting for the contract significantly had the new terms always existed, in which case a new contract based on the modified terms is recognised. If a contract modification does not result in
derecognition, then a.s.r. treats the changes in cash flows caused by the modifications as changes in estimates of fulfilment cash flows. On the derecognition of a contract from within a group of contracts: The fulfilment cash flows allocated to the
group are adjusted to eliminate the present value of the future cash flows and risk adjustment for non-financial risk relating to the rights and obligations that have been derecognised from the group; and The
CSM of the group is adjusted for the change in fulfilment cash flows. If a contract is derecognised because its terms are substantially modified, then the CSM is also adjusted for the premium that would have been charged had a.s.r. entered into a
contract with the new contract’s terms at the date of modification, less any additional premium charged for the modification. The new contract recognised is measured assuming that, at the date of modification, the issuer received the premium
that it would have charged less any additional premium charged for the modification. F2. Reinsurance contracts Classification Contracts held by a.s.r. under which it transfers significant insurance risk related to insurance contracts are classified
as reinsurance contracts. a.s.r. does not issue reinsurance contracts. Separating components and Level of aggregation The accounting principles for the separation of components do not differ from those for insurance contracts. For the determination
of the level of aggregation for reinsurance contracts the accounting principles are the same with the exception that a reinsurance contract cannot be classified as onerous. Recognition a.s.r. recognises a group of reinsurance contracts held that do
not provide proportionate coverage at the earlier of (i) the beginning of the coverage period of the group of reinsurance contracts held; and (ii) the date a.s.r. recognises an onerous group of underlying contracts if a.s.r. entered into
the related reinsurance contract held at or before that date. Contract boundaries The measurement of a group of reinsurance contracts held includes all of the future cash flows within the boundary of each contract in the group. Cash flows are within
the boundary of a contract if they arise from substantive rights and obligations that exist during the reporting period under which a.s.r. has a right to receive services from the reinsurer and is compelled to pay premiums. Measurement –
contracts under the PAA a.s.r. uses the PAA as the default measurement approach for reinsurance contracts with a coverage period of one year or less, but the business line has the option to choose the GMM. To measure a group of reinsurance contracts
a.s.r. applies the same accounting policies for the related insurance contracts, adapted where necessary to reflect the features of reinsurance contracts held that differ from those of the insurance contracts. Financial statements Introduction
Consolidated financial statements Accounting policies Group structure and segment information Notes to the consolidated balance sheet Notes to the consolidated income statement Other notes Risk management Capital management Operating result Company
financial statements

7.3 Accounting policies Annual Report 2025 ASR Nederland N.V. 24 Measurement – contracts under the GMM
a.s.r. applies the same accounting policies for insurance contracts to measure a group of reinsurance contracts, with the following modifications. The carrying amount of a group of reinsurance contracts at each reporting date is the sum of the
remaining coverage component and the incurred claims component. The remaining coverage component comprises: The fulfilment cash flows that relate to services that will be received under the contracts in future periods including the risk adjustment;
and Any remaining CSM at that date. a.s.r. measures the estimates of the present value of future cash flows using assumptions that are consistent with those used to measure the estimates of the present value of future cash flows for the underlying
insurance contracts. Loss-recovery component a.s.r. determines a loss-recovery component of the asset for remaining coverage of a group of reinsurance contracts held when a.s.r. recognises a recovery of a loss on initial recognition of an onerous
group of underlying contracts as well as for subsequent measurement of the recovery of losses. This loss-recovery component is accounted for in a manner consistent with the loss component of the group of underlying insurance contracts issued. As
such, as cedant, a.s.r. determines the resulting amount of the loss-recovery at initial recognition to be recognised in profit or loss by multiplying: The loss recognised on the group of underlying insurance contracts; and The percentage of claims
on underlying contracts a.s.r. expects to recover from the group of reinsurance contracts held. After a.s.r. has established a loss-recovery component, it shall adjust it to reflect changes in the loss component of the underlying contracts.
Therefore, the balance of loss-recovery component needs to be tracked along the fulfilment of the reinsurance group and run off to zero at the end of the reinsurance coverage period or earlier when the loss component on the underlying group(s) has
been fully reversed. The carrying amount of the loss recovery component shall not exceed the portion of the carrying amount of the loss component of the underlying insurance contracts that a.s.r. expects to recover from the group of reinsurance
contracts held. The risk adjustment for non-financial risk is the amount of the risk transferred by a.s.r. to the reinsurer. On initial recognition, the CSM of a group of reinsurance contracts represents a net
cost or net gain on purchasing reinsurance. It is measured as the equal and opposite amount of the total of the fulfilment cash flows, any derecognised assets for cash flows occurring before the recognition of the group and any cash flows arising at
that date, and taking into account any recognised loss recovery component, if applicable. However, if any net cost on purchasing reinsurance coverage relates to insured events that occurred before the purchase of the group, then a.s.r. recognises
the cost immediately in the income statement as an expense. The carrying amount of the CSM at the end of each reporting period is the carrying amount at the start of the reporting period, adjusted for: The CSM of any new contracts that are added to
the group in the period; Interest accreted on the carrying amount of the CSM during the period, measured at the discount rates on nominal cash flows that do not vary based on the returns on any underlying items determined on initial recognition;
Changes in fulfilment cash flows that relate to future services, unless the change results from a change in fulfilment cash flows allocated to a group of onerous underlying insurance contracts, in which case the change is recognised in the income
statement; The amount recognised in the income statement because of the services received in the period. CSM is recognised in profit or loss following the services provided. Non-performance risk Changes in the
fulfilment cash flows related to the risk of non-performance do not adjust the CSM, therefore a.s.r. recognises them in profit or loss. This requires that the fulfilment cash flows must be adjusted to include
the effect of any non-performance risk, or credit risk, by the reinsurer. Reinsurance contracts cannot be onerous. G. Employee benefit plans Pension obligations Defined contribution plans a.s.r. has defined
contribution (DC) plans for all its employees, including employees that are employed by entities that operate in the Distribution and Service segment. a.s.r. pays contributions to privately administered pension insurance plans with ASR
Levensverzekering N.V. (a.s.r. life) on a contractual basis. The old DC plan of Aegon employees became non-contributory, when they entered the a.s.r. DC plan. a.s.r. life recognises these contracts as
insurance contracts. They are accounted for in accordance with liabilities arising from insurance contracts (accounting policy F1). a.s.r. has no further payment obligations to the employees once the contributions have been paid. The contributions
are recognised as operating expenses in the income statement during the period the services are rendered. Prepaid contributions are recognised as an asset to the extent that a cash refund or a reduction in future payments is available. Defined
benefit plans Defined benefit (DB) plans for own employees are non-contributory. The defined benefit obligation continues to exist. The plans are schemes under which employees are awarded pension benefits upon
retirement, usually dependent on one or more factors, such as years of service and compensation. The liability in respect of DB plans is the present value of the defined benefit obligation at the balance sheet date, less the fair value of the plan
assets where the pension plans are insured by third parties. Financial statements Introduction Consolidated financial statements Accounting policies Group structure and segment information Notes to the consolidated balance sheet Notes to the
consolidated income statement Other notes Risk management Capital management Operating result Company financial statements
7.3 Accounting policies Annual Report 2025 ASR Nederland N.V. 25 a.s.r. life and Aegon life administer most of
the post-employment benefit plans and hold the investments that are intended to cover the employee benefit obligation. These investments do not qualify as plan assets in the consolidated financial statements under IFRS. The DB obligation is based on
the terms and conditions of the plan applicable on the balance sheet date. In measuring the DB obligation a.s.r. uses the projected unit credit method and actuarial assumptions that represent the best estimate of future variables. The benefits are
discounted using an interest rate based on the internal curve for high quality corporate bonds, that are denominated in the currency in which the benefits will be paid and that have terms to maturity that approximate the terms of the related pension
liability. Actuarial assumptions used in the measurement of the liability include the discount rate, estimated future wage inflation, mortality rates, consumer price inflation and for the Aegon DB also salary increases and bonuses. The assumptions
are updated and reviewed at each reporting date, based on available market data. Actuarial assumptions may differ from actual results due to changes in market conditions, economic trends, mortality trends and other assumptions. Any change in these
assumptions can have a significant impact on the defined benefit obligation and future pension costs. Changes in the expected actuarial assumptions and differences with the actual actuarial outcomes are recognised in the actuarial gains and losses
included in other comprehensive income (component of total equity). When employee benefit plans are modified and when no further obligations exist, a gain or loss, resulting from the changes are recognised directly in the income statement.
Consistent with the calculation of a gain or loss on a plan amendment, a.s.r. will use updated actuarial assumptions to determine the current service cost and net interest for the remainder of the annual reporting period upon the time of such
amendment. The effect of the asset ceiling, if applicable, is disregarded when calculating the gain or loss on any settlement of the plan. The financing cost related to employee benefits is recognised in interest expense. The current service costs
are included in operating expenses. Other long-term employee benefits Plans that offer benefits for long-service (leave), but do not qualify as a post-employment benefit plan, such as jubilee benefits, are measured at present value using the
projected unit credit method and changes are recognised directly in the income statement. Other post-retirements obligations a.s.r. offers post-employment benefit plans, such as arrangement for mortgage loans at a discount (fixed amount, reference
date December 2017). The entitlement to these benefits is usually conditional on the employee remaining in service up to retirement age and the completion of a minimum service period. The expected costs of these benefits are accrued over the period
of employment using an accounting methodology that is similar to that for DB plans. Vacation entitlements A liability is formed for the vacation days which have not been taken at year-end. H. Acquisitions
(Business combinations) Business acquisitions are accounted for according to the acquisition method, with the cost of the acquisitions being allocated to the fair value of the acquired identifiable assets, liabilities and contingent liabilities. The
goodwill is determined as the difference between the cost of the acquisition and a.s.r.’s interest in the fair value of the acquired identifiable assets, liabilities and contingent liabilities at the acquisition date. Additionally for
insurance contracts acquired that are onerous at the transaction date, the difference between the fair value and the fulfilment cash flows is also part of the goodwill. Any change, in the fair value of acquired assets and liabilities at the
acquisition date, determined within one year after acquisition, is recognised as an adjustment charged to goodwill in case of a preliminary valuation. Adjustments that occur after a period of one year are recognised in the income statement.
Adjustments to the purchase price that are contingent on future events, and to the extent that these are not already included in the purchase price, are included in the purchase price of the acquisition at the time the adjustment is likely and can
be measured reliably. I. Discontinued operations Classification as held for sale occurs when the carrying amount will be recovered principally through a sale transaction rather than through continuing use. Classification as a discontinued operation
occurs at the earlier of disposal or when the operation meets the criteria to be classified as held for sale. When a group of assets classified as held for sale represents a major line of business or geographical area the disposal group classifies
as discontinued operations. The comparative consolidated income statement and consolidated statement of comprehensive income are restated to show the discontinued operations separately from the continuing operations. Where applicable in the notes to
the financial statements the reclassification to assets held for sale and liabilities relating to assets held for sale are recognised in the changes in the composition of the Group. Should the impairment exceed the carrying value of the non-current assets within the scope of IFRS 5 measurement, any remaining impairment amount will be presented as a separate provision. Financial statements Introduction Consolidated financial statements Accounting
policies Group structure and segment information Notes to the consolidated balance sheet Notes to the consolidated income statement Other notes Risk management Capital management Operating result Company financial statements
7.3 Accounting policies Annual Report 2025 ASR Nederland N.V. 26 7.3.5 Other accounting policies J. Basis for
consolidation—subsidiaries The consolidated financial statements include the financial statements of a.s.r. and its subsidiaries. Subsidiaries are those entities (which may include deemed separate entities, the
so-called silos and investments on behalf of policyholders) over which a.s.r. has control. Control exists when a.s.r. is exposed, or has rights, to variable returns from its involvement with the subsidiary and
has the ability to affect those returns through its power over the subsidiary. This is the case if more than half of the voting rights may be exercised or if a.s.r. has control in any other manner. Subsidiaries are fully consolidated from the date
on which control is acquired by a.s.r. and are deconsolidated when control ceases to exist. A subsidiary’s assets, liabilities and contingent liabilities are measured at fair value on the acquisition date and are subsequently accounted for in
accordance with a.s.r.’s accounting policies. Non-controlling interests are initially stated at their proportionate share in the fair value of the net assets on the acquisition date and are subsequently
adjusted for the non-controlling interest in changes in the subsidiary’s equity. The fund assets and liabilities of a.s.r. Premiepensioeninstelling B.V. (a.s.r. IORP), which is a.s.r.’s Institution
for Occupational Retirement Provision (IORP), are a silo outside of the control of a.s.r., therefore these assets and liabilities are not consolidated by a.s.r. Only the remaining assets and liabilities within a.s.r. IORP (outside of the silo) are
consolidated into a.s.r.’s financial statements. Intragroup transactions Intragroup balances and transactions between consolidated group companies are eliminated. Gains and losses on transactions between a.s.r. and associates and joint
ventures are eliminated to the extent of a.s.r.’s interest in these entities. Structured entities Structured entities that are consolidated include certain mortgage-backed securitisation deals, where a.s.r. was involved in the design of the
structured entities and also has the ability to use its power to affect the amount of the investee’s returns. Other factors that contribute to the conclusion that consolidation of these entities is required includes consideration of whether
a.s.r. fully services the investees and can therefore influence the defaults of the mortgage portfolios and the fact that in these cases the majority of risks are maintained by a.s.r. Structured entities that are not consolidated include general
account investments in non-affiliated structured entities that are used for investment purposes. K. Product classification Insurance contracts are defined as contracts under which a.s.r. accepts significant
insurance risk from policyholders by agreeing to compensate policyholders if a specified uncertain future event adversely affects the policyholder. These contracts are considered insurance contracts throughout the remaining term to maturity,
irrespective of when the insured event occurs. In addition, these contracts can also transfer financial risk. a.s.r. offers non-life insurance contracts and life insurance contracts. Non-life insurance contracts Non-life insurance contracts are contracts that provide cover that is not related to the life or death of insured persons. These insurance
contracts are classified into the following categories: Disability, Health, P&C (motor, fire and liability) and Other. Life insurance contracts Life insurance contracts (in cash) include savings-linked mortgages, annuities, term insurance
policies, savings contracts and funeral insurance contracts. In addition to non-participating life insurance contracts, the insurance portfolio also includes: Individual and group participating contracts;
Individual contracts with discretionary participation features; Group contracts with segregated pools with returns based on investment guarantees. Direct participating insurance contracts Claims from these life insurance contracts are directly
linked to the underlying investments. The investment risk and return are borne fully for policyholders. Life insurance contracts for the account and risk of policyholders generally consist of contracts where premiums, after deduction of costs and
risk premium, are invested in unit-linked funds. For some individual contracts, a.s.r. guarantees returns on unit-linked investment funds. In addition, group contracts with segregated pools are classified as direct participating insurance contracts.
Financial statements Introduction Consolidated financial statements Accounting policies Group structure and segment information Notes to the consolidated balance sheet Notes to the consolidated income statement Other notes Risk management Capital
management Operating result Company financial statements
7.3 Accounting policies Annual Report 2025 ASR Nederland N.V. 27 L. Segment information a.s.r. divides its
operations into five reportable segments, reflecting differences in risk and return profiles and aligning with the internal reporting structure reviewed by the Executive Board (the chief operating decision maker). Insurance activities comprise: Non-life: Non-life insurance in the Netherlands, including disability, property & casualty, and health insurance. Life: Life insurance in the Netherlands, including
defined benefit and defined contribution pensions, Individual life & Funeral insurance, as well as IORP investment contracts (policyholder risk) and private investing services. Non-insurance
activities are presented as three segments: Asset Management: Asset management activities, including investment property management and mortgage origination . Distribution and Services: Distribution of insurance contracts and related business
services. Holding and Other: Holding activities (including group-related functions), other holding and intermediate holding companies, real estate development, minority participations, and entities classified as discontinued operations. Segment
information is prepared in accordance with the accounting principles used for the preparation of a.s.r.’s consolidated financial statements. Goodwill and other intangibles are presented in the related cash generating unit’s segment.
Intersegment transactions are conducted at arm’s length conditions. In general, costs related to centralised services are allocated to the segments based on the utilisation of these services. The Executive Board sets and monitors segment
targets and budgets. Each segment aligns its strategies and policies with a.s.r.’s group strategy. Segment performance is assessed based on their operating result (see section 7.10 ). M. Transaction date and settlement date All purchases and
sales of financial instruments, which have to be settled in accordance with standard market conventions, are recognised at the transaction date, which is the date on which a.s.r. becomes party to the contractual stipulations of the instrument. Any
purchases and sales other than those requiring delivery within the time frame established by regulations or market conventions are accounted for as forward transactions until the time of settlement. For details on these transactions, see accounting
policy E. N. Securities lending a.s.r. participates in securities lending transactions, whereby collateral is received in the form of securities or cash. Cash received as collateral is recognised in the balance sheet and a corresponding liability is
recognised as liabilities arising from securities lending in ‘Due to banks’. Securities lent remain on the balance sheet. Securities received as collateral are not recognised in the balance sheet. O. Statement of cash flows The statement
of cash flows classifies cash flows by operating activities, investing activities and financing activities. Cash flows denominated in foreign currencies are converted at the exchange rates applicable on the transaction date. Cash flows from
operating activities are reported using the indirect method. Cash flows from operating activities include result before tax, adjustments for gains and losses that did not result in income and payments in the same financial year, adjustments for
movements in provisions, and accrued and deferred items. The statement of cash flows recognises interest received and paid, and dividends received within cash flows from operating activities. Cash flows from purchasing and selling investments and
investment property are included in cash flows from operating activities on a net basis. Dividends paid are recognised within cash flows from financing activities. P. Property, plant and equipment Property held for own use and plant Property held
for own use and plants comprise of land and office buildings and plants like wind farms and are measured at fair value (revaluation model) based on annual valuations, conducted by external, independent valuators with adequate professional expertise
and experience in the specific location and categories of properties or plant. They are subsequently measured at fair value, including any unrealised fair value changes in equity, taking into account any deferred tax liabilities. For the method of
determining the fair value reference is made to accounting policy B for investment property and plant. Increase in the fair value exceeding the cost price is added to the revaluation reserve in shareholders’ equity, less deferred taxes.
Decreases in the fair value that offset previous increases of the same asset, are charged against the revaluation reserve. The revaluation reserve cannot be negative. All other decreases in fair value are accounted for in the income statement.
Increases that reverse a revaluation decrease on the same asset previously recognised in net result are recognised in the income statement. Buildings and wind farms are depreciated using the straight-line method based on expected useful life, taking
into account their fair value amount, the residual value from the time when it is in the location and condition necessary for it to be capable of operating in the manner intended by management. The useful life of buildings is assessed annually for
every individual component (component approach). Financial statements Introduction Consolidated financial statements Accounting policies Group structure and segment information Notes to the consolidated balance sheet Notes to the consolidated income
statement Other notes Risk management Capital management Operating result Company financial statements
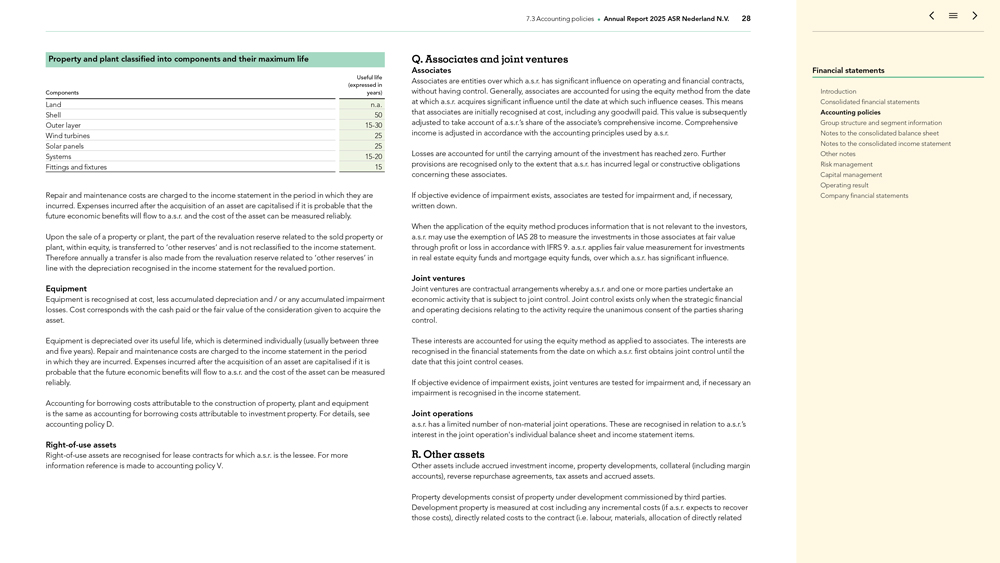
7.3 Accounting policies Annual Report 2025 ASR Nederland N.V. 28 Property and plant classified into components
and their maximum life Useful life (expressed in Components years) Land n.a. Shell 50 Outer layer 15-30 Wind turbines 25 Solar panels 25 Systems 15-20 Fittings and
fixtures 15 Repair and maintenance costs are charged to the income statement in the period in which they are incurred. Expenses incurred after the acquisition of an asset are capitalised if it is probable that the future economic benefits will flow
to a.s.r. and the cost of the asset can be measured reliably. Upon the sale of a property or plant, the part of the revaluation reserve related to the sold property or plant, within equity, is transferred to ‘other reserves’ and is not
reclassified to the income statement. Therefore annually a transfer is also made from the revaluation reserve related to ‘other reserves’ in line with the depreciation recognised in the income statement for the revalued portion.
Equipment Equipment is recognised at cost, less accumulated depreciation and / or any accumulated impairment losses. Cost corresponds with the cash paid or the fair value of the consideration given to acquire the asset. Equipment is depreciated over
its useful life, which is determined individually (usually between three and five years). Repair and maintenance costs are charged to the income statement in the period in which they are incurred. Expenses incurred after the acquisition of an asset
are capitalised if it is probable that the future economic benefits will flow to a.s.r. and the cost of the asset can be measured reliably. Accounting for borrowing costs attributable to the construction of property, plant and equipment is the same
as accounting for borrowing costs attributable to investment property. For details, see accounting policy D. Right-of-use assets Right-of-use assets are recognised for lease contracts for which a.s.r. is the lessee. For more information reference is made to accounting policy V. Q. Associates and joint ventures Associates Associates are
entities over which a.s.r. has significant influence on operating and financial contracts, without having control. Generally, associates are accounted for using the equity method from the date at which a.s.r. acquires significant influence until the
date at which such influence ceases. This means that associates are initially recognised at cost, including any goodwill paid. This value is subsequently adjusted to take account of a.s.r.’s share of the associate’s comprehensive income.
Comprehensive income is adjusted in accordance with the accounting principles used by a.s.r. Losses are accounted for until the carrying amount of the investment has reached zero. Further provisions are recognised only to the extent that a.s.r. has
incurred legal or constructive obligations concerning these associates. If objective evidence of impairment exists, associates are tested for impairment and, if necessary, written down. When the application of the equity method produces information
that is not relevant to the investors, a.s.r. may use the exemption of IAS 28 to measure the investments in those associates at fair value through profit or loss in accordance with IFRS 9. a.s.r. applies fair value measurement for investments in
real estate equity funds and mortgage equity funds, over which a.s.r. has significant influence. Joint ventures Joint ventures are contractual arrangements whereby a.s.r. and one or more parties undertake an economic activity that is subject to
joint control. Joint control exists only when the strategic financial and operating decisions relating to the activity require the unanimous consent of the parties sharing control. These interests are accounted for using the equity method as applied
to associates. The interests are recognised in the financial statements from the date on which a.s.r. first obtains joint control until the date that this joint control ceases. If objective evidence of impairment exists, joint ventures are tested
for impairment and, if necessary an impairment is recognised in the income statement. Joint operations a.s.r. has a limited number of non-material joint operations. These are recognised in relation to
a.s.r.’s interest in the joint operation’s individual balance sheet and income statement items. R. Other assets Other assets include accrued investment income, property developments, collateral (including margin accounts), reverse
repurchase agreements, tax assets and accrued assets. Property developments consist of property under development commissioned by third parties. Development property is measured at cost including any incremental costs (if a.s.r. expects to recover
those costs), directly related costs to the contract (i.e. labour, materials, allocation of directly related Financial statements Introduction Consolidated financial statements Accounting policies Group structure and segment information Notes to the
consolidated balance sheet Notes to the consolidated income statement Other notes Risk management Capital management Operating result Company financial statements
7.3 Accounting policies Annual Report 2025 ASR Nederland N.V. 29 costs, payments to subcontractors) and
construction period interest, less any invoiced instalments and impairments. Revenue on property development is primarily accounted for at the moment the property is sold. This is a performance obligation satisfied at a point in time. The point in
time is the moment a customer obtains control of the promised asset. Property developments which are sold can have guarantees (such as rent guarantees or construction guarantees), which may give rise to a separate performance obligation. S. Cash and
cash equivalents Cash and cash equivalents include cash in hand, deposits held at call with banks, cash collateral and other short-term highly liquid investments that are not subject to a significant risk of changes in value. Cash and cash
equivalents are measured at fair value through profit or loss. T. Equity Share capital and share premium reserve The share capital disclosed in the balance sheet consists of issued and fully paid-up ordinary
shares. The share premium reserve comprises additional paid-in capital in excess of the par value of the shares. Reserve for unrealised gains and losses This reserve consists of: Unrealised gains and losses
from assets FVOCI net of tax (see accounting policy E); The share of unrealised gains and losses of associates and joint ventures using the equity method held by a.s.r. (see accounting policy Q); Unrealised change in value of property for own use
(see accounting policy P); Actuarial gains and losses Actuarial gains and losses result from the post-employment benefit pension plans (see accounting policy G). Retained earnings Retained earnings also include other reserves and the unappropriated
result. Other equity instruments This item represents the par value of the other equity instruments. Costs directly attributable to the equity issue and the tax impact thereof are recognised in retained earnings. Treasury shares Treasury shares are
a.s.r.’s own ordinary shares that have been issued and subsequently reacquired by a.s.r. Treasury shares are deducted from equity, regardless of the objective of the transaction. No gain or loss is recognised in the income statement on the
purchase, sale, issue or cancellation of the instruments. If sold, the difference between the carrying amount and the proceeds is reflected in retained earnings. The consideration paid or received is recognised directly in shareholders’
equity. All treasury shares are eliminated in the calculation of earnings per share and dividend per ordinary share. Treasury shares are either required as part of the share buy-back program, or acquired and
resold as part of the employee share purchase plan, see section 7.7.6. Non-controlling interest The non-controlling interest relates to the equity in a consolidated
subsidiary not attributable, directly or indirectly, to a.s.r. (see accounting policy J). Dividends on ordinary share capital Dividends on ordinary shares are recognised as a liability and recognised in equity when they are approved by
a.s.r.’s shareholders. Interim dividends are recognised in equity when they are paid. Dividends for the year that are approved after the reporting date are treated as an event after the reporting date. Discretionary interest on other equity
instruments Discretionary interest on other equity instruments is recognised in equity upon payment. The related income tax on these equity instruments is recognised in the income statement. U. Financing Financing includes savings deposits,
borrowings, due to customers, due to banks, subordinated liabilities and other financial liabilities. On initial recognition, debt instruments and other loans are stated at fair value, net of transaction costs incurred. Subsequent valuation is at
amortised cost. Any difference between the proceeds and the redemption value is recognised in the income statement over the period of the borrowings using the effective interest method. Lease liabilities are included under borrowings and measured in
accordance with accounting policy V. V. Leasing A contract is, or contains, a lease if the contract conveys the right to control the use of an identified asset for a period of time in exchange for a consideration. For contracts that contain a lease
component and one or more additional lease or non-lease components a.s.r. applies the practical expedient not to separate non-lease components from lease components. At
the commencement date of the lease, a.s.r. recognises a right-of-use asset and a lease liability. The
right-of-use asset comprises the amount of the lease liability at initial measurement. The lease liability is measured at the present value of the lease payments that
are not paid at the commencement date. For vehicles, the lease payments are discounted using the interest rate implicit in the lease. For other leases a.s.r.’s incremental borrowing rate is used. Subsequently, the right-of-use asset is valued at cost less any cumulated depreciation and any accumulated impairment losses and adjusted for any remeasurement of the lease liability. The lease
liability is increased with interest accrued and reduced for lease payments made. When applicable the lease liability is remeasured for changes in future payments resulting from a change in index or lease term. The right-of-use assets are presented under property, plant and equipment. The lease liabilities are presented under borrowings. Financial statements Introduction Consolidated financial statements Accounting
policies Group structure and segment information Notes to the consolidated balance sheet Notes to the consolidated income statement Other notes Risk management Capital management Operating result Company financial statements
7.3 Accounting policies Annual Report 2025 ASR Nederland N.V. 30 W1. Insurance contract revenue Insurance
contract revenue excludes any investment components and is measured as follows. Insurance contract revenue – contracts measured under the GMM or VFA a.s.r. recognises insurance contract revenue as it satisfies its performance obligations
– i.e. as it provides coverage or other services required due to groups of insurance contracts. For contracts measured under the GMM or VFA, the insurance contract revenue relating to services provided for each period represents the total of
the changes in the liability for remaining coverage that relate to services for which a.s.r. expects to receive consideration. Insurance contract revenue consists of the sum of the changes in the liability for remaining coverage due to: The
insurance service expenses incurred in the period measured at the amounts expected at the beginning of the period, excluding: – Amounts allocated to the loss component; – Repayments of investment components; – Amounts that relate
to transaction-based taxes collected on behalf of third parties; – Insurance acquisition expenses; and – Amounts relating to risk adjustment for non-financial risk. The change in the risk
adjustment for non-financial risk, excluding: – Changes that relate to future service that adjust the CSM; and – Amounts allocated to the loss component. The amount of CSM for the services provided
in the period; In addition, a.s.r. allocates a portion of premiums that relate to recovering insurance acquisition cash flows to each period in a systematic way based on the passage of time. a.s.r. recognises the allocated amount as insurance
contracts revenue and an equal amount as insurance service expenses. The amount of the CSM of a group of insurance contracts that is recognised as insurance contract revenue in each reporting period is generally determined by considering the
quantity of benefits provided from the services per insurance contract and allocating the CSM per insurance contract remaining at the end of the reporting period (before any allocation) equally to the services provided in the reporting period and
expected to be provided in future periods. Per group of contracts, in accordance with the level of aggregation criteria, the CSM is subsequently released, considering each individual contract, to the current coverage period and to future coverage
periods in which the insurance contract service is expected to be provided (considering expected contract terms and survivor, lapse and death assumptions). Insurance contract revenue – contracts measured under the PAA For contracts measured
under the PAA, the insurance contract revenue for each period is the amount of expected premium receipts for providing coverage in the period. a.s.r. allocates the expected premium receipts to each period on the basis of the passage of time.
Allocation of reinsurance premiums paid a.s.r. allocates reinsurers premiums paid as it receives coverage or other services under groups of reinsurance contracts. For contracts measured under the GMM the allocation of reinsurance premiums paid
relating to services received for each reporting period represents the total of the changes in the remaining coverage component that relate to services for which a.s.r. expects to pay consideration. For contracts measured under the PAA, the
allocation of reinsurance premiums paid for each period is the amount of expected premium payments for receiving coverage in the period. W2. Insurance service expenses Insurance service expenses arising from insurance contracts are recognised in the
income statement generally as they are incurred. They comprise the following items: Claims and benefits —Incurred claims and benefits; —Losses and reversal of losses on onerous contracts; —Adjustment of the liabilities for incurred
claims and benefits that do not arise from the effects of the time value of money, financial risk and changes therein; Insurance service operating expenses —Attributable insurance service operating expenses; —Acquisition costs when
incurred for insurance contracts measured under the PAA; and—Amortisation of insurance acquisition cash flows for contracts not measured under the PAA. Loss components a.s.r. establishes a loss component of the liability for remaining coverage
for onerous groups of insurance contracts. The loss component determines the amounts of fulfilment cash flows that are subsequently presented in the income statement as reversals of losses on onerous contracts and are excluded from insurance
contract revenue when they occur. When the fulfilment cash flows occur, they are allocated between the loss component and the liability for remaining coverage excluding the loss component on a systematic basis. The systematic basis is determined by
the proportion of the loss component relative to the total estimate of the present value of the future cash outflows plus the risk adjustment for non-financial risk at the beginning of each period (or on
initial recognition if a group of contracts is initially recognised in the period). Decreases in fulfilment cash flows relating to future services or increases in a.s.r.’s share of the fair value of any underlying items are allocated solely to
the loss component. If the loss component is reduced to zero, then any excess over the amount allocated to the loss component creates a new CSM for the group of contracts. Financial statements Introduction Consolidated financial statements
Accounting policies Group structure and segment information Notes to the consolidated balance sheet Notes to the consolidated income statement Other notes Risk management Capital management Operating result Company financial statements
7.3 Accounting policies Annual Report 2025 ASR Nederland N.V. 31 W3. Investment income Investment income
comprises the direct investment income such as interest income on financial assets, dividends received, rental income from investment property and other direct investment income. Fair value gains and losses includes the net gains on financial assets
at FVTPL, net gains on derecognition of financial assets and liabilities at amortised cost and fair value gains on investment property. Interest income Interest income for all interest-bearing instruments includes coupons earned on fixed income
instruments and is recognised on an accrual basis. Transaction costs attributable to the acquisition of debt securities at fair value through profit or loss are immediately recognised in the income statement. When unpaid interest has accrued before
the acquisition of an interest-bearing investment, the subsequent receipt of interest is allocated between pre-acquisition and post-acquisition periods; only the post-acquisition portion is recognised as
revenue. The pre-acquisition interest is part of the consideration paid. Interest rate swaps When the two legs of an interest rate swap are settled gross, interest paid and interest received on these swap are
not offset. Gross settlement means that both legs of the swap are settled separately: one party receives interest and the other party pays interest. The net amount depends on the market interest rate. Interest received is accounted for as direct
investment income, interest paid is accounted for as other finance expense. Impairments When a receivable is impaired, a lifetime expected credit loss (ECL) is recognised and interest income is calculated on the net carrying amount (that is the
gross carrying amount less credit allowance). Dividends Dividend income is recognised in the income statement when a right to receive payment is established. Rental income Rental income from investment property is allocated to the period to which
they relate. W4. Insurance finance income and expenses Insurance finance income and expenses comprise changes in the carrying amounts of groups of insurance and reinsurance contracts, measured through GMM and PAA, arising from the effects of the
time value of money, financial risk and changes therein. For direct participating insurance contracts (VFA) the change in the fair value of the underlying items is included in the insurance finance income and expenses. X. Solvency II a.s.r. needs to
comply with prudential reporting requirements set under Solvency II, which differ from EU-IFRS in a number of areas. In accordance with the Solvency II regulations (2009/138/EG art. 75—86), Solvency II
figures are based on fair value. Fair value measurement is based on the same fair value hierarchy described in the IFRS accounting policies (see accounting policy B). Most important adjustments in the balance sheet, compared to IFRS, are the
valuation of the (savings-linked) mortgage loans-portfolio and the liabilities arising from insurance contracts (including the risk margin). Solvency II Basic Own Funds consists of the excess of assets over liabilities and subordinated liabilities,
minus foreseeable dividend. At 31 December 2025, the Solvency Capital Requirement (SCR) of a.s.r. and the life insurance entities is based on the Partial Internal Model (PIM). The PIM is approved by DNB. In 2024, only Aegon life and Aegon
spaarkas calculated the SCR based on PIM, while a.s.r. Life applied the standard formula. The calculations of the Loss Absorbing Capacity of Deferred Tax (LAC DT) for a.s.r. life, Aegon life and Aegon spaarkas are based on the PIM outcomes. The SCR
for the other insurance entities are entirely based on the standard formula, including the calculation of the LAC DT of these entities. The LAC DT methodology is reviewed and properly documented. Financial statements Introduction Consolidated
financial statements Accounting policies Group structure and segment information Notes to the consolidated balance sheet Notes to the consolidated income statement Other notes Risk management Capital management Operating result Company financial
statements
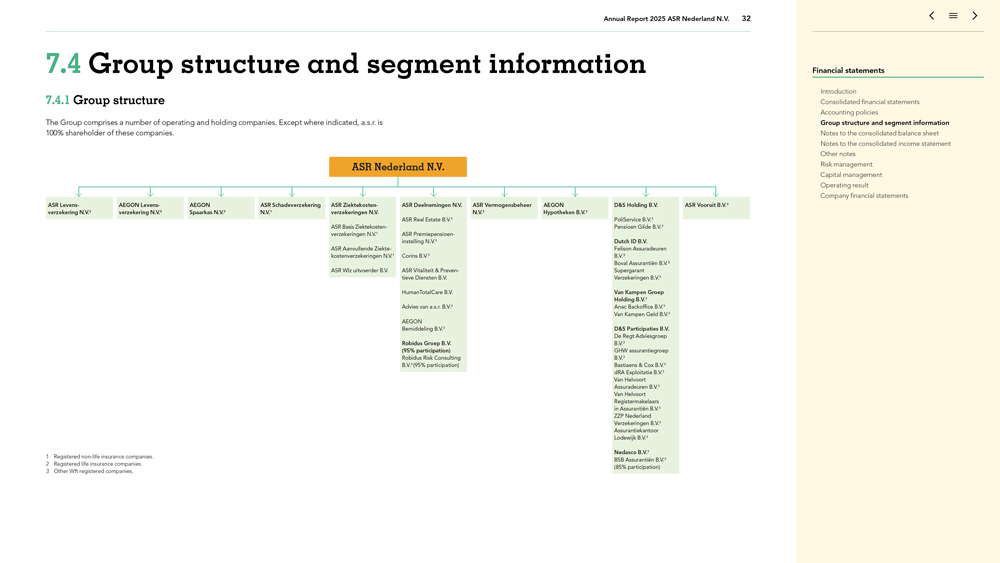
Annual Report 2025 ASR Nederland N.V. 32 7.4 Group structure and segment information 7.4.1 Group structure The
Group comprises a number of operating and holding companies. Except where indicated, a.s.r. is 100% shareholder of these companies. ASR Nederland N.V. ASR Levens- AEGON Levens- AEGON ASRSchadeverzekering ASR Ziektekosten- ASR Deelnemingen N.V. ASR
Vermogensbeheer AEGON D&S Holding B.V. ASR Vooruit B.V.3 verzekering N.V.2 verzekering N.V.2 Spaarkas N.V.2 N.V.1 verzekeringen N.V. N.V.3 Hypotheken B.V.3 ASR Real Estate B.V.3 PoliService B.V.3 ASR Basis Ziektekosten -Pensioen Gilde B.V.3
verzekeringen N.V.1 ASR Premiepensioen -instelling N.V.3 Dutch ID B.V. ASR Aanvullende Ziekte -FelisonAssuradeuren kostenverzekeringen N.V.1 Corins B.V.3 B.V.³ Boval Assurantiën B.V.³ ASR Wlz uitvoerder B.V. ASR
Vitaliteit & Preven -Supergarant tieve Diensten B.V. VerzekeringenB.V.3 HumanTotalCare B.V. Van Kampen Groep Holding B.V.3 Advies van a.s.r. B.V.3 Anac Backoffice B.V.3 Van Kampen Geld B.V.3 AEGON Bemiddeling B.V.3 D&S
Participaties B.V. De Regt Adviesgroep Robidus Groep B.V. B.V.3 (95% participation) GHWassurantiegroep Robidus Risk Consulting B.V.3 B.V.3 (95% participation) Bastiaens & Cox B.V.3 dRA Exploitatie B.V.3 Van Helvoort AssuradeurenB.V.3 Van
Helvoort Registermakelaars in Assurantiën B.V.3 ZZP Nederland VerzekeringenB.V.3 Assurantiekantoor Lodewijk B.V.3 Nedasco B.V.3 1 Registered non-life insurance companies. 3 BSB Assurantiën B.V. 2
Registered life insurance companies. (85% participation) 3 Other Wft registered companies. Financial statements Introduction Consolidated financial statements Accounting policies Group structure and segment information Notes to the consolidated
balance sheet Notes to the consolidated income statement Other notes Risk management Capital management Operating result Company financial statements
7.4 Group structure and segment information Annual Report 2025 ASR Nederland N.V. 33 Segment information See
accounting policy L The operations of a.s.r. have been divided into five operating segments (2024: five). The main segments are the Non-life and Life segment in which all insurance activities are presented.
The other activities are presented as three separate segments being Asset Management, Distribution and Services and Holding and Other. Intersegment transactions or transfers are concluded at arm’s length conditions. See section 7.7.9 List of
principal group companies for a list of principal group companies and associates in the relevant segments. In January 2025 Aegon Cappital B.V. legally merged with ASR Premiepensioeninstelling N.V., after which the former ceased to exist. The a.s.r.
segment reporting shows the financial performance of each segment. The purpose is to allocate all items in the balance sheet and income statement to the segments that hold full management responsibility for them. The eliminations applied in the
reconciliation of the segment information to the consolidated balance sheet and the consolidated income statement are separately presented in sections 7.4.2 and 7.4.3. The segments are assessed on their operating result as defined in section 7.10.
Financial statements Introduction Consolidated financial statements Accounting policies Group structure and segment information Notes to the consolidated balance sheet Notes to the consolidated income statement Other notes Risk management Capital
management Operating result Company financial statements
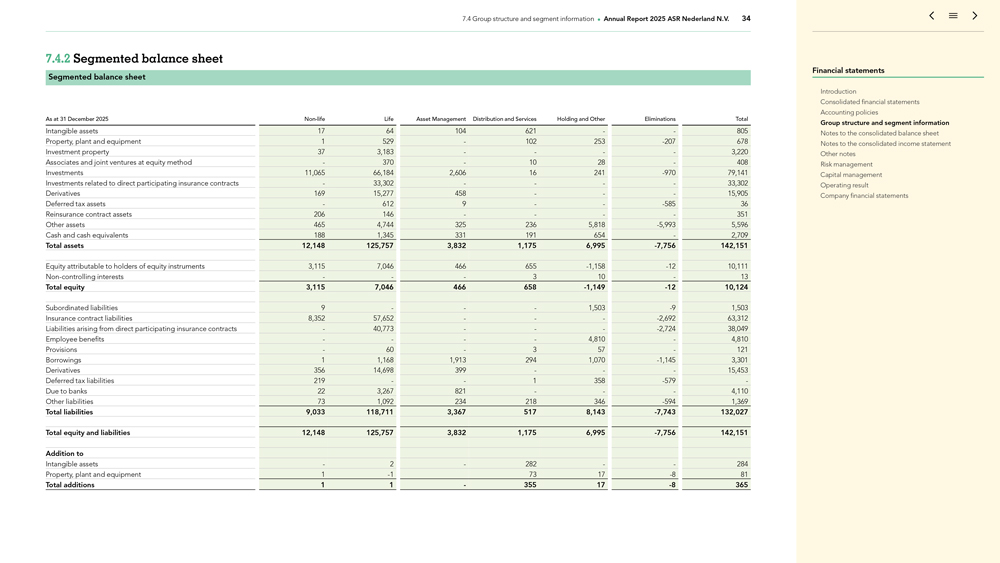
7.4 Group structure and segment information Annual Report 2025 ASR Nederland N.V. 34 7.4.2 Segmented balance
sheet Segmented balance sheet As at 31 December 2025 Non-life Life Asset Management Distribution and Services Holding and Other Eliminations Total Intangible assets 17 64 104 621 — 805 Property,
plant and equipment 1 529—102 253 -207 678 Investment property 37 3,183 — — 3,220 Associates and joint ventures at equity method—370—10 28—408 Investments 11,065 66,184
2,606 16 241 -970 79,141 Investments related to direct participating insurance contracts—33,302 — — 33,302 Derivatives 169 15,277 458 ——15,905 Deferred tax assets—612 9
— -585 36 Reinsurance contract assets 206 146 — — 351 Other assets 465 4,744 325 236 5,818 -5,993 5,596 Cash and cash equivalents 188 1,345 331 191
654—2,709 Total assets 12,148 125,757 3,832 1,175 6,995 -7,756 142,151 Equity attributable to holders of equity instruments 3,115 7,046 466 655 -1,158 -12 10,111 Non-controlling interests ——3 10—13 Total equity 3,115 7,046 466 658 -1,149
-12 10,124 Subordinated liabilities 9 ——1,503 -9 1,503 Insurance contract liabilities 8,352 57,652
——-2,692 63,312 Liabilities arising from direct participating insurance contracts—40,773 ——-2,724 38,049 Employee benefits — —
4,810—4,810 Provisions—60—3 57—121 Borrowings 1 1,168 1,913 294 1,070 -1,145 3,301 Derivatives 356 14,698 399 ——15,453 Deferred tax liabilities 219 — 1 358 -579 -Due to banks 22 3,267 821 ——4,110 Other liabilities 73 1,092 234 218 346 -594 1,369 Total liabilities 9,033 118,711
3,367 517 8,143 -7,743 132,027 Total equity and liabilities 12,148 125,757 3,832 1,175 6,995 -7,756 142,151 Addition to Intangible assets—2—282 — 284
Property, plant and equipment 1 -1 73 17 -8 81 Total additions 1 1—355 17 -8 365 Financial statements Introduction
Consolidated financial statements Accounting policies Group structure and segment information Notes to the consolidated balance sheet Notes to the consolidated income statement Other notes Risk management Capital management Operating result Company
financial statements
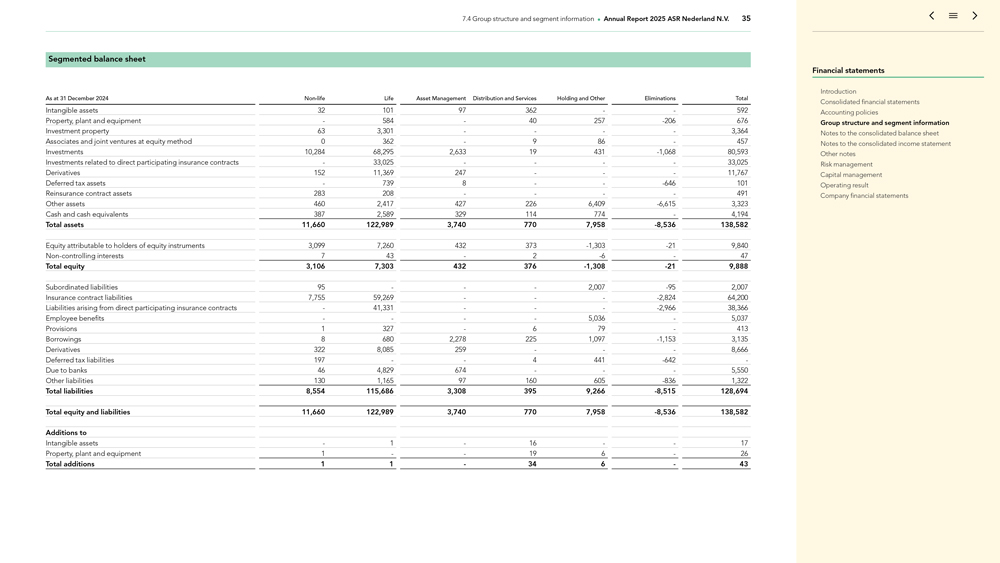
7.4 Group structure and segment information Annual Report 2025 ASR Nederland N.V. 35 Segmented balance sheet As
at 31 December 2024 Non-life Life Asset Management Distribution and Services Holding and Other Eliminations Total Intangible assets 32 101 97 362 — 592 Property, plant and
equipment—584—40 257 -206 676 Investment property 63 3,301 — — 3,364 Associates and joint ventures at equity method 0 362—9 86—457 Investments 10,284 68,295 2,633 19 431 -1,068 80,593 Investments related to direct participating insurance contracts—33,025 — — 33,025 Derivatives 152 11,369 247 ——11,767 Deferred tax assets—739 8 — -646 101 Reinsurance contract assets 283 208 — — 491 Other assets 460 2,417 427 226 6,409 -6,615 3,323 Cash and cash equivalents 387 2,589 329 114 774—4,194
Total assets 11,660 122,989 3,740 770 7,958 -8,536 138,582 Equity attributable to holders of equity instruments 3,099 7,260 432 373 -1,303
-21 9,840 Non-controlling interests 7 43—2 -6—47 Total equity 3,106 7,303 432 376
-1,308 -21 9,888 Subordinated liabilities 95 ——2,007 -95 2,007 Insurance contract liabilities 7,755 59,269 ——-2,824 64,200 Liabilities arising from direct participating insurance contracts—41,331 ——-2,966 38,366 Employee benefits — —
5,036—5,037 Provisions 1 327—6 79—413 Borrowings 8 680 2,278 225 1,097 -1,153 3,135 Derivatives 322 8,085 259 ——8,666 Deferred tax liabilities 197 — 4 441 -642 -Due to banks 46 4,829 674 ——5,550 Other liabilities 130 1,165 97 160 605 -836 1,322 Total liabilities 8,554 115,686
3,308 395 9,266 -8,515 128,694 Total equity and liabilities 11,660 122,989 3,740 770 7,958 -8,536 138,582 Additions to Intangible assets—1—16 — 17
Property, plant and equipment 1 — 19 6—26 Total additions 1 1—34 6—43 Financial statements Introduction Consolidated financial statements Accounting policies Group structure and segment information Notes to the consolidated
balance sheet Notes to the consolidated income statement Other notes Risk management Capital management Operating result Company financial statements
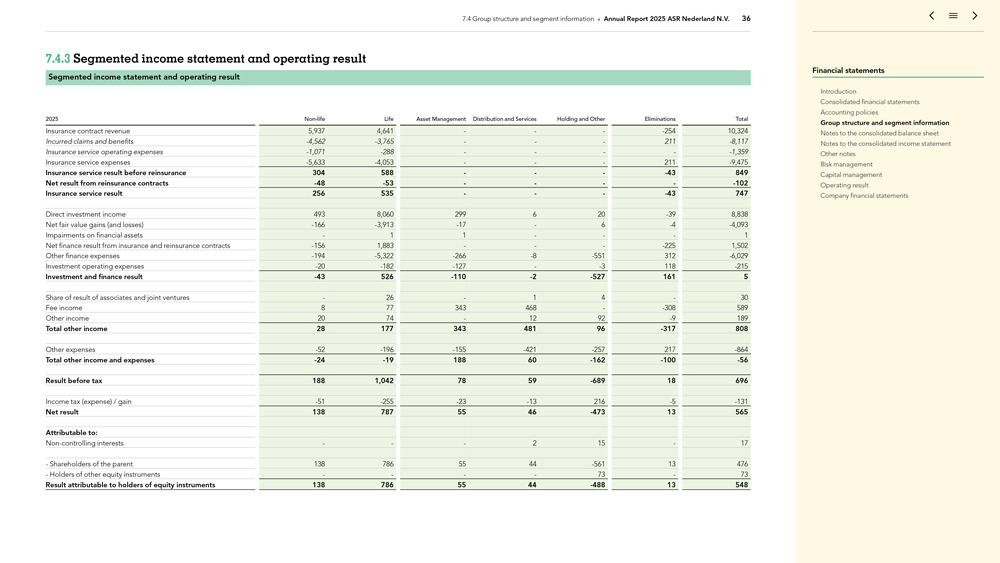
7.4 Group structure and segment information Annual Report 2025 ASR Nederland N.V. 36 7.4.3 Segmented income
statement and operating result Segmented income statement and operating result 2025 Non-life Life Asset Management Distribution and Services Holding and Other Eliminations Total Insurance contract revenue
5,937 4,641 ——-254 10,324 Incurred claims and benefits -4,562 -3,765 ——211
-8,117 Insurance service operating expenses -1,071 -288 — — -1,359 Insurance
service expenses -5,633 -4,053 ——211 -9,475 Insurance service result before reinsurance 304 588 ——-43 849 Net result from reinsurance contracts -48 -53 — — -102
Insurance service result 256 535 ——-43 747 Direct investment income 493 8,060 299 6 20 -39 8,838 Net fair value gains (and losses) -166 -3,913 -17—6 -4 -4,093 Impairments on
financial assets—1 1 ——1 Net finance result from insurance and reinsurance contracts -156 1,883 ——-225 1,502 Other finance expenses -194 -5,322 -266 -8 -551 312 -6,029 Investment operating expenses -20 -182
-127—-3 118 -215 Investment and finance result -43 526 -110 -2 -527 161 5 Share of result of associates and joint ventures—26—1 4—30 Fee income 8 77 343 468—-308 589 Other income 20 74—12 92 -9 189 Total other income 28 177 343 481 96 -317 808 Other expenses -52 -196 -155 -421 -257 217 -864 Total other income and expenses -24 -19 188 60 -162
-100 -56 Result before tax 188 1,042 78 59 -689 18 696 Income tax (expense) / gain -51 -255 -23 -13 216 -5 -131 Net result 138 787 55 46 -473 13 565 Attributable to: Non-controlling interests ——2 15—17 —Shareholders of the parent 138 786 55 44 -561
13 476—Holders of other equity instruments — — 73—73 Result attributable to holders of equity instruments 138 786 55 44 -488 13 548 Financial statements Introduction Consolidated
financial statements Accounting policies Group structure and segment information Notes to the consolidated balance sheet Notes to the consolidated income statement Other notes Risk management Capital management Operating result Company financial
statements
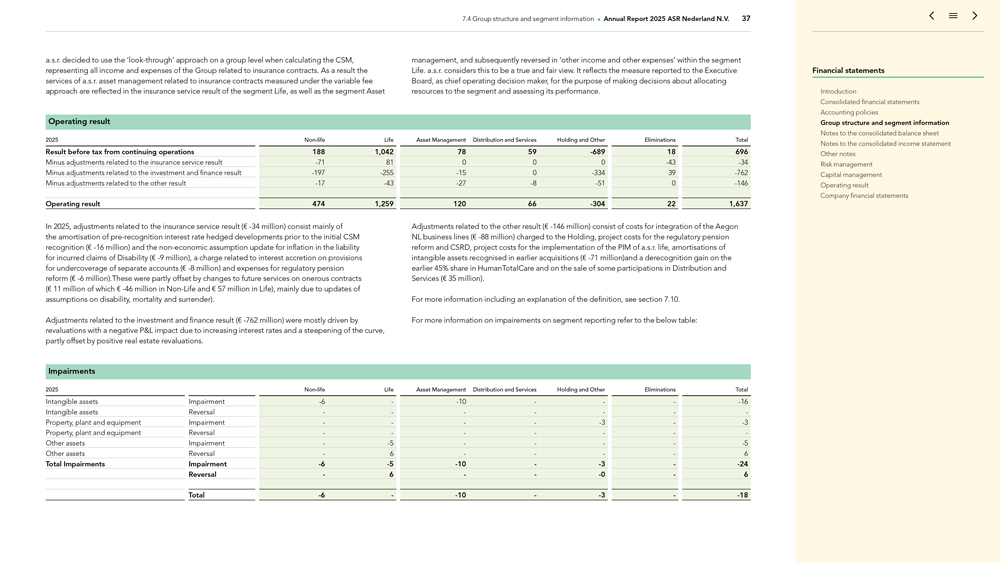
7.4 Group structure and segment information Annual Report 2025 ASR Nederland N.V. 37 a.s.r. decided to use the
‘look-through’ approach on a group level when calculating the CSM, representing all income and expenses of the Group related to insurance contracts. As a result the services of a.s.r. asset management related to insurance contracts
measured under the variable fee approach are reflected in the insurance service result of the segment Life, as well as the segment Asset management, and subsequently reversed in ‘other income and other expenses’ within the segment Life.
a.s.r. considers this to be a true and fair view. It reflects the measure reported to the Executive Board, as chief operating decision maker, for the purpose of making decisions about allocating resources to the segment and assessing its
performance. Operating result 2025 Non-life Life Asset Management Distribution and Services Holding and Other Eliminations Total Result before tax from continuing operations 188 1,042 78 59 -689 18 696 Minus adjustments related to the insurance service result -71 81 0 0 0 -43 -34
Minus adjustments related to the investment and finance result -197 -255 -15 0 -334 39 -762 Minus adjustments related to the other result -17 -43 -27
-8 -51 0 -146 Operating result 474 1,259 120 66 -304 22 1,637 In 2025, adjustments
related to the insurance service result (€ -34 million) consist mainly of the amortisation of pre-recognition interest rate hedged developments prior to the
initial CSM recognition (€ -16 million) and the non-economic assumption update for inflation in the liability for incurred claims of Disability (€ -9 million), a charge related to interest accretion on provisions for undercoverage of separate accounts (€ -8 million) and expenses for regulatory
pension reform (€ -6 million).These were partly offset by changes to future services on onerous contracts (€ 11 million of which
€ -46 million in Non-Life and € 57 million in Life), mainly due to updates of assumptions on disability, mortality and surrender).
Adjustments related to the investment and finance result (€ -762 million) were mostly driven by revaluations with a negative P&L impact due to increasing interest rates and a steepening of the
curve, partly offset by positive real estate revaluations. Adjustments related to the other result (€ -146 million) consist of costs for integration of the Aegon NL business lines (€ -88 million) charged to the Holding, project costs for the regulatory pension reform and CSRD, project costs for the implementation of the PIM of a.s.r. life, amortisations of intangible assets
recognised in earlier acquisitions (€ -71 million)and a derecognition gain on the earlier 45% share in HumanTotalCare and on the sale of some participations in Distribution and Services
(€ 35 million). For more information including an explanation of the definition, see section 7.10. For more information on impairements on segment reporting refer to the below table: Impairments 2025
Non-life Life Asset Management Distribution and Services Holding and Other Eliminations Total Intangible assets Impairment
-6—-10 ——-16 Intangible assets Reversal — — — -Property, plant and equipment Impairment
— — -3—-3 Property, plant and equipment Reversal — — — -Other assets Impairment—-5
— — -5 Other assets Reversal—6 — — 6 Total Impairments Impairment -6 -5 -10—-3—-24 Reversal—6 — -0—6 Total
-6—-10—-3—-18 Financial statements Introduction Consolidated financial
statements Accounting policies Group structure and segment information Notes to the consolidated balance sheet Notes to the consolidated income statement Other notes Risk management Capital management Operating result Company financial statements
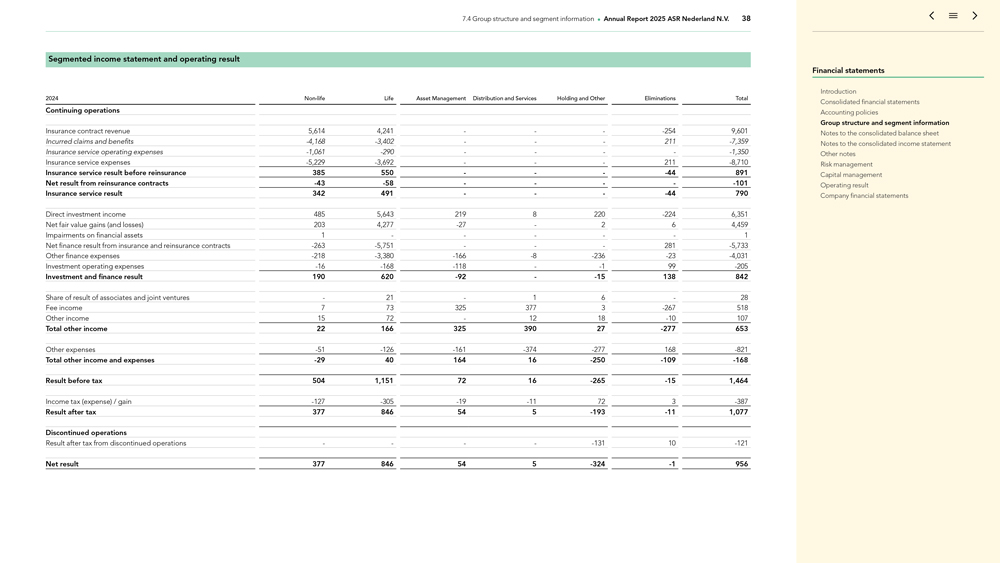
7.4 Group structure and segment information Annual Report 2025 ASR Nederland N.V. 38 Segmented income statement
and operating result 2024 Non-life Life Asset Management Distribution and Services Holding and Other Eliminations Total Continuing operations Insurance contract revenue 5,614 4,241 ——-254 9,601 Incurred claims and benefits -4,168 -3,402 ——211 -7,359
Insurance service operating expenses -1,061 -290 — — -1,350 Insurance service expenses
-5,229 -3,692 ——211 -8,710 Insurance service result before reinsurance 385 550
——-44 891 Net result from reinsurance contracts -43 -58 — — -101
Insurance service result 342 491 ——-44 790 Direct investment income 485 5,643 219 8 220 -224 6,351 Net fair value gains (and losses) 203 4,277 -27—2 6 4,459 Impairments on financial assets 1 — ——1 Net finance result from insurance and reinsurance contracts -263
-5,751 ——281 -5,733 Other finance expenses -218 -3,380 -166 -8 -236 -23 -4,031 Investment operating expenses -16 -168 -118—-1 99 -205 Investment and finance
result 190 620 -92—-15 138 842 Share of result of associates and joint ventures—21—1 6—28 Fee income 7 73 325 377 3 -267 518 Other income 15 72—12 18 -10 107 Total other income 22 166 325 390 27 -277 653 Other expenses -51 -126 -161 -374 -277 168 -821 Total other income and expenses -29 40 164 16 -250 -109
-168 Result before tax 504 1,151 72 16 -265 -15 1,464 Income tax (expense) / gain -127 -305 -19 -11 72 3 -387 Result after tax 377 846 54 5
-193 -11 1,077 Discontinued operations Result after tax from discontinued operations — — -131 10 -121 Net result 377 846 54 5 -324 -1 956 Financial statements Introduction Consolidated financial statements Accounting policies Group
structure and segment information Notes to the consolidated balance sheet Notes to the consolidated income statement Other notes Risk management Capital management Operating result Company financial statements
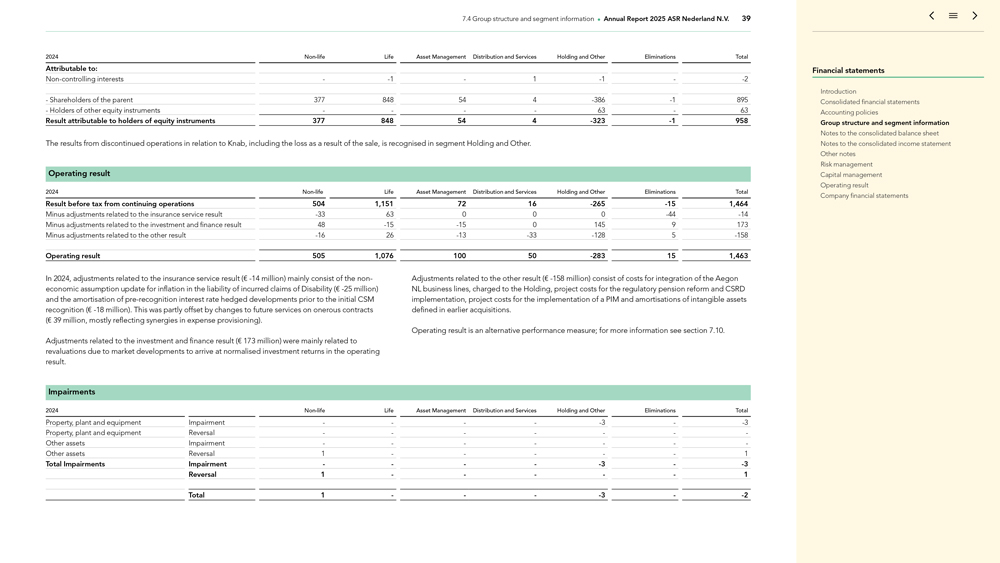
7.4 Group structure and segment information Annual Report 2025 ASR Nederland N.V. 39 2024 Non-life Life Asset Management Distribution and Services Holding and Other Eliminations Total Attributable to: Non-controlling
interests—-1—1 -1—-2 —Shareholders of the parent 377 848 54 4
-386 -1 895—Holders of other equity instruments — — 63—63 Result attributable to holders of equity instruments 377 848 54 4 -323 -1 958 The results from discontinued operations in relation to Knab, including the loss as a result of the sale, is recognised in segment Holding and Other. Operating
result 2024 Non-life Life Asset Management Distribution and Services Holding and Other Eliminations Total Result before tax from continuing operations 504 1,151 72 16
-265 -15 1,464 Minus adjustments related to the insurance service result -33 63 0 0 0 -44
-14 Minus adjustments related to the investment and finance result 48 -15 -15 0 145 9 173 Minus adjustments related to the other
result -16 26 -13 -33 -128 5 -158 Operating
result 505 1,076 100 50 -283 15 1,463 In 2024, adjustments related to the insurance service result (€ -14 million) mainly consist of the non-economic assumption update for inflation in the liability of incurred claims of Disability (€ -25 million) and the amortisation of
pre-recognition interest rate hedged developments prior to the initial CSM recognition (€ -18 million). This was partly offset by changes to future services on
onerous contracts (€ 39 million, mostly reflecting synergies in expense provisioning). Adjustments related to the investment and finance result (€ 173 million) were mainly related to revaluations due to market developments
to arrive at normalised investment returns in the operating result. Adjustments related to the other result (€ -158 million) consist of costs for integration of the Aegon NL business lines, charged
to the Holding, project costs for the regulatory pension reform and CSRD implementation, project costs for the implementation of a PIM and amortisations of intangible assets defined in earlier acquisitions. Operating result is an alternative
performance measure; for more information see section 7.10. Impairments 2024 Non-life Life Asset Management Distribution and Services Holding and Other Eliminations Total Property, plant and equipment
Impairment — — -3—-3 Property, plant and equipment Reversal — — — -Other assets Impairment — — — -Other assets
Reversal 1 — ——1 Total Impairments Impairment — — -3—-3 Reversal 1 — ——1 Total 1 ——-3—-2 Financial statements Introduction Consolidated financial statements Accounting policies Group structure and segment information Notes to the consolidated balance sheet Notes to the
consolidated income statement Other notes Risk management Capital management Operating result Company financial statements
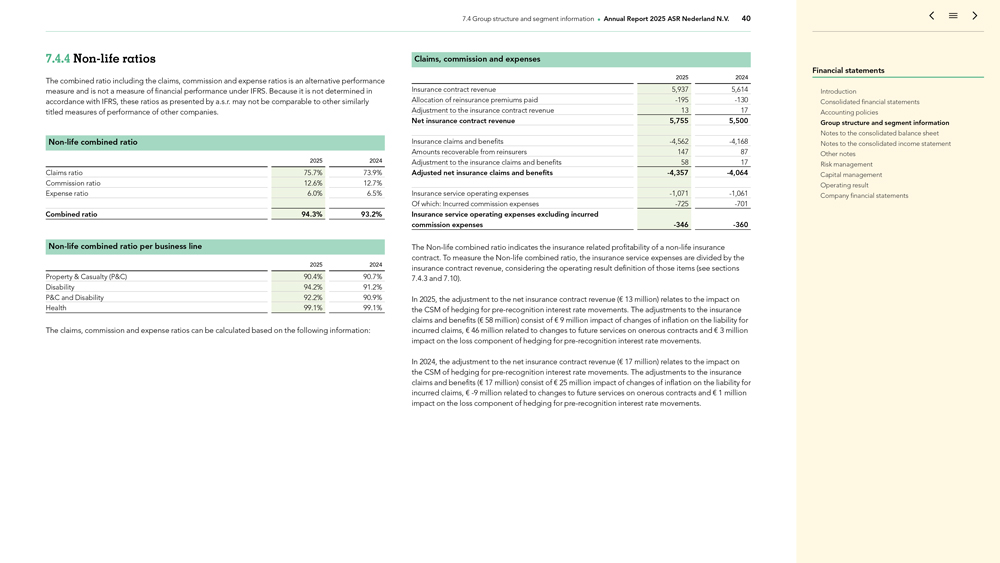
7.4 Group structure and segment information Annual Report 2025 ASR Nederland N.V. 40 7.4.4 Non-life ratios The combined ratio including the claims, commission and expense ratios is an alternative performance measure and is not a measure of financial performance under IFRS. Because it is not determined in
accordance with IFRS, these ratios as presented by a.s.r. may not be comparable to other similarly titled measures of performance of other companies. Non-life combined ratio 2025 2024 Claims ratio 75.7% 73.9%
Commission ratio 12.6% 12.7% Expense ratio 6.0% 6.5% Combined ratio 94.3% 93.2% Non-life combined ratio per business line 2025 2024 Property & Casualty (P&C) 90.4% 90.7% Disability 94.2% 91.2%
P&C and Disability 92.2% 90.9% Health 99.1% 99.1% The claims, commission and expense ratios can be calculated based on the following information: Claims, commission and expenses 2025 2024 Insurance contract revenue 5,937 5,614 Allocation of
reinsurance premiums paid -195 -130 Adjustment to the insurance contract revenue 13 17 Net insurance contract revenue 5,755 5,500 Insurance claims and benefits -4,562 -4,168 Amounts recoverable from reinsurers 147 87 Adjustment to the insurance claims and benefits 58 17 Adjusted net insurance claims and benefits -4,357 -4,064 Insurance service operating expenses -1,071 -1,061 Of which: Incurred commission
expenses -725 -701 Insurance service operating expenses excluding incurred commission expenses -346 -360 The Non-life combined ratio indicates the insurance related profitability of a non-life insurance contract. To measure the Non-life combined ratio, the insurance service expenses are divided by the insurance contract revenue, considering the operating result definition of those items (see sections 7.4.3 and 7.10) . In 2025, the
adjustment to the net insurance contract revenue (€ 13 million) relates to the impact on the CSM of hedging for pre-recognition interest rate movements. The adjustments to the insurance claims and
benefits (€ 58 million) consist of € 9 million impact of changes of inflation on the liability for incurred claims, € 46 million related to changes to future services on onerous contracts and
€ 3 million impact on the loss component of hedging for pre-recognition interest rate movements. In 2024, the adjustment to the net insurance contract revenue (€ 17 million) relates to
the impact on the CSM of hedging for pre-recognition interest rate movements. The adjustments to the insurance claims and benefits (€ 17 million) consist of € 25 million impact of
changes of inflation on the liability for incurred claims, € -9 million related to changes to future services on onerous contracts and € 1 million impact on the loss component of
hedging for pre-recognition interest rate movements. Financial statements Introduction Consolidated financial statements Accounting policies Group structure and segment information Notes to the consolidated
balance sheet Notes to the consolidated income statement Other notes Risk management Capital management Operating result Company financial statements
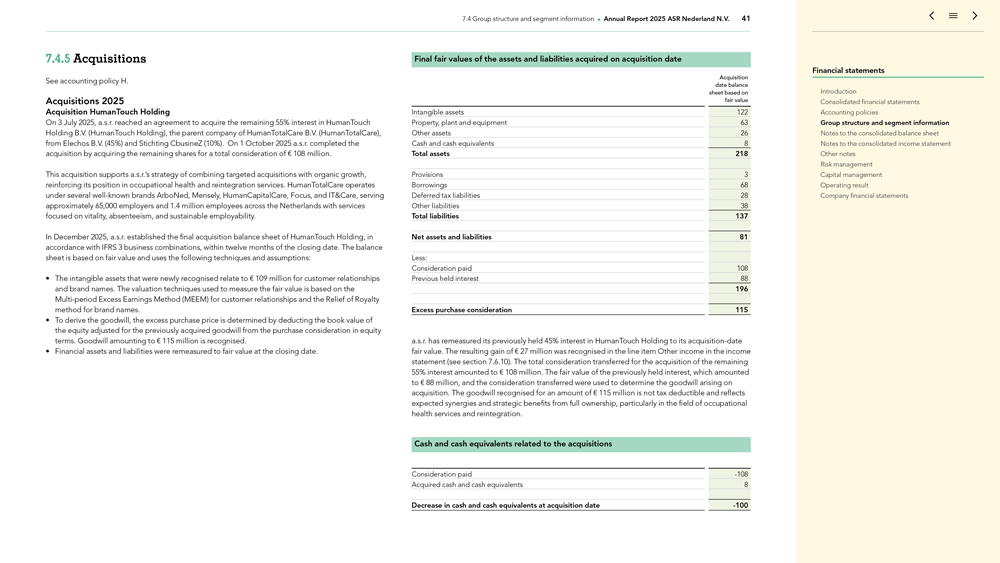
7.4 Group structure and segment information Annual Report 2025 ASR Nederland N.V. 41 7.4.5 Acquisitions See
accounting policy H. Acquisitions 2025 Acquisition HumanTouch Holding On 3 July 2025, a.s.r. reached an agreement to acquire the remaining 55% interest in HumanTouch Holding B.V. (HumanTouch Holding), the parent company of HumanTotalCare B.V.
(HumanTotalCare), from Elechos B.V. (45%) and Stichting CbusineZ (10%). On 1 October 2025 a.s.r. completed the acquisition by acquiring the remaining shares for a total consideration of € 108 million. This acquisition supports
a.s.r.’s strategy of combining targeted acquisitions with organic growth, reinforcing its position in occupational health and reintegration services. HumanTotalCare operates under several well-known brands ArboNed, Mensely, HumanCapitalCare,
Focus, and IT&Care, serving approximately 65,000 employers and 1.4 million employees across the Netherlands with services focused on vitality, absenteeism, and sustainable employability. In December 2025, a.s.r. established the final
acquisition balance sheet of HumanTouch Holding, in accordance with IFRS 3 business combinations, within twelve months of the closing date. The balance sheet is based on fair value and uses the following techniques and assumptions: The intangible
assets that were newly recognised relate to € 109 million for customer relationships and brand names. The valuation techniques used to measure the fair value is based on the Multi-period Excess Earnings Method (MEEM) for customer
relationships and the Relief of Royalty method for brand names. To derive the goodwill, the excess purchase price is determined by deducting the book value of the equity adjusted for the previously acquired goodwill from the purchase consideration
in equity terms. Goodwill amounting to € 115 million is recognised. Financial assets and liabilities were remeasured to fair value at the closing date. Final fair values of the assets and liabilities acquired on acquisition date
Acquisition date balance sheet based on fair value Intangible assets 122 Property, plant and equipment 63 Other assets 26 Cash and cash equivalents 8 Total assets 218 Provisions 3 Borrowings 68 Deferred tax liabilities 28 Other liabilities 38 Total
liabilities 137 Net assets and liabilities 81 Less: Consideration paid 108 Previous held interest 88 196 Excess purchase consideration 115 a.s.r. has remeasured its previously held 45% interest in HumanTouch Holding to its acquisition-date fair
value. The resulting gain of € 27 million was recognised in the line item Other income in the income statement (see section 7.6.10) . The total consideration transferred for the acquisition of the remaining 55% interest amounted to
€ 108 million. The fair value of the previously held interest, which amounted to € 88 million, and the consideration transferred were used to determine the goodwill arising on acquisition. The goodwill recognised for an
amount of € 115 million is not tax deductible and reflects expected synergies and strategic benefits from full ownership, particularly in the field of occupational health services and reintegration. Cash and cash equivalents related
to the acquisitions Consideration paid -108 Acquired cash and cash equivalents 8 Decrease in cash and cash equivalents at acquisition date -100 Financial statements
Introduction Consolidated financial statements Accounting policies Group structure and segment information Notes to the consolidated balance sheet Notes to the consolidated income statement Other notes Risk management Capital management Operating
result Company financial statements
7.4 Group structure and segment information Annual Report 2025 ASR Nederland N.V. 42 From 1 October 2025,
HumanTotalCare has been fully consolidated within the Distribution and Services segment, contributing € 60 million in fee income and € 4 million in net result after tax to a.s.r.’s consolidated results for Q4
2025. Had the acquisition occurred on 1 January 2025, the contribution of HumanTotalCare to fee income and net result after tax would have been € 232 million and € 13 million, respectively. For the previously held
45% interest, an amount of € 4 million is recorded in the line item share of result of associates and joint ventures, representing a.s.r.’s share in the net result of HumanTotalCare for the period 1 January till
30 September 2025. The transaction has had no impact on the employment status of HumanTotalCare’s approximately 2,000 employees (1.428 FTE). No material contingent consideration or indemnification assets were recognised. Other
acquisitions During 2025, a.s.r. acquired several other companies non-material to a.s.r., which became subsidiaries in segment Distribution and Services. Acquisitions 2024 During 2024, a.s.r. acquired eleven
insurance brokerage companies and increased its share in an associate, whereby these acquired entities became subsidiaries in segment Distribution and Services. 7.4.6 Discontinued operations See accounting policy I. On 1 February 2024, a.s.r.
reached an agreement to sell Knab to the BAWAG Group AG. Closing of the transaction took place on 1 November 2024. As of the agreement date, Knab’s activities were classified as discontinued. For further information see the 2024
consolidated financial statements. Financial statements Introduction Consolidated financial statements Accounting policies Group structure and segment information Notes to the consolidated balance sheet Notes to the consolidated income statement
Other notes Risk management Capital management Operating result Company financial statements
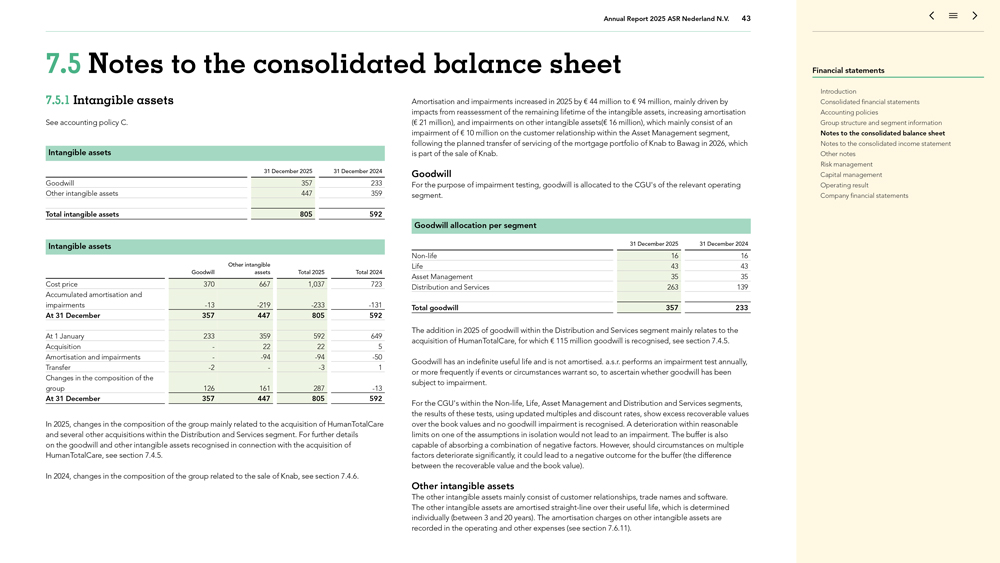
Annual Report 2025 ASR Nederland N.V. 43 7.5 Notes to the consolidated balance sheet 7.5.1 Intangible assets
See accounting policy C. Intangible assets 31 December 2025 31 December 2024 Goodwill 357 233 Other intangible assets 447 359 Total intangible assets 805 592 Intangible assets Other intangible Goodwill assets Total 2025 Total 2024 Cost
price 370 667 1,037 723 Accumulated amortisation and impairments -13 -219 -233 -131 At
31 December 357 447 805 592 At 1 January 233 359 592 649 Acquisition—22 22 5 Amortisation and impairments—-94 -94
-50 Transfer -2—-3 1 Changes in the composition of the group 126 161 287 -13 At
31 December 357 447 805 592 In 2025, changes in the composition of the group mainly related to the acquisition of HumanTotalCare and several other acquisitions within the Distribution and Services segment. For further details on the goodwill
and other intangible assets recognised in connection with the acquisition of HumanTotalCare, see section 7.4.5. In 2024, changes in the composition of the group related to the sale of Knab, see section 7.4.6. Amortisation and impairments increased
in 2025 by € 44 million to € 94 million, mainly driven by impacts from reassessment of the remaining lifetime of the intangible assets, increasing amortisation (€ 21 million), and impairments on other
intangible assets(€ 16 million), which mainly consist of an impairment of € 10 million on the customer relationship within the Asset Management segment, following the planned transfer of servicing of the mortgage portfolio
of Knab to Bawag in 2026, which is part of the sale of Knab. Goodwill For the purpose of impairment testing, goodwill is allocated to the CGU’s of the relevant operating segment. Goodwill allocation per segment 31 December 2025
31 December 2024 Non-life 16 16 Life 43 43 Asset Management 35 35 Distribution and Services 263 139 Total goodwill 357 233 The addition in 2025 of goodwill within the Distribution and Services segment
mainly relates to the acquisition of HumanTotalCare, for which € 115 million goodwill is recognised, see section 7.4.5. Goodwill has an indefinite useful life and is not amortised. a.s.r. performs an impairment test annually, or more
frequently if events or circumstances warrant so, to ascertain whether goodwill has been subject to impairment. For the CGU’s within the Non-life, Life, Asset Management and Distribution and Services
segments, the results of these tests, using updated multiples and discount rates, show excess recoverable values over the book values and no goodwill impairment is recognised. A deterioration within reasonable limits on one of the assumptions in
isolation would not lead to an impairment. The buffer is also capable of absorbing a combination of negative factors. However, should circumstances on multiple factors deteriorate significantly, it could lead to a negative outcome for the buffer
(the difference between the recoverable value and the book value). Other intangible assets The other intangible assets mainly consist of customer relationships, trade names and software. The other intangible assets are amortised straight-line over
their useful life, which is determined individually (between 3 and 20 years). The amortisation charges on other intangible assets are recorded in the operating and other expenses (see section 7.6.11) . Financial statements Introduction Consolidated
financial statements Accounting policies Group structure and segment information Notes to the consolidated balance sheet Notes to the consolidated income statement Other notes Risk management Capital management Operating result Company financial
statements
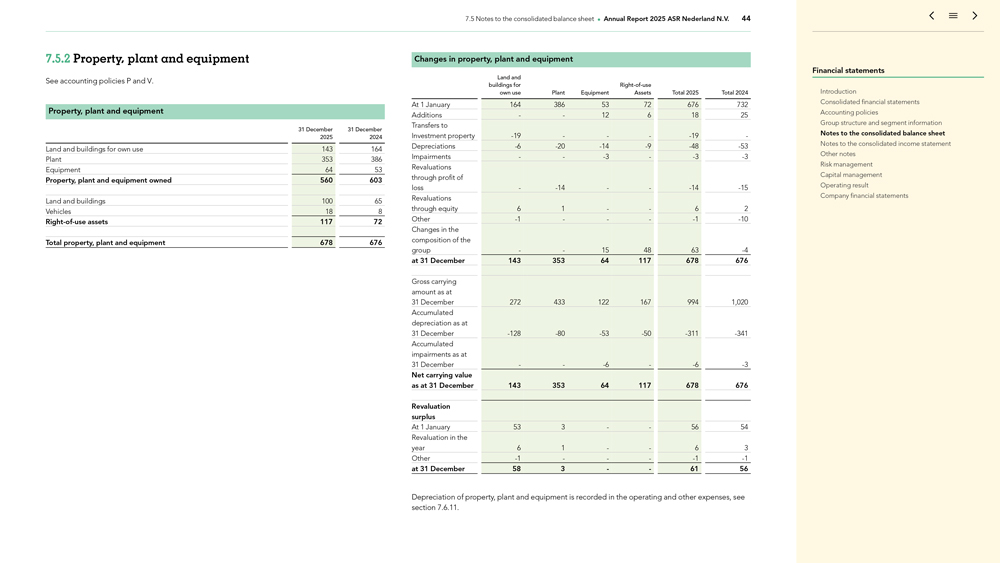
7.5 Notes to the consolidated balance sheet Annual Report 2025 ASR Nederland N.V. 44 7.5.2 Property, plant and
equipment See accounting policies P and V. Property, plant and equipment 31 December 31 December 2025 2024 Land and buildings for own use 143 164 Plant 353 386 Equipment 64 53 Property, plant and equipment owned 560 603 Land and buildings
100 65 Vehicles 18 8 Right-of-use assets 117 72 Total property, plant and equipment 678 676 Changes in property, plant and equipment Land and buildings for Right-of-use own use Plant Equipment Assets Total 2025 Total 2024 At 1 January 164 386 53 72 676 732 Additions — 12 6 18 25 Transfers to Investment property -19 ——-19 -Depreciations -6 -20 -14 -9 -48 -53 Impairments — -3—-3 -3 Revaluations through profit of loss—-14 — -14 -15 Revaluations through equity 6
1 — 6 2 Other -1 ——-1 -10 Changes in the composition of the group — 15 48 63 -4 at 31 December 143 353 64 117 678 676 Gross carrying amount as at 31 December 272 433 122 167 994 1,020 Accumulated depreciation as at 31 December -128 -80 -53 -50 -311 -341 Accumulated impairments as at
31 December — -6—-6 -3 Net carrying value as at 31 December 143 353 64 117 678 676 Revaluation surplus At
1 January 53 3 — 56 54 Revaluation in the year 6 1 — 6 3 Other -1 ——-1 -1 at 31 December 58 3
— 61 56 Depreciation of property, plant and equipment is recorded in the operating and other expenses, see section 7.6.11. Financial statements Introduction Consolidated financial statements Accounting policies Group structure and segment
information Notes to the consolidated balance sheet Notes to the consolidated income statement Other notes Risk management Capital management Operating result Company financial statements
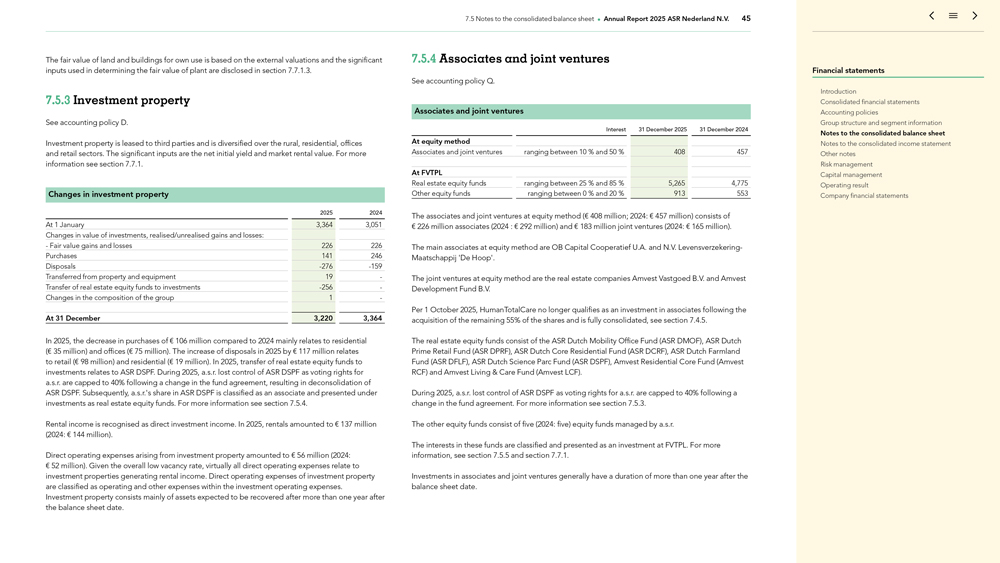
7.5 Notes to the consolidated balance sheet Annual Report 2025 ASR Nederland N.V. 45 The fair value of land and
buildings for own use is based on the external valuations and the significant inputs used in determining the fair value of plant are disclosed in section 7.7.1.3. 7.5.3 Investment property See accounting policy D. Investment property is leased to
third parties and is diversified over the rural, residential, offices and retail sectors. The significant inputs are the net initial yield and market rental value. For more information see section 7.7.1. Changes in investment property 2025 2024 At 1
January 3,364 3,051 Changes in value of investments, realised/unrealised gains and losses:—Fair value gains and losses 226 226 Purchases 141 246 Disposals -276
-159 Transferred from property and equipment 19 -Transfer of real estate equity funds to investments -256 -Changes in the composition of the group 1— At
31 December 3,220 3,364 In 2025, the decrease in purchases of € 106 million compared to 2024 mainly relates to residential (€ 35 million) and offices (€ 75 million). The increase of disposals in 2025 by
€ 117 million relates to retail (€ 98 million) and residential (€ 19 million). In 2025, transfer of real estate equity funds to investments relates to ASR DSPF. During 2025, a.s.r. lost control of ASR DSPF as
voting rights for a.s.r. are capped to 40% following a change in the fund agreement, resulting in deconsolidation of ASR DSPF. Subsequently, a.s.r.’s share in ASR DSPF is classified as an associate and presented under investments as real
estate equity funds. For more information see section 7.5.4. Rental income is recognised as direct investment income. In 2025, rentals amounted to € 137 million (2024: € 144 million). Direct operating expenses arising from
investment property amounted to € 56 million (2024: € 52 million). Given the overall low vacancy rate, virtually all direct operating expenses relate to investment properties generating rental income. Direct operating
expenses of investment property are classified as operating and other expenses within the investment operating expenses. Investment property consists mainly of assets expected to be recovered after more than one year after the balance sheet date.
7.5.4 Associates and joint ventures See accounting policy Q. Associates and joint ventures Interest 31 December 2025 31 December 2024 At equity method Associates and joint ventures ranging between 10 % and 50 % 408 457 At FVTPL
Real estate equity funds ranging between 25 % and 85 % 5,265 4,775 Other equity funds ranging between 0 % and 20 % 913 553 The associates and joint ventures at equity method (€ 408 million; 2024: € 457
million) consists of € 226 million associates (2024 : € 292 million) and € 183 million joint ventures (2024: € 165 million). The main associates at equity method are OB Capital Cooperatief U.A. and
N.V. Levensverzekering-Maatschappij ‘De Hoop’. The joint ventures at equity method are the real estate companies Amvest Vastgoed B.V. and Amvest Development Fund B.V. Per 1 October 2025, HumanTotalCare no longer qualifies as an
investment in associates following the acquisition of the remaining 55% of the shares and is fully consolidated, see section 7.4.5. The real estate equity funds consist of the ASR Dutch Mobility Office Fund (ASR DMOF), ASR Dutch Prime Retail Fund
(ASR DPRF), ASR Dutch Core Residential Fund (ASR DCRF), ASR Dutch Farmland Fund (ASR DFLF), ASR Dutch Science Parc Fund (ASR DSPF), Amvest Residential Core Fund (Amvest RCF) and Amvest Living & Care Fund (Amvest LCF). During 2025, a.s.r.
lost control of ASR DSPF as voting rights for a.s.r. are capped to 40% following a change in the fund agreement. For more information see section 7.5.3. The other equity funds consist of five (2024: five) equity funds managed by a.s.r. The interests
in these funds are classified and presented as an investment at FVTPL. For more information, see section 7.5.5 and section 7.7.1. Investments in associates and joint ventures generally have a duration of more than one year after the balance sheet
date. Financial statements Introduction Consolidated financial statements Accounting policies Group structure and segment information Notes to the consolidated balance sheet Notes to the consolidated income statement Other notes Risk management
Capital management Operating result Company financial statements
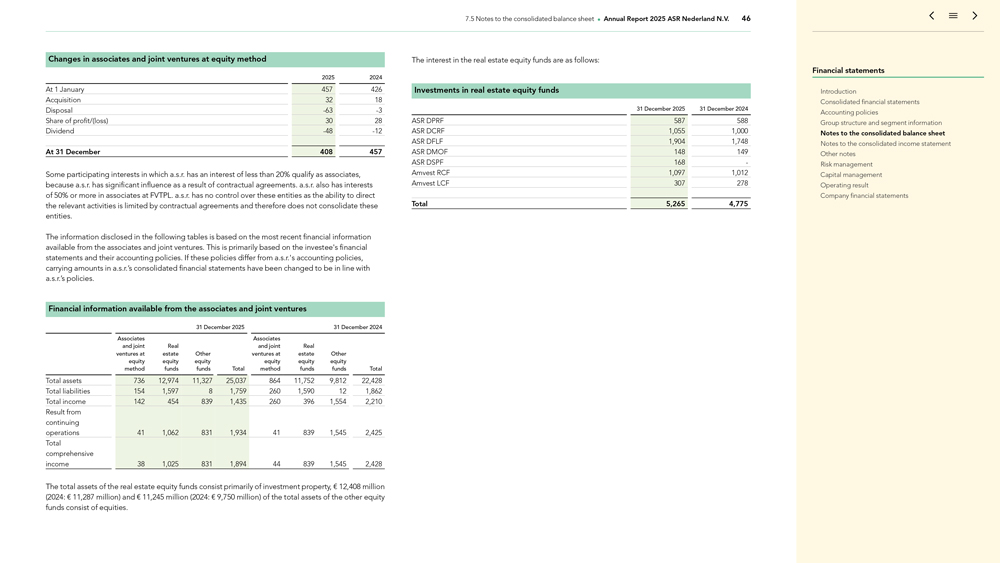
7.5 Notes to the consolidated balance sheet Annual Report 2025 ASR Nederland N.V. 46 Changes in associates and
joint ventures at equity method 2025 2024 At 1 January 457 426 Acquisition 32 18 Disposal -63 -3 Share of profit/(loss) 30 28 Dividend -48 -12 At 31 December 408 457 Some participating interests in which a.s.r. has an interest of less than 20% qualify as associates, because a.s.r. has significant
influence as a result of contractual agreements. a.s.r. also has interests of 50% or more in associates at FVTPL. a.s.r. has no control over these entities as the ability to direct the relevant activities is limited by contractual agreements and
therefore does not consolidate these entities. The information disclosed in the following tables is based on the most recent financial information available from the associates and joint ventures. This is primarily based on the investee’s
financial statements and their accounting policies. If these policies differ from a.s.r.’s accounting policies, carrying amounts in a.s.r.’s consolidated financial statements have been changed to be in line with a.s.r.’s policies.
Financial information available from the associates and joint ventures 31 December 2025 31 December 2024 Associates Associates and joint Real and joint Real ventures at estate Other ventures at estate Other equity equity equity equity
equity equity method funds funds Total method funds funds Total Total assets 736 12,974 11,327 25,037 864 11,752 9,812 22,428 Total liabilities 154 1,597 8 1,759 260 1,590 12 1,862 Total income 142 454 839 1,435 260 396 1,554 2,210 Result from
continuing operations 41 1,062 831 1,934 41 839 1,545 2,425 Total comprehensive income 38 1,025 831 1,894 44 839 1,545 2,428 The total assets of the real estate equity funds consist primarily of investment property, € 12,408 million
(2024: € 11,287 million) and € 11,245 million (2024: € 9,750 million) of the total assets of the other equity funds consist of equities. The interest in the real estate equity funds are as follows: Investments in
real estate equity funds 31 December 2025 31 December 2024 ASR DPRF 587 588 ASR DCRF 1,055 1,000 ASR DFLF 1,904 1,748 ASR DMOF 148 149 ASR DSPF 168 -Amvest RCF 1,097 1,012 Amvest LCF 307 278 Total 5,265 4,775 Financial statements
Introduction Consolidated financial statements Accounting policies Group structure and segment information Notes to the consolidated balance sheet Notes to the consolidated income statement Other notes Risk management Capital management Operating
result Company financial statements
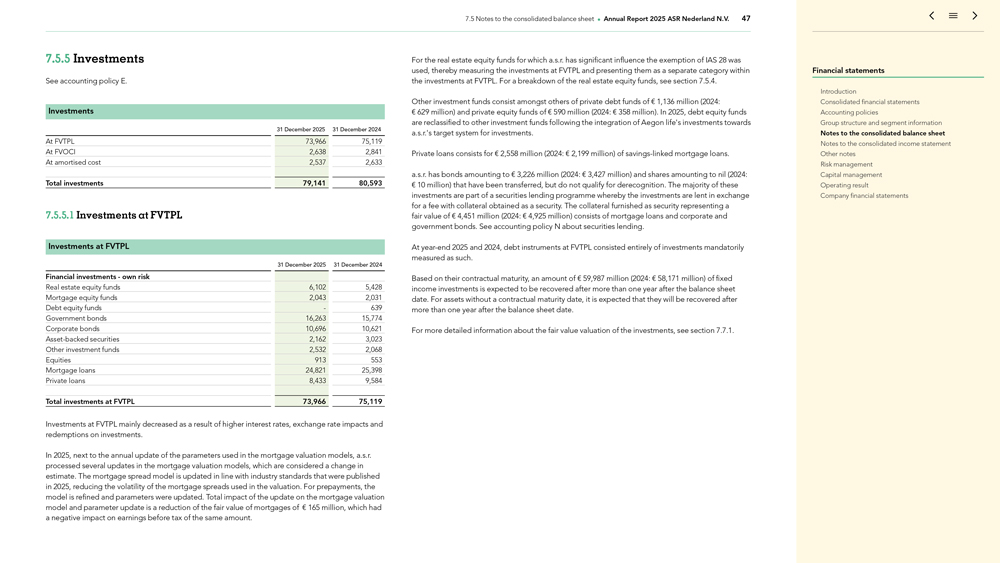
7.5 Notes to the consolidated balance sheet Annual Report 2025 ASR Nederland N.V. 47 7.5.5 Investments See
accounting policy E. Investments 31 December 2025 31 December 2024 At FVTPL 73,966 75,119 At FVOCI 2,638 2,841 At amortised cost 2,537 2,633 Total investments 79,141 80,593 7.5.5.1 Investments at FVTPL Investments at FVTPL 31 December
2025 31 December 2024 Financial investments—own risk Real estate equity funds 6,102 5,428 Mortgage equity funds 2,043 2,031 Debt equity funds—639 Government bonds 16,263 15,774 Corporate bonds 10,696 10,621 Asset-backed securities
2,162 3,023 Other investment funds 2,532 2,068 Equities 913 553 Mortgage loans 24,821 25,398 Private loans 8,433 9,584 Total investments at FVTPL 73,966 75,119 Investments at FVTPL mainly decreased as a result of higher interest rates, exchange rate
impacts and redemptions on investments. In 2025, next to the annual update of the parameters used in the mortgage valuation models, a.s.r. processed several updates in the mortgage valuation models, which are considered a change in estimate. The
mortgage spread model is updated in line with industry standards that were published in 2025, reducing the volatility of the mortgage spreads used in the valuation. For prepayments, the model is refined and parameters were updated. Total impact of
the update on the mortgage valuation model and parameter update is a reduction of the fair value of mortgages of € 165 million, which had a negative impact on earnings before tax of the same amount. For the real estate equity
funds for which a.s.r. has significant influence the exemption of IAS 28 was used, thereby measuring the investments at FVTPL and presenting them as a separate category within the investments at FVTPL. For a breakdown of the real estate equity
funds, see section 7.5.4. Other investment funds consist amongst others of private debt funds of € 1,136 million (2024: € 629 million) and private equity funds of € 590 million (2024: € 358 million).
In 2025, debt equity funds are reclassified to other investment funds following the integration of Aegon life’s investments towards a.s.r.’s target system for investments. Private loans consists for € 2,558 million (2024:
€ 2,199 million) of savings-linked mortgage loans. a.s.r. has bonds amounting to € 3,226 million (2024: € 3,427 million) and shares amounting to nil (2024: € 10 million) that have been transferred, but do
not qualify for derecognition. The majority of these investments are part of a securities lending programme whereby the investments are lent in exchange for a fee with collateral obtained as a security. The collateral furnished as security
representing a fair value of € 4,451 million (2024: € 4,925 million) consists of mortgage loans and corporate and government bonds. See accounting policy N about securities lending. At
year-end 2025 and 2024, debt instruments at FVTPL consisted entirely of investments mandatorily measured as such. Based on their contractual maturity, an amount of € 59,987 million (2024:
€ 58,171 million) of fixed income investments is expected to be recovered after more than one year after the balance sheet date. For assets without a contractual maturity date, it is expected that they will be recovered after more than one
year after the balance sheet date. For more detailed information about the fair value valuation of the investments, see section 7.7.1. Financial statements Introduction Consolidated financial statements Accounting policies Group structure and
segment information Notes to the consolidated balance sheet Notes to the consolidated income statement Other notes Risk management Capital management Operating result Company financial statements
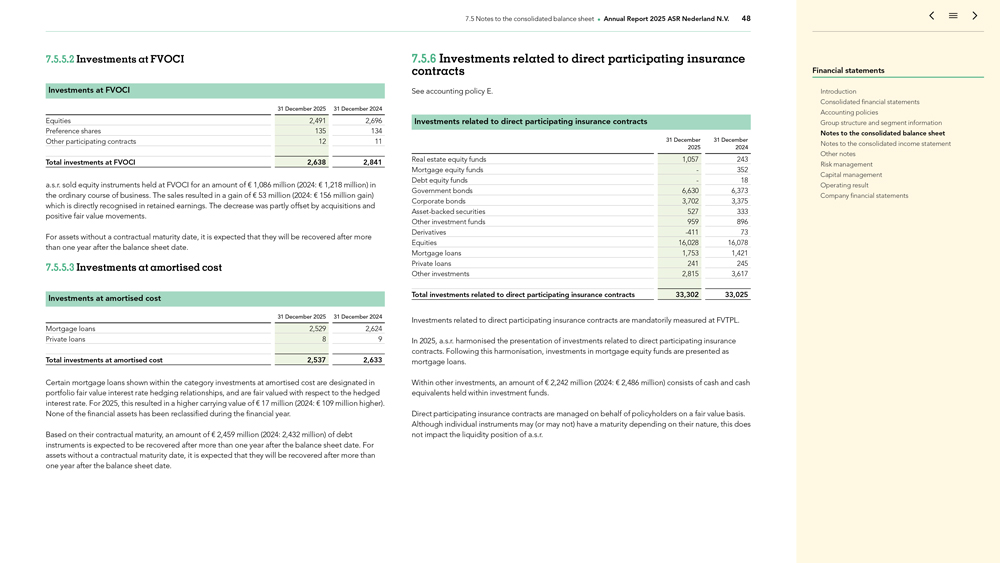
7.5 Notes to the consolidated balance sheet Annual Report 2025 ASR Nederland N.V. 48 7.5.5.2 Investments at
FVOCI Investments at FVOCI 31 December 2025 31 December 2024 Equities 2,491 2,696 Preference shares 135 134 Other participating contracts 12 11 Total investments at FVOCI 2,638 2,841 a.s.r. sold equity instruments held at FVOCI for an
amount of € 1,086 million (2024: € 1,218 million) in the ordinary course of business. The sales resulted in a gain of € 53 million (2024: € 156 million gain) which is directly recognised in
retained earnings. The decrease was partly offset by acquisitions and positive fair value movements. For assets without a contractual maturity date, it is expected that they will be recovered after more than one year after the balance sheet date.
7.5.5.3 Investments at amortised cost Investments at amortised cost 31 December 2025 31 December 2024 Mortgage loans 2,529 2,624 Private loans 8 9 Total investments at amortised cost 2,537 2,633 Certain mortgage loans shown within the
category investments at amortised cost are designated in portfolio fair value interest rate hedging relationships, and are fair valued with respect to the hedged interest rate. For 2025, this resulted in a higher carrying value of
€ 17 million (2024: € 109 million higher). None of the financial assets has been reclassified during the financial year. Based on their contractual maturity, an amount of € 2,459 million (2024: 2,432
million) of debt instruments is expected to be recovered after more than one year after the balance sheet date. For assets without a contractual maturity date, it is expected that they will be recovered after more than one year after the balance
sheet date. 7.5.6 contracts Investments related to direct participating insurance See accounting policy E. Investments related to direct participating insurance contracts 31 December 31 December 2025 2024 Real estate equity funds 1,057 243
Mortgage equity funds—352 Debt equity funds—18 Government bonds 6,630 6,373 Corporate bonds 3,702 3,375 Asset-backed securities 527 333 Other investment funds 959 896 Derivatives -411 73 Equities
16,028 16,078 Mortgage loans 1,753 1,421 Private loans 241 245 Other investments 2,815 3,617 Total investments related to direct participating insurance contracts 33,302 33,025 Investments related to direct participating insurance contracts are
mandatorily measured at FVTPL. In 2025, a.s.r. harmonised the presentation of investments related to direct participating insurance contracts. Following this harmonisation, investments in mortgage equity funds are presented as mortgage loans. Within
other investments, an amount of € 2,242 million (2024: € 2,486 million) consists of cash and cash equivalents held within investment funds. Direct participating insurance contracts are managed on behalf of policyholders on a
fair value basis. Although individual instruments may (or may not) have a maturity depending on their nature, this does not impact the liquidity position of a.s.r. Financial statements Introduction Consolidated financial statements Accounting
policies Group structure and segment information Notes to the consolidated balance sheet Notes to the consolidated income statement Other notes Risk management Capital management Operating result Company financial statements
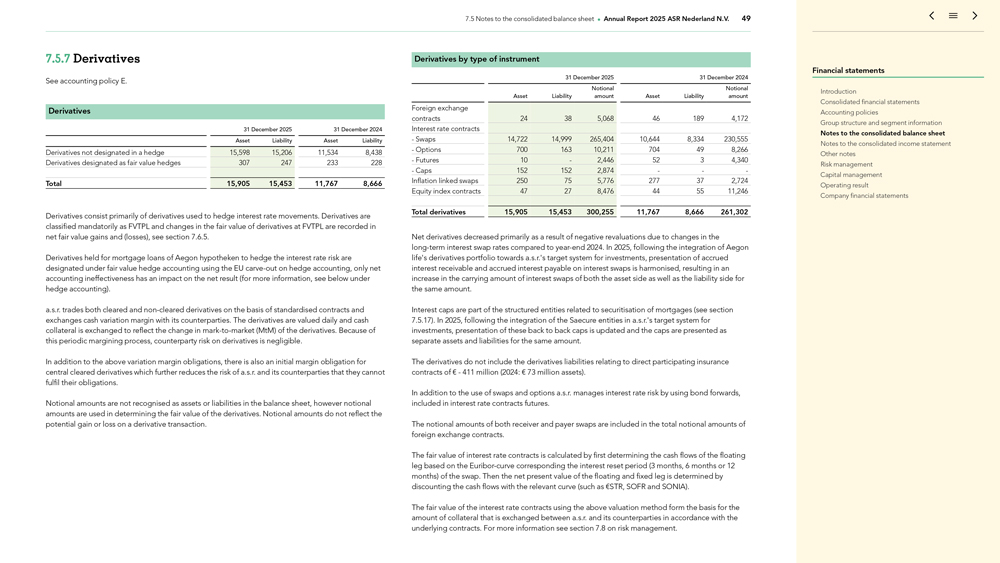
7.5 Notes to the consolidated balance sheet Annual Report 2025 ASR Nederland N.V. 49 7.5.7 Derivatives See
accounting policy E. Derivatives 31 December 2025 31 December 2024 Asset Liability Asset Liability Derivatives not designated in a hedge 15,598 15,206 11,534 8,438 Derivatives designated as fair value hedges 307 247 233 228 Total 15,905
15,453 11,767 8,666 Derivatives consist primarily of derivatives used to hedge interest rate movements. Derivatives are classified mandatorily as FVTPL and changes in the fair value of derivatives at FVTPL are recorded in net fair value gains and
(losses), see section 7.6.5. Derivatives held for mortgage loans of Aegon hypotheken to hedge the interest rate risk are designated under fair value hedge accounting using the EU carve-out on hedge accounting,
only net accounting ineffectiveness has an impact on the net result (for more information, see below under hedge accounting). a.s.r. trades both cleared and non-cleared derivatives on the basis of standardised
contracts and exchanges cash variation margin with its counterparties. The derivatives are valued daily and cash collateral is exchanged to reflect the change in
mark-to-market (MtM) of the derivatives. Because of this periodic margining process, counterparty risk on derivatives is negligible. In addition to the above variation
margin obligations, there is also an initial margin obligation for central cleared derivatives which further reduces the risk of a.s.r. and its counterparties that they cannot fulfil their obligations. Notional amounts are not recognised as assets
or liabilities in the balance sheet, however notional amounts are used in determining the fair value of the derivatives. Notional amounts do not reflect the potential gain or loss on a derivative transaction. Derivatives by type of instrument
31 December 2025 31 December 2024 Notional Notional Asset Liability amount Asset Liability amount Foreign exchange contracts 24 38 5,068 46 189 4,172 Interest rate contracts—Swaps 14,722 14,999 265,404 10,644 8,334
230,555—Options 700 163 10,211 704 49 8,266—Futures 10—2,446 52 3 4,340—Caps 152 152 2,874 — -Inflation linked swaps 250 75 5,776 277 37 2,724 Equity index contracts 47 27 8,476 44 55 11,246 Total derivatives 15,905
15,453 300,255 11,767 8,666 261,302 Net derivatives decreased primarily as a result of negative revaluations due to changes in the long-term interest swap rates compared to year-end 2024. In 2025, following
the integration of Aegon life’s derivatives portfolio towards a.s.r.’s target system for investments, presentation of accrued interest receivable and accrued interest payable on interest swaps is harmonised, resulting in an increase in
the carrying amount of interest swaps of both the asset side as well as the liability side for the same amount. Interest caps are part of the structured entities related to securitisation of mortgages (see section 7.5.17) . In 2025, following the
integration of the Saecure entities in a.s.r.’s target system for investments, presentation of these back to back caps is updated and the caps are presented as separate assets and liabilities for the same amount. The derivatives do not include
the derivatives liabilities relating to direct participating insurance contracts of €—411 million (2024: € 73 million assets). In addition to the use of swaps and options a.s.r. manages interest rate risk by using bond
forwards, included in interest rate contracts futures. The notional amounts of both receiver and payer swaps are included in the total notional amounts of foreign exchange contracts. The fair value of interest rate contracts is calculated by first
determining the cash flows of the floating leg based on the Euribor-curve corresponding the interest reset period (3 months, 6 months or 12 months) of the swap. Then the net present value of the floating and fixed leg is determined by discounting
the cash flows with the relevant curve (such as €STR, SOFR and SONIA). The fair value of the interest rate contracts using the above valuation method form the basis for the amount of collateral that is exchanged between a.s.r. and its
counterparties in accordance with the underlying contracts. For more information see section 7.8 on risk management. Financial statements Introduction Consolidated financial statements Accounting policies Group structure and segment information
Notes to the consolidated balance sheet Notes to the consolidated income statement Other notes Risk management Capital management Operating result Company financial statements
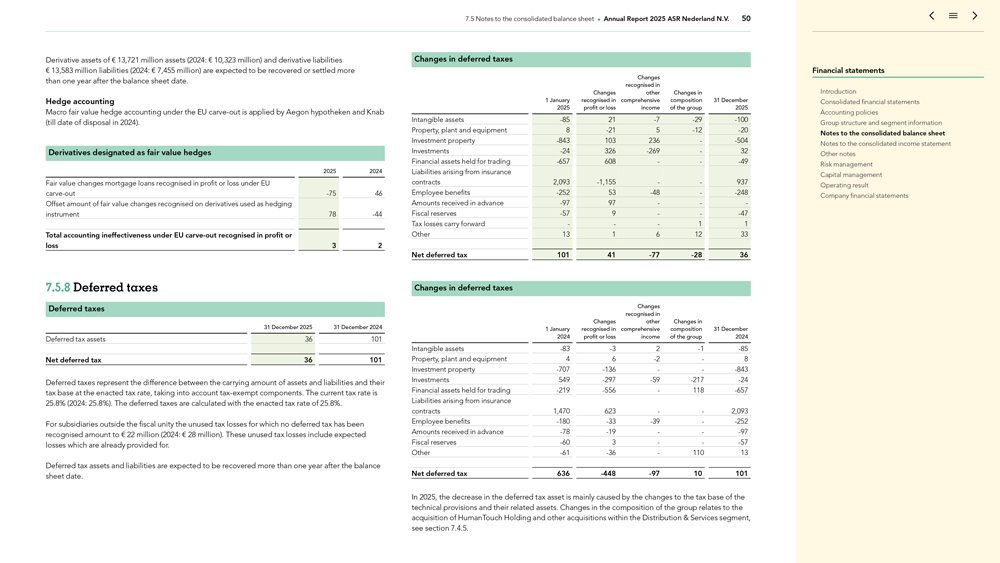
7.5 Notes to the consolidated balance sheet Annual Report 2025 ASR Nederland N.V. 50 Derivative assets of
€ 13,721 million assets (2024: € 10,323 million) and derivative liabilities € 13,583 million liabilities (2024: € 7,455 million) are expected to be recovered or settled more than one year after the
balance sheet date. Hedge accounting Macro fair value hedge accounting under the EU carve-out is applied by Aegon hypotheken and Knab (till date of disposal in 2024). Derivatives designated as fair value
hedges 2025 2024 Fair value changes mortgage loans recognised in profit or loss under EU carve-out -75 46 Offset amount of fair value changes recognised on derivatives
used as hedging instrument 78 -44 Total accounting ineffectiveness under EU carve-out recognised in profit or loss 3 2 7.5.8 Deferred taxes Deferred taxes
31 December 2025 31 December 2024 Deferred tax assets 36 101 Net deferred tax 36 101 Deferred taxes represent the difference between the carrying amount of assets and liabilities and their tax base at the enacted tax rate, taking into
account tax-exempt components. The current tax rate is 25.8% (2024: 25.8%) . The deferred taxes are calculated with the enacted tax rate of 25.8% . For subsidiaries outside the fiscal unity the unused tax
losses for which no deferred tax has been recognised amount to € 22 million (2024: € 28 million). These unused tax losses include expected losses which are already provided for. Deferred tax assets and liabilities are
expected to be recovered more than one year after the balance sheet date. Changes in deferred taxes Changes recognised in Changes other Changes in 1 January recognised in comprehensive composition 31 December 2025 profit or loss income of
the group 2025 Intangible assets -85 21 -7 -29 -100 Property, plant and equipment 8 -21 5 -12 -20 Investment property -843 103
236—-504 Investments -24 326 -269—32 Financial assets held for trading -657
608 — -49 Liabilities arising from insurance contracts 2,093 -1,155 — 937 Employee benefits -252 53 -48—-248 Amounts received in advance -97 97 — -Fiscal reserves -57 9 — -47 Tax losses carry forward ——1 1 Other 13 1 6 12 33 Net deferred tax 101 41 -77 -28 36 Changes in deferred taxes Changes
recognised in Changes other Changes in 1 January recognised in comprehensive composition 31 December 2024 profit or loss income of the group 2024 Intangible assets -83
-3 2 -1 -85 Property, plant and equipment 4 6 -2—8 Investment property -707 -136 — -843 Investments 549 -297 -59 -217 -24 Financial assets held for trading -219 -556—118
-657 Liabilities arising from insurance contracts 1,470 623 — 2,093 Employee benefits -180 -33 -39—-252 Amounts received in advance -78 -19 —
-97 Fiscal reserves -60 3 — -57 Other -61
-36—110 13 Net deferred tax 636 -448 -97 10 101 In 2025, the decrease in the deferred tax asset is mainly caused by the
changes to the tax base of the technical provisions and their related assets. Changes in the composition of the group relates to the acquisition of HumanTouch Holding and other acquisitions within the Distribution & Services segment, see
section 7.4.5. Financial statements Introduction Consolidated financial statements Accounting policies Group structure and segment information Notes to the consolidated balance sheet Notes to the consolidated income statement Other notes Risk
management Capital management Operating result Company financial statements
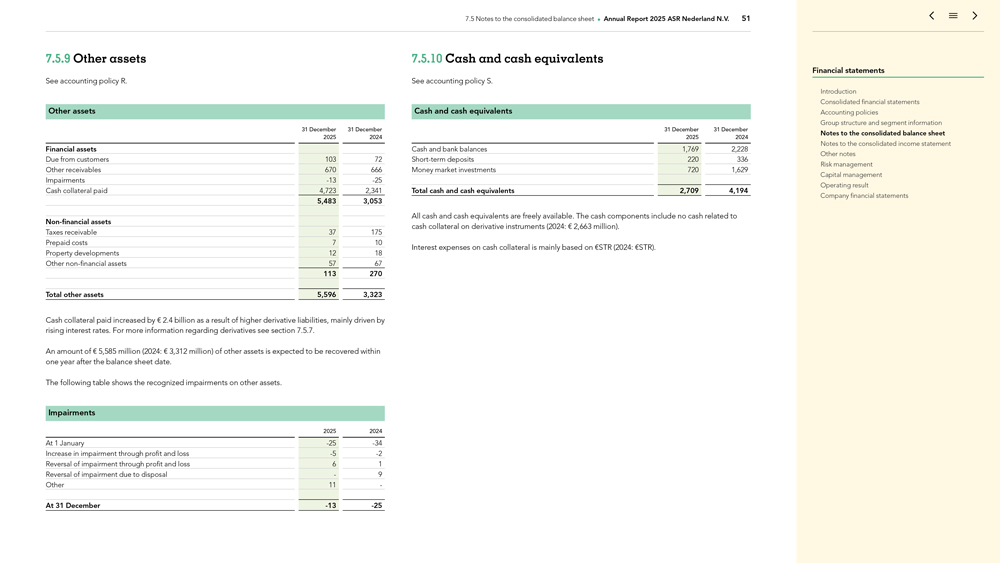
7.5 Notes to the consolidated balance sheet Annual Report 2025 ASR Nederland N.V. 51 7.5.9 Other assets See
accounting policy R. Other assets 31 December 31 December 2025 2024 Financial assets Due from customers 103 72 Other receivables 670 666 Impairments -13 -25
Cash collateral paid 4,723 2,341 5,483 3,053 Non-financial assets Taxes receivable 37 175 Prepaid costs 7 10 Property developments 12 18 Other non-financial assets 57 67
113 270 Total other assets 5,596 3,323 Cash collateral paid increased by € 2.4 billion as a result of higher derivative liabilities, mainly driven by rising interest rates. For more information regarding derivatives see section 7.5.7.
An amount of € 5,585 million (2024: € 3,312 million) of other assets is expected to be recovered within one year after the balance sheet date. The following table shows the recognized impairments on other assets. Impairments
2025 2024 At 1 January -25 -34 Increase in impairment through profit and loss -5 -2
Reversal of impairment through profit and loss 6 1 Reversal of impairment due to disposal—9 Other 11— At 31 December -13 -25 7.5.10 Cash and cash
equivalents See accounting policy S. Cash and cash equivalents 31 December 31 December 2025 2024 Cash and bank balances 1,769 2,228 Short-term deposits 220 336 Money market investments 720 1,629 Total cash and cash equivalents 2,709 4,194
All cash and cash equivalents are freely available. The cash components include no cash related to cash collateral on derivative instruments (2024: € 2,663 million). Interest expenses on cash collateral is mainly based on €STR (2024:
€STR). Financial statements Introduction Consolidated financial statements Accounting policies Group structure and segment information Notes to the consolidated balance sheet Notes to the consolidated income statement Other notes Risk
management Capital management Operating result Company financial statements
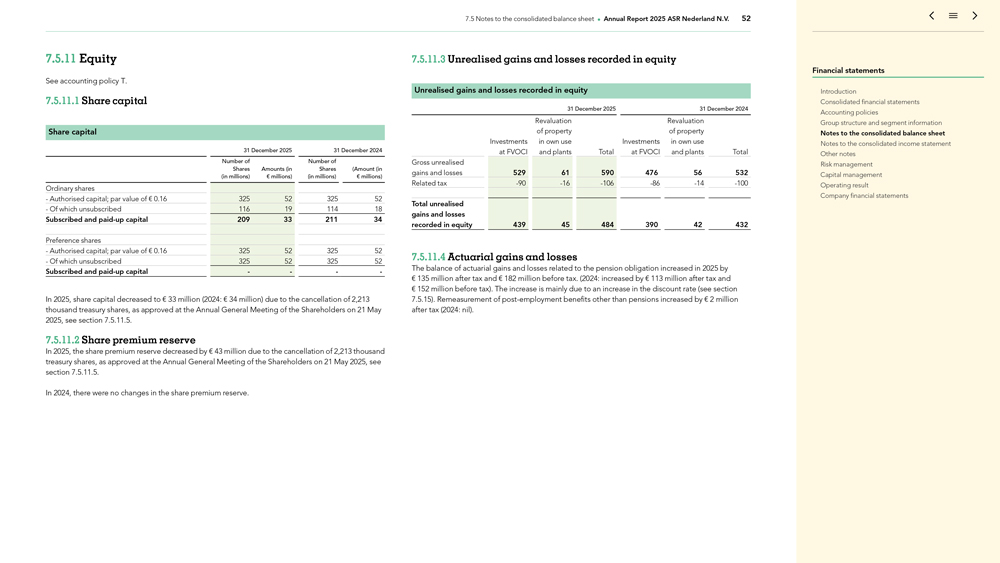
7.5 Notes to the consolidated balance sheet Annual Report 2025 ASR Nederland N.V. 52 7.5.11 Equity See
accounting policy T. 7.5.11.1 Share capital Share capital 31 December 2025 31 December 2024 Number of Number of Shares Amounts (in Shares (Amount (in (in millions) € millions) (in millions) € millions) Ordinary shares
—Authorised capital; par value of € 0.16 325 52 325 52—Of which unsubscribed 116 19 114 18 Subscribed and paid-up capital 209 33 211 34 Preference shares —Authorised capital; par
value of € 0.16 325 52 325 52—Of which unsubscribed 325 52 325 52 Subscribed and paid-up capital — — In 2025, share capital decreased to € 33 million (2024:
€ 34 million) due to the cancellation of 2,213 thousand treasury shares, as approved at the Annual General Meeting of the Shareholders on 21 May 2025, see section 7.5.11.5. 7.5.11.2 Share premium reserve In 2025, the share
premium reserve decreased by € 43 million due to the cancellation of 2,213 thousand treasury shares, as approved at the Annual General Meeting of the Shareholders on 21 May 2025, see section 7.5.11.5. In 2024, there were no
changes in the share premium reserve. 7.5.11.3 Unrealised gains and losses recorded in equity Unrealised gains and losses recorded in equity 31 December 2025 31 December 2024 Revaluation Revaluation of property of property Investments in
own use Investments in own use at FVOCI and plants Total at FVOCI and plants Total Gross unrealised gains and losses 529 61 590 476 56 532 Related tax -90 -16 -106 -86 -14 -100 Total unrealised gains and losses recorded in equity 439 45 484 390 42 432
7.5.11.4 Actuarial gains and losses The balance of actuarial gains and losses related to the pension obligation increased in 2025 by € 135 million after tax and € 182 million before tax. (2024: increased by
€ 113 million after tax and € 152 million before tax). The increase is mainly due to an increase in the discount rate (see section 7.5.15) . Remeasurement of post-employment benefits other than pensions increased by
€ 2 million after tax (2024: nil). Financial statements Introduction Consolidated financial statements Accounting policies Group structure and segment information Notes to the consolidated balance sheet Notes to the consolidated
income statement Other notes Risk management Capital management Operating result Company financial statements
7.5 Notes to the consolidated balance sheet Annual Report 2025 ASR Nederland N.V. 53 7.5.11.5 Treasury shares
In February 2025, a.s.r. announced a share buyback programme for the amount of € 125 million. The repurchase was completed on May 6, 2025. Therefore, during the period from 20 February 2025 through 6 May 2025, a.s.r.
repurchased 2,404 thousand shares under an open market share buyback programme for an amount of € 125 million (average share price € 52.00) . In the Annual General Meeting of the Shareholders on 21 May 2025 the
resolution was adopted to cancel 2,213 thousand shares which were acquired in 2024. The cancellation was effected in July 2025. In 2024, no shares were cancelled. In June 2025, a.s.r. announced a share buyback programme for 300 thousand
shares related to the employee share purchase plan. Therefore, during the period from 16 June 2025 through 16 July 2025, a.s.r. repurchased 300 thousand shares under an open market share buyback programme for an amount of
€ 17 million (average share price € 55.91) .The repurchase was completed on July 16, 2025. In September 2025, a.s.r. participated in the partial selldown of Aegon Ltd.’s position in a.s.r. a.s.r. repurchased
1,875 thousand shares related to the accelerated bookbuild of Aegon Ltd. for an amount of € 105 million (average share price € 56.00), see section 7.7.4. a.s.r.’s participation in this first selldown by Aegon Ltd.
is supplementary to a.s.r.’s existing share buyback program of € 525 million for the 2024-2026 plan period. a.s.r. will seek approval from the General Meeting of Shareholders on 20 May 2026 to cancel the repurchased shares.
As part of the employee share purchase plan a.s.r. sold 235 thousand shares (2024: 268 thousand shares) for an amount of € 11 million (2024: € 9 million). For more information on the employee share purchase plan,
see section 7.7.6. The amount of treasury shares held at year-end of € 245 million (2024: € 109 million) represents 4,555 thousand treasury shares (2024: 2,425 thousand).
Financial statements Introduction Consolidated financial statements Accounting policies Group structure and segment information Notes to the consolidated balance sheet Notes to the consolidated income statement Other notes Risk management Capital
management Operating result Company financial statements
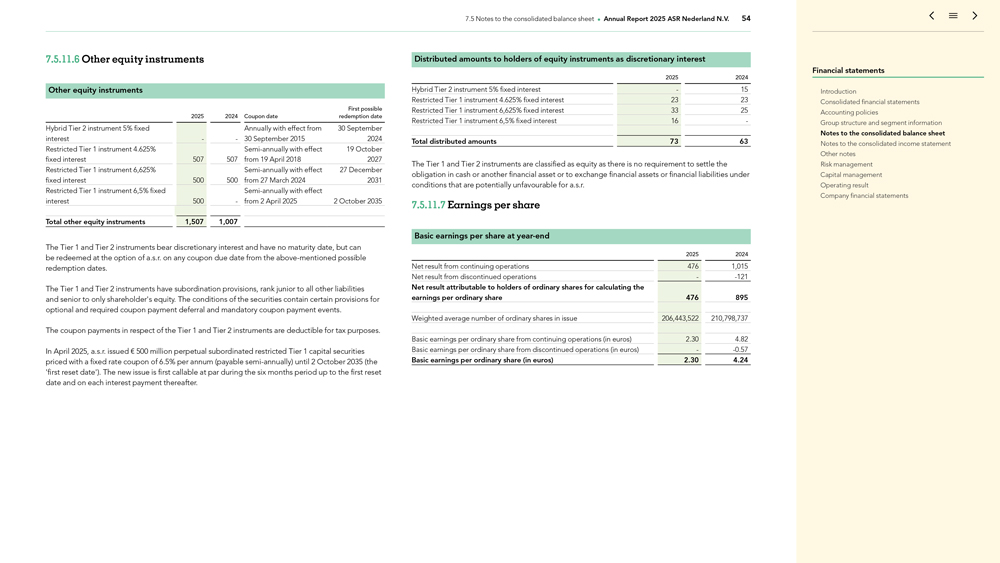
7.5 Notes to the consolidated balance sheet Annual Report 2025 ASR Nederland N.V. 54 7.5.11.6 Other equity
instruments Other equity instruments First possible 2025 2024 Coupon date redemption date Hybrid Tier 2 instrument 5% fixed Annually with effect from 30 September interest — 30 September 2015 2024 Restricted Tier 1 instrument 4.625%
Semi-annually with effect 19 October fixed interest 507 507 from 19 April 2018 2027 Restricted Tier 1 instrument 6,625% Semi-annually with effect 27 December fixed interest 500 500 from 27 March 2024 2031 Restricted Tier 1
instrument 6,5% fixed Semi-annually with effect interest 500—from 2 April 2025 2 October 2035 Total other equity instruments 1,507 1,007 The Tier 1 and Tier 2 instruments bear discretionary interest and have no maturity date, but can
be redeemed at the option of a.s.r. on any coupon due date from the above-mentioned possible redemption dates. The Tier 1 and Tier 2 instruments have subordination provisions, rank junior to all other liabilities and senior to only
shareholder’s equity. The conditions of the securities contain certain provisions for optional and required coupon payment deferral and mandatory coupon payment events. The coupon payments in respect of the Tier 1 and Tier 2 instruments are
deductible for tax purposes. In April 2025, a.s.r. issued € 500 million perpetual subordinated restricted Tier 1 capital securities priced with a fixed rate coupon of 6.5% per annum (payable semi-annually) until 2 October 2035
(the ‘first reset date’). The new issue is first callable at par during the six months period up to the first reset date and on each interest payment thereafter. Distributed amounts to holders of equity instruments as discretionary
interest 2025 2024 Hybrid Tier 2 instrument 5% fixed interest—15 Restricted Tier 1 instrument 4.625% fixed interest 23 23 Restricted Tier 1 instrument 6,625% fixed interest 33 25 Restricted Tier 1 instrument 6,5% fixed interest 16— Total
distributed amounts 73 63 The Tier 1 and Tier 2 instruments are classified as equity as there is no requirement to settle the obligation in cash or another financial asset or to exchange financial assets or financial liabilities under conditions
that are potentially unfavourable for a.s.r. 7.5.11.7 Earnings per share Basic earnings per share at year-end 2025 2024 Net result from continuing operations 476 1,015 Net result from discontinued operations—-121 Net result attributable to holders of ordinary shares for calculating the earnings per ordinary share 476 895 Weighted average number of ordinary shares in issue 206,443,522 210,798,737 Basic
earnings per ordinary share from continuing operations (in euros) 2.30 4.82 Basic earnings per ordinary share from discontinued operations (in euros)—-0.57 Basic earnings per ordinary share (in euros)
2.30 4.24 Financial statements Introduction Consolidated financial statements Accounting policies Group structure and segment information Notes to the consolidated balance sheet Notes to the consolidated income statement Other notes Risk management
Capital management Operating result Company financial statements
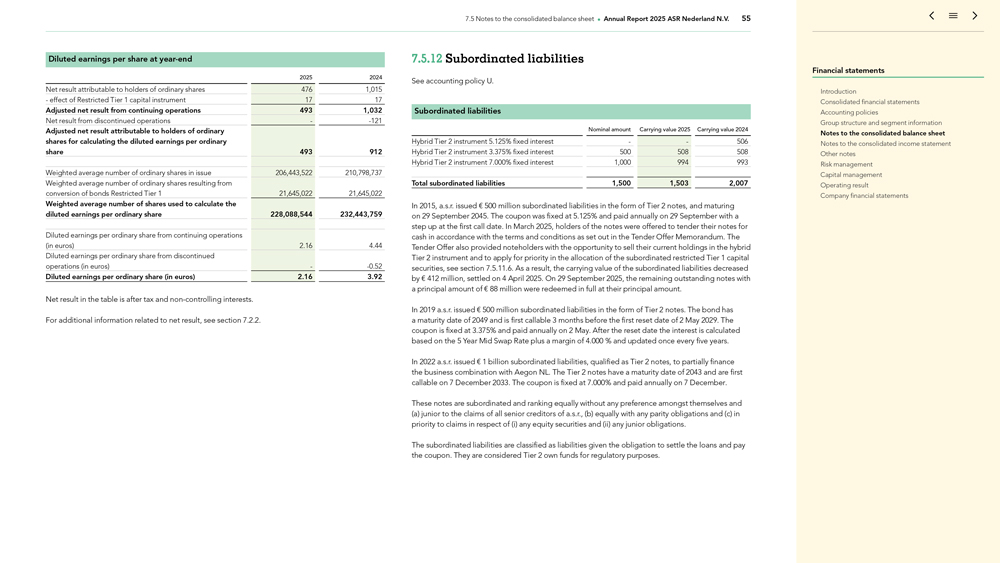
7.5 Notes to the consolidated balance sheet Annual Report 2025 ASR Nederland N.V. 55 Diluted earnings per share
at year-end 2025 2024 Net result attributable to holders of ordinary shares 476 1,015—effect of Restricted Tier 1 capital instrument 17 17 Adjusted net result from continuing operations 493 1,032 Net
result from discontinued operations—-121 Adjusted net result attributable to holders of ordinary shares for calculating the diluted earnings per ordinary share 493 912 Weighted average number of ordinary
shares in issue 206,443,522 210,798,737 Weighted average number of ordinary shares resulting from conversion of bonds Restricted Tier 1 21,645,022 21,645,022 Weighted average number of shares used to calculate the diluted earnings per ordinary share
228,088,544 232,443,759 Diluted earnings per ordinary share from continuing operations (in euros) 2.16 4.44 Diluted earnings per ordinary share from discontinued operations (in euros)—-0.52 Diluted
earnings per ordinary share (in euros) 2.16 3.92 Net result in the table is after tax and non-controlling interests. For additional information related to net result, see section 7.2.2. 7.5.12 Subordinated
liabilities See accounting policy U. Subordinated liabilities Nominal amount Carrying value 2025 Carrying value 2024 Hybrid Tier 2 instrument 5.125% fixed interest — 506 Hybrid Tier 2 instrument 3.375% fixed interest 500 508 508 Hybrid Tier 2
instrument 7.000% fixed interest 1,000 994 993 Total subordinated liabilities 1,500 1,503 2,007 In 2015, a.s.r. issued € 500 million subordinated liabilities in the form of Tier 2 notes, and maturing on 29 September 2045. The
coupon was fixed at 5.125% and paid annually on 29 September with a step up at the first call date. In March 2025, holders of the notes were offered to tender their notes for cash in accordance with the terms and conditions as set out in the
Tender Offer Memorandum. The Tender Offer also provided noteholders with the opportunity to sell their current holdings in the hybrid Tier 2 instrument and to apply for priority in the allocation of the subordinated restricted Tier 1 capital
securities, see section 7.5.11.6. As a result, the carrying value of the subordinated liabilities decreased by € 412 million, settled on 4 April 2025. On 29 September 2025, the remaining outstanding notes with a principal
amount of € 88 million were redeemed in full at their principal amount. In 2019 a.s.r. issued € 500 million subordinated liabilities in the form of Tier 2 notes. The bond has a maturity date of 2049 and is first
callable 3 months before the first reset date of 2 May 2029. The coupon is fixed at 3.375% and paid annually on 2 May. After the reset date the interest is calculated based on the 5 Year Mid Swap Rate plus a margin of 4.000 % and updated
once every five years. In 2022 a.s.r. issued € 1 billion subordinated liabilities, qualified as Tier 2 notes, to partially finance the business combination with Aegon NL. The Tier 2 notes have a maturity date of 2043 and are first
callable on 7 December 2033. The coupon is fixed at 7.000% and paid annually on 7 December. These notes are subordinated and ranking equally without any preference amongst themselves and (a) junior to the claims of all senior creditors of
a.s.r., (b) equally with any parity obligations and (c) in priority to claims in respect of (i) any equity securities and (ii) any junior obligations. The subordinated liabilities are classified as liabilities given the obligation to
settle the loans and pay the coupon. They are considered Tier 2 own funds for regulatory purposes. Financial statements Introduction Consolidated financial statements Accounting policies Group structure and segment information Notes to the
consolidated balance sheet Notes to the consolidated income statement Other notes Risk management Capital management Operating result Company financial statements
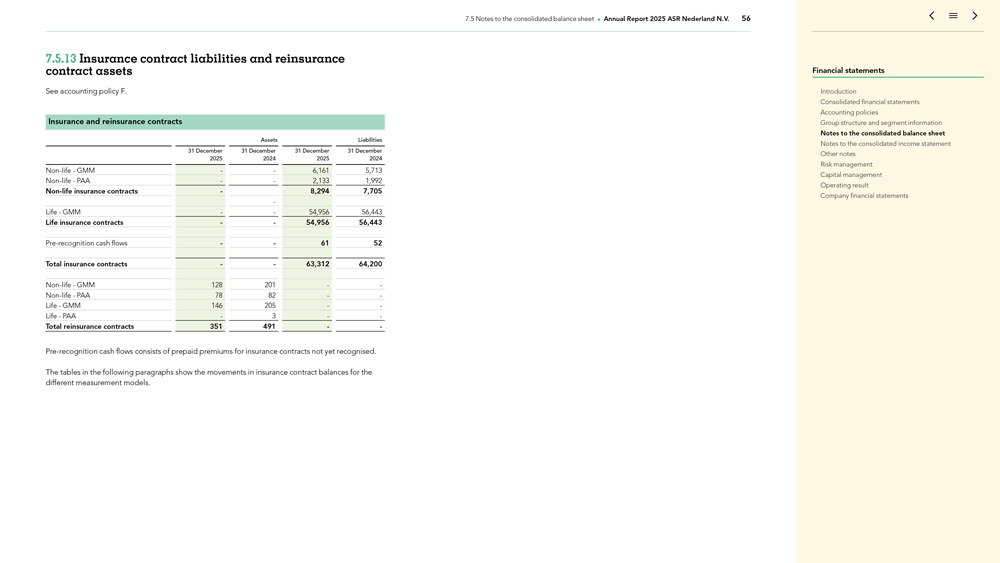
7.5 Notes to the consolidated balance sheet Annual Report 2025 ASR Nederland N.V. 56 contract 7.5.13 Insurance
assets contract liabilities and reinsurance See accounting policy F. Insurance and reinsurance contracts Assets Liabilities 31 December 31 December 31 December 31 December 2025 2024 2025 2024
Non-life—GMM — 6,161 5,713 Non-life—PAA — 2,133 1,992 Non-life insurance contracts—8,294 7,705
— Life—GMM — 54,956 56,443 Life insurance contracts — 54,956 56,443 Pre-recognition cash flows — 61 52 Total insurance contracts — 63,312 64,200 Non-life—GMM 128 201—-Non-life—PAA 78 82 —Life—GMM 146 205 —Life—PAA—3 — Total
reinsurance contracts 351 491 — Pre-recognition cash flows consists of prepaid premiums for insurance contracts not yet recognised. The tables in the following paragraphs show the movements in insurance
contract balances for the different measurement models. Financial statements Introduction Consolidated financial statements Accounting policies Group structure and segment information Notes to the consolidated balance sheet Notes to the consolidated
income statement Other notes Risk management Capital management Operating result Company financial statements
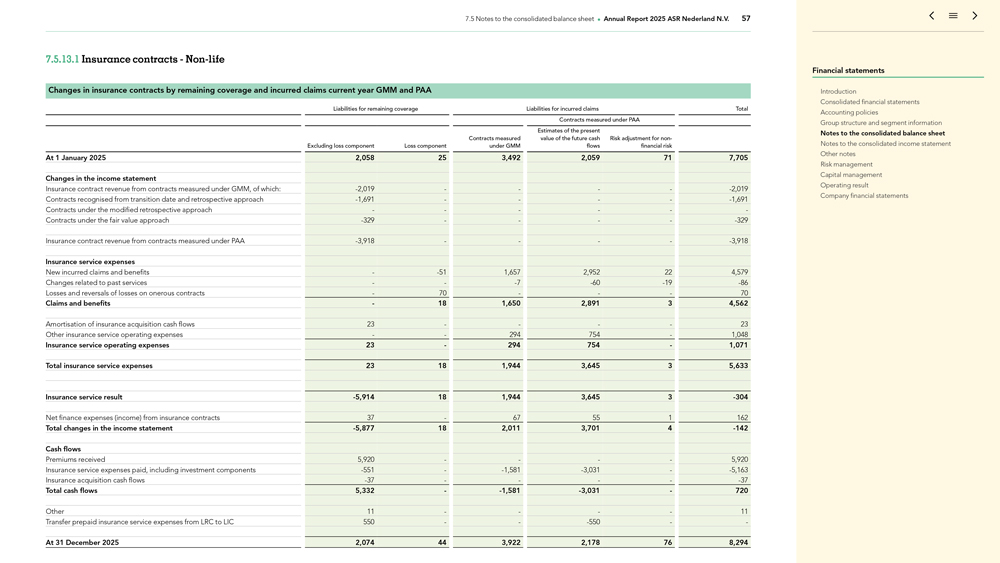
7.5 Notes to the consolidated balance sheet Annual Report 2025 ASR Nederland N.V. 57 7.5.13.1 Insurance contracts—Non-life Changes in insurance contracts by remaining coverage and incurred claims current year GMM and PAA Liabilities for remaining coverage Liabilities for incurred claims Total Contracts measured
under PAA Estimates of the present Contracts measured value of the future cash Risk adjustment for non-Excluding loss component Loss component under GMM flows financial risk At 1 January 2025 2,058 25
3,492 2,059 71 7,705 Changes in the income statement Insurance contract revenue from contracts measured under GMM, of which: -2,019 — — -2,019 Contracts
recognised from transition date and retrospective approach -1,691 — — -1,691 Contracts under the modified retrospective approach — —
—Contracts under the fair value approach -329 — — -329 Insurance contract revenue from contracts measured under PAA
-3,918 — — -3,918 Insurance service expenses New incurred claims and benefits—-51 1,657 2,952 22 4,579 Changes
related to past services — -7 -60 -19 -86 Losses and reversals of losses on onerous
contracts—70 ——70 Claims and benefits—18 1,650 2,891 3 4,562 Amortisation of insurance acquisition cash flows 23 — — 23 Other insurance service operating expenses — 294 754—1,048 Insurance service
operating expenses 23—294 754—1,071 Total insurance service expenses 23 18 1,944 3,645 3 5,633 Insurance service result -5,914 18 1,944 3,645 3 -304 Net
finance expenses (income) from insurance contracts 37—67 55 1 162 Total changes in the income statement -5,877 18 2,011 3,701 4 -142 Cash flows Premiums received
5,920 — — 5,920 Insurance service expenses paid, including investment components -551—-1,581 -3,031—-5,163 Insurance acquisition cash flows -37 — — -37 Total cash flows
5,332—-1,581 -3,031—720 Other 11 — — 11 Transfer prepaid insurance service expenses from LRC to LIC 550 —
-550 — At 31 December 2025 2,074 44 3,922 2,178 76 8,294 Financial statements Introduction Consolidated financial statements Accounting policies Group structure and segment information Notes to the
consolidated balance sheet Notes to the consolidated income statement Other notes Risk management Capital management Operating result Company financial statements
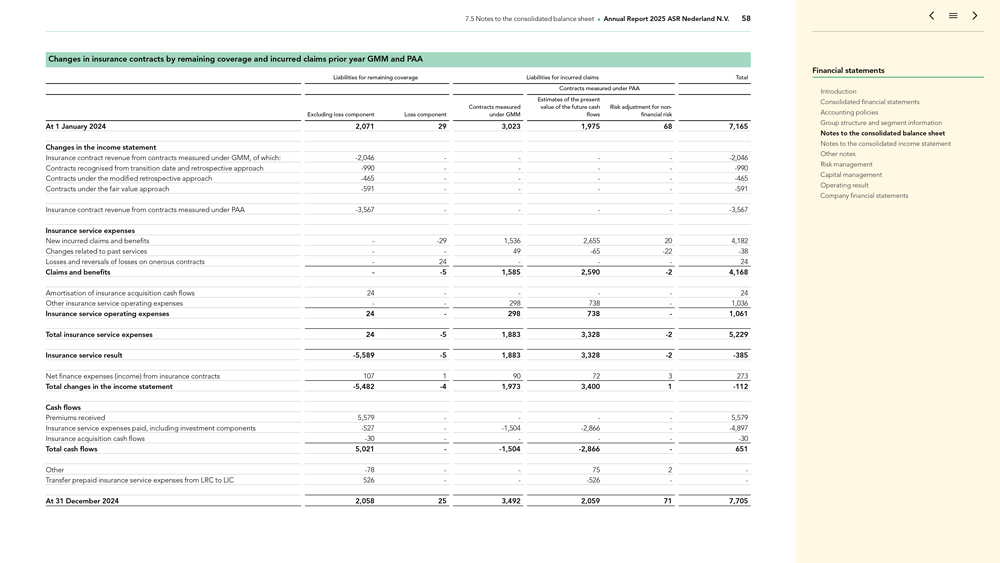
7.5 Notes to the consolidated balance sheet Annual Report 2025 ASR Nederland N.V. 58 Changes in insurance
contracts by remaining coverage and incurred claims prior year GMM and PAA Liabilities for remaining coverage Liabilities for incurred claims Total Contracts measured under PAA Estimates of the present Contracts measured value of the future cash
Risk adjustment for non-Excluding loss component Loss component under GMM flows financial risk At 1 January 2024 2,071 29 3,023 1,975 68 7,165 Changes in the income statement Insurance contract revenue
from contracts measured under GMM, of which: -2,046 — — -2,046 Contracts recognised from transition date and retrospective approach -990 — — -990 Contracts under the modified retrospective approach -465 — —
-465 Contracts under the fair value approach -591 — — -591 Insurance contract revenue from contracts measured under
PAA -3,567 — — -3,567 Insurance service expenses New incurred claims and benefits—-29 1,536 2,655 20 4,182
Changes related to past services — 49 -65 -22 -38 Losses and reversals of losses on onerous contracts—24
——24 Claims and benefits—-5 1,585 2,590 -2 4,168 Amortisation of insurance acquisition cash flows 24 — — 24 Other insurance service
operating expenses — 298 738—1,036 Insurance service operating expenses 24—298 738—1,061 Total insurance service expenses 24 -5 1,883 3,328 -2
5,229 Insurance service result -5,589 -5 1,883 3,328 -2 -385 Net finance expenses
(income) from insurance contracts 107 1 90 72 3 273 Total changes in the income statement -5,482 -4 1,973 3,400 1 -112 Cash flows
Premiums received 5,579 — — 5,579 Insurance service expenses paid, including investment components -527—-1,504 -2,866—-4,897 Insurance acquisition cash flows -30 — — -30 Total cash flows
5,021—-1,504 -2,866—651 Other -78 — 75 2 -Transfer prepaid insurance service expenses from LRC to LIC 526
— -526 — At 31 December 2024 2,058 25 3,492 2,059 71 7,705 Financial statements Introduction Consolidated financial statements Accounting policies Group structure and segment information Notes
to the consolidated balance sheet Notes to the consolidated income statement Other notes Risk management Capital management Operating result Company financial statements
7.5 Notes to the consolidated balance sheet Annual Report 2025 ASR Nederland N.V. 59 In 2025, a.s.r.
implemented a voluntary change in accounting policy regarding the treatment of incurred claims that remain subject to future insurance risk within the Individual Disability portfolio, see section 7.3.2.1. As a result, amounts previously recognised
as liabilities for incurred claims have been reclassified to liabilities for remaining coverage. As at 31 December 2024, liabilities for remaining coverage excluding loss component have increased by € 1,658 million (from
€ 400 million to € 2,058 million) and at the same time liabilities for incurred claims of contracts measured under GMM have decreased by € 1,728 million (from € 5,220 million to
€ 3,492 million). The impact on the opening balance as at 1 January 2024 is of a comparable magnitude. This reclassification also affects the measurement of the CSM, related experience adjustments (linked to current and past services)
are recognised in the CSM rather than in the insurance service result. In 2024, other relates to the transfer of the Aegon P&C acquired claims portfolio from GMM to PAA, so that the complete P&C portfolio would fall under the PAA model. This
could be done due to the very limited CSM that was remaining on this portfolio at the moment of the transfer (€ 1 million early release to the insurance contract revenue). Financial statements Introduction Consolidated financial
statements Accounting policies Group structure and segment information Notes to the consolidated balance sheet Notes to the consolidated income statement Other notes Risk management Capital management Operating result Company financial statements
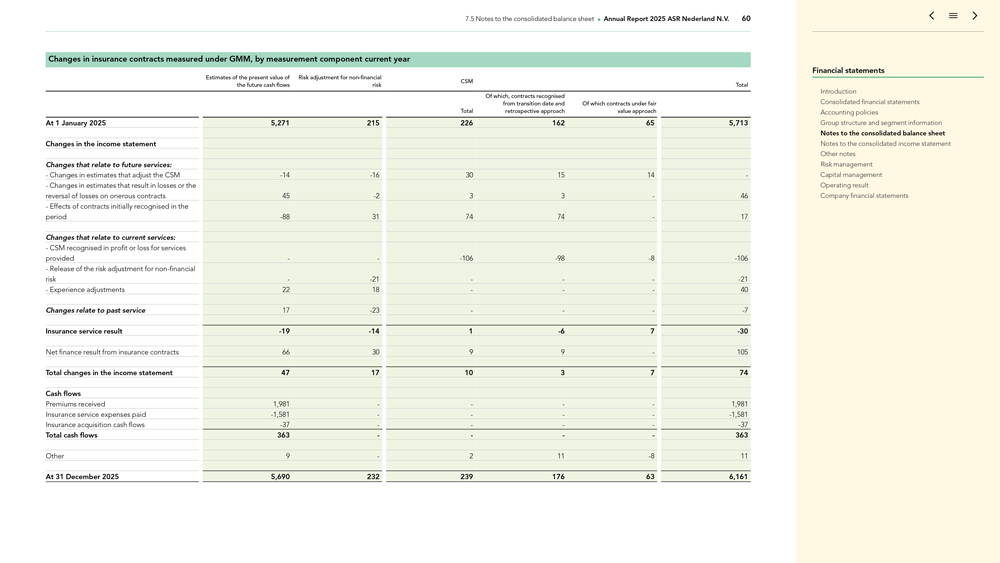
7.5 Notes to the consolidated balance sheet Annual Report 2025 ASR Nederland N.V. 60 Changes in insurance
contracts measured under GMM, by measurement component current year Estimates of the present value of Risk adjustment for non-financial CSM the future cash flows risk Total Of which, contracts recognised from
transition date and Of which contracts under fair Total retrospective approach value approach At 1 January 2025 5,271 215 226 162 65 5,713 Changes in the income statement Changes that relate to future services: —Changes in estimates that
adjust the CSM -14 -16 30 15 14 — Changes in estimates that result in losses or the reversal of losses on onerous contracts 45
-2 3 3—46—Effects of contracts initially recognised in the period -88 31 74 74—17 Changes that relate to current services: —CSM recognised in
profit or loss for services provided — -106 -98 -8 -106—Release of the risk
adjustment for non-financial risk—-21 ——-21—Experience adjustments 22 18 ——40 Changes relate
to past service 17 -23 ——-7 Insurance service result -19 -14 1 -6 7 -30 Net finance result from insurance contracts 66 30 9 9—105 Total changes in the income statement 47 17 10 3 7 74 Cash flows Premiums received 1,981 —
— 1,981 Insurance service expenses paid -1,581 — — -1,581 Insurance acquisition cash flows -37 — — -37 Total cash flows 363 — — 363 Other 9—2 11 -8 11 At 31 December 2025 5,690 232 239 176 63 6,161 Financial statements Introduction Consolidated
financial statements Accounting policies Group structure and segment information Notes to the consolidated balance sheet Notes to the consolidated income statement Other notes Risk management Capital management Operating result Company financial
statements
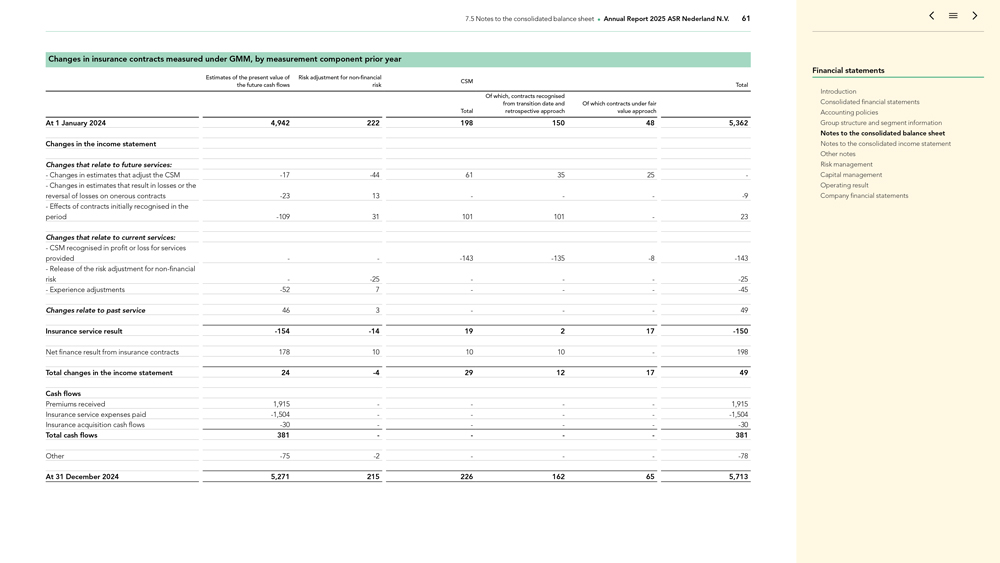
7.5 Notes to the consolidated balance sheet Annual Report 2025 ASR Nederland N.V. 61 Changes in insurance
contracts measured under GMM, by measurement component prior year Estimates of the present value of Risk adjustment for non-financial CSM the future cash flows risk Total Of which, contracts recognised from
transition date and Of which contracts under fair Total retrospective approach value approach At 1 January 2024 4,942 222 198 150 48 5,362 Changes in the income statement Changes that relate to future services: —Changes in estimates that
adjust the CSM -17 -44 61 35 25 — Changes in estimates that result in losses or the reversal of losses on onerous contracts
-23 13 ——-9—Effects of contracts initially recognised in the period -109 31 101 101—23 Changes that
relate to current services: —CSM recognised in profit or loss for services provided — -143 -135 -8 -143—Release of the risk adjustment for non-financial risk—-25
——-25—Experience adjustments -52 7 ——-45 Changes relate to past service 46 3 ——49
Insurance service result -154 -14 19 2 17 -150 Net finance result from insurance contracts 178 10 10 10—198 Total changes
in the income statement 24 -4 29 12 17 49 Cash flows Premiums received 1,915 — — 1,915 Insurance service expenses paid -1,504 — — -1,504 Insurance acquisition cash flows -30 — — -30 Total cash flows 381 — — 381 Other -75 -2 ——-78 At 31 December 2024 5,271 215 226 162 65 5,713 Financial statements Introduction Consolidated financial
statements Accounting policies Group structure and segment information Notes to the consolidated balance sheet Notes to the consolidated income statement Other notes Risk management Capital management Operating result Company financial statements
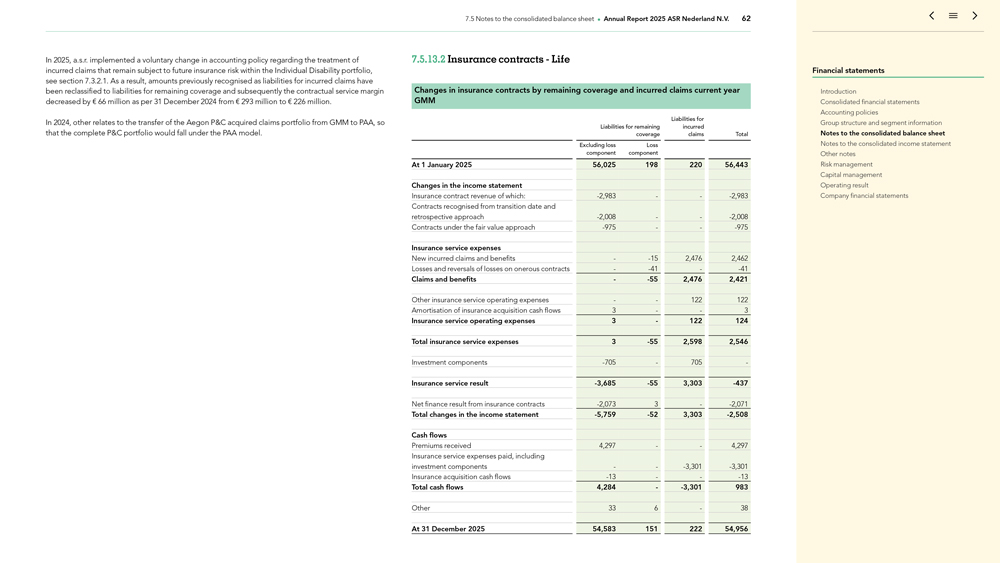
7.5 Notes to the consolidated balance sheet Annual Report 2025 ASR Nederland N.V. 62 In 2025, a.s.r.
implemented a voluntary change in accounting policy regarding the treatment of incurred claims that remain subject to future insurance risk within the Individual Disability portfolio, see section 7.3.2.1. As a result, amounts previously recognised
as liabilities for incurred claims have been reclassified to liabilities for remaining coverage and subsequently the contractual service margin decreased by € 66 million as per 31 December 2024 from € 293 million
to € 226 million. In 2024, other relates to the transfer of the Aegon P&C acquired claims portfolio from GMM to PAA, so that the complete P&C portfolio would fall under the PAA model. 7.5.13.2 Insurance contracts—Life
Changes in insurance contracts by remaining coverage and incurred claims current year GMM Liabilities for Liabilities for remaining incurred coverage claims Total Excluding loss Loss component component At 1 January 2025 56,025 198 220 56,443
Changes in the income statement Insurance contract revenue of which: -2,983 — -2,983 Contracts recognised from transition date and retrospective approach -2,008 — -2,008 Contracts under the fair value approach -975 — -975 Insurance
service expenses New incurred claims and benefits—-15 2,476 2,462 Losses and reversals of losses on onerous
contracts—-41—-41 Claims and benefits—-55 2,476 2,421 Other insurance service operating expenses — 122
122 Amortisation of insurance acquisition cash flows 3 — 3 Insurance service operating expenses 3—122 124 Total insurance service expenses 3 -55 2,598 2,546 Investment components -705—705— Insurance service result -3,685 -55 3,303 -437 Net finance result from
insurance contracts -2,073 3—-2,071 Total changes in the income statement -5,759
-52 3,303 -2,508 Cash flows Premiums received 4,297 — 4,297 Insurance service expenses paid, including investment components —
-3,301 -3,301 Insurance acquisition cash flows -13 — -13 Total cash flows 4,284—-3,301 983 Other 33 6—38 At 31 December 2025 54,583 151 222 54,956 Financial statements Introduction Consolidated financial statements Accounting policies Group structure and segment
information Notes to the consolidated balance sheet Notes to the consolidated income statement Other notes Risk management Capital management Operating result Company financial statements
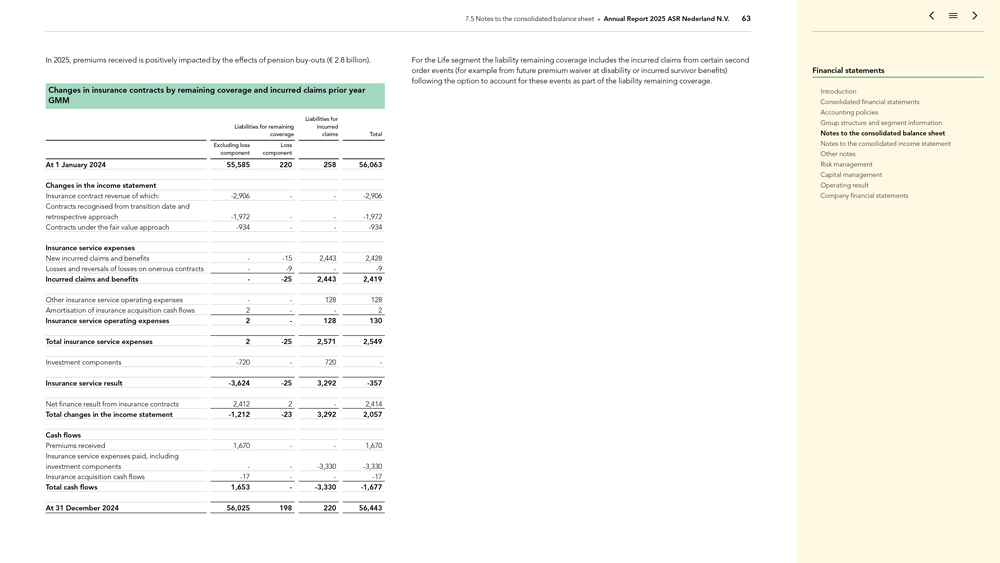
7.5 Notes to the consolidated balance sheet Annual Report 2025 ASR Nederland N.V. 63 In 2025, premiums received
is positively impacted by the effects of pension buy-outs (€ 2.8 billion). Changes in insurance contracts by remaining coverage and incurred claims prior year GMM Liabilities for Liabilities for
remaining incurred coverage claims Total Excluding loss Loss component component At 1 January 2024 55,585 220 258 56,063 Changes in the income statement Insurance contract revenue of which: -2,906 —
-2,906 Contracts recognised from transition date and retrospective approach -1,972 — -1,972 Contracts under the fair value
approach -934 — -934 Insurance service expenses New incurred claims and benefits—-15 2,443 2,428 Losses and reversals
of losses on onerous contracts—-9—-9 Incurred claims and benefits—-25 2,443 2,419 Other insurance service
operating expenses — 128 128 Amortisation of insurance acquisition cash flows 2 — 2 Insurance service operating expenses 2—128 130 Total insurance service expenses 2 -25 2,571 2,549
Investment components -720—720— Insurance service result -3,624 -25 3,292
-357 Net finance result from insurance contracts 2,412 2—2,414 Total changes in the income statement -1,212 -23 3,292 2,057
Cash flows Premiums received 1,670 — 1,670 Insurance service expenses paid, including investment components — -3,330 -3,330 Insurance acquisition cash flows -17 — -17 Total cash flows 1,653—-3,330 -1,677 At 31 December 2024 56,025 198
220 56,443 For the Life segment the liability remaining coverage includes the incurred claims from certain second order events (for example from future premium waiver at disability or incurred survivor benefits) following the option to account for
these events as part of the liability remaining coverage. Financial statements Introduction Consolidated financial statements Accounting policies Group structure and segment information Notes to the consolidated balance sheet Notes to the
consolidated income statement Other notes Risk management Capital management Operating result Company financial statements
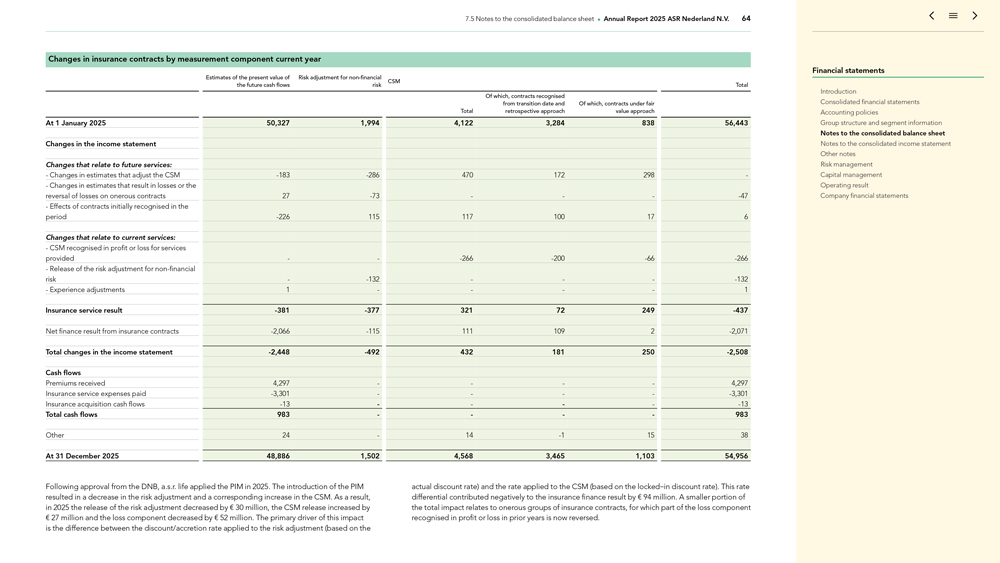
7.5 Notes to the consolidated balance sheet Annual Report 2025 ASR Nederland N.V. 64 Changes in insurance
contracts by measurement component current year Estimates of the present value of Risk adjustment for non-financial CSM the future cash flows risk Total Of which, contracts recognised from transition date and
Of which, contracts under fair Total retrospective approach value approach At 1 January 2025 50,327 1,994 4,122 3,284 838 56,443 Changes in the income statement Changes that relate to future services: —Changes in estimates that adjust the
CSM -183 -286 470 172 298 — Changes in estimates that result in losses or the reversal of losses on onerous contracts 27
-73 ——-47—Effects of contracts initially recognised in the period -226 115 117 100 17 6 Changes that relate to
current services: —CSM recognised in profit or loss for services provided — -266 -200 -66 -266—Release of the risk adjustment for non-financial risk—-132
——-132—Experience adjustments 1 — — 1 Insurance service result -381 -377 321 72 249 -437 Net finance result from insurance contracts -2,066 -115 111 109 2 -2,071 Total changes in
the income statement -2,448 -492 432 181 250 -2,508 Cash flows Premiums received 4,297 — — 4,297 Insurance service
expenses paid -3,301 — — -3,301 Insurance acquisition cash flows -13 — —
-13 Total cash flows 983 — — 983 Other 24—14 -1 15 38 At 31 December 2025 48,886 1,502 4,568 3,465 1,103 54,956 Following approval from the DNB,
a.s.r. life applied the PIM in 2025. The introduction of the PIM resulted in a decrease in the risk adjustment and a corresponding increase in the CSM. As a result, in 2025 the release of the risk adjustment decreased by € 30 million,
the CSM release increased by € 27 million and the loss component decreased by € 52 million. The primary driver of this impact is the difference between the discount/accretion rate applied to the risk adjustment (based
on the actual discount rate) and the rate applied to the CSM (based on the locked-in discount rate). This rate differential contributed negatively to the insurance finance result by € 94 million. A smaller portion of the total impact
relates to onerous groups of insurance contracts, for which part of the loss component recognised in profit or loss in prior years is now reversed. Financial statements Introduction Consolidated financial statements Accounting policies Group
structure and segment information Notes to the consolidated balance sheet Notes to the consolidated income statement Other notes Risk management Capital management Operating result Company financial statements
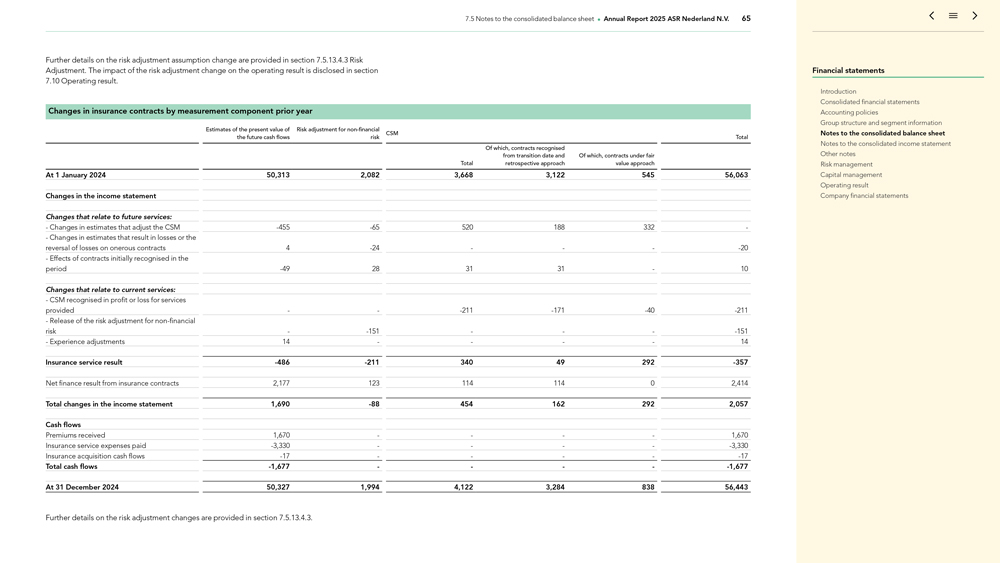
7.5 Notes to the consolidated balance sheet Annual Report 2025 ASR Nederland N.V. 65 Further details on the
risk adjustment assumption change are provided in section 7.5.13.4.3 Risk Adjustment. The impact of the risk adjustment change on the operating result is disclosed in section 7.10 Operating result. Changes in insurance contracts by measurement
component prior year Estimates of the present value of Risk adjustment for non-financial CSM the future cash flows risk Total Of which, contracts recognised from transition date and Of which, contracts under
fair Total retrospective approach value approach At 1 January 2024 50,313 2,082 3,668 3,122 545 56,063 Changes in the income statement Changes that relate to future services: —Changes in estimates that adjust the CSM -455 -65 520 188 332 — Changes in estimates that result in losses or the reversal of losses on onerous contracts 4 -24 ——-20—Effects of contracts initially recognised in the period -49 28 31 31—10 Changes that relate to current services: —CSM recognised in profit
or loss for services provided — -211 -171 -40 -211—Release of the risk
adjustment for non-financial risk—-151 ——-151—Experience adjustments 14 — — 14 Insurance
service result -486 -211 340 49 292 -357 Net finance result from insurance contracts 2,177 123 114 114 0 2,414 Total changes in
the income statement 1,690 -88 454 162 292 2,057 Cash flows Premiums received 1,670 — — 1,670 Insurance service expenses paid -3,330 — — -3,330 Insurance acquisition cash flows -17 — — -17 Total cash flows -1,677 —
— -1,677 At 31 December 2024 50,327 1,994 4,122 3,284 838 56,443 Further details on the risk adjustment changes are provided in section 7.5.13.4.3. Financial statements Introduction Consolidated
financial statements Accounting policies Group structure and segment information Notes to the consolidated balance sheet Notes to the consolidated income statement Other notes Risk management Capital management Operating result Company financial
statements
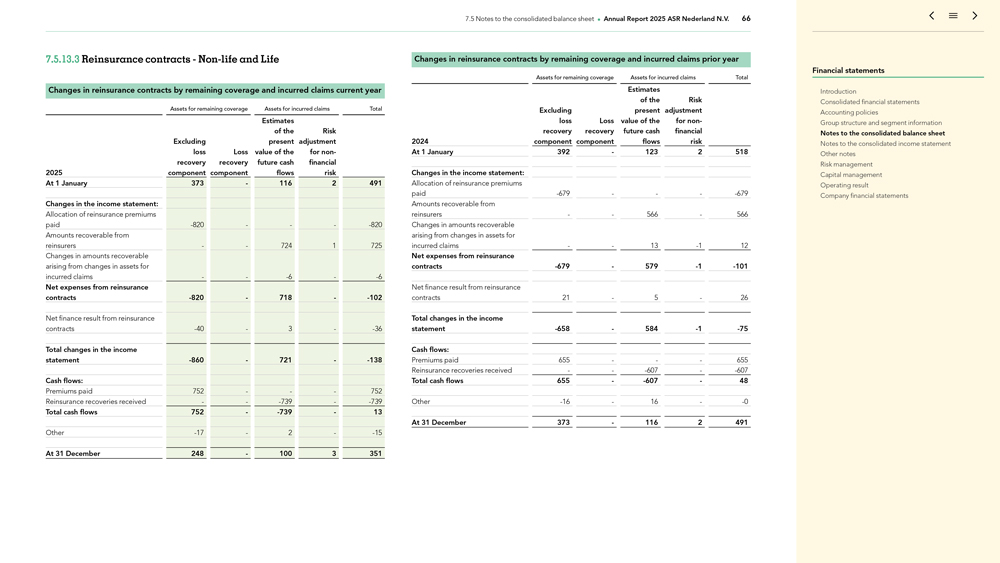
7.5 Notes to the consolidated balance sheet Annual Report 2025 ASR Nederland N.V. 66 7.5.13.3 Reinsurance contracts—Non-life and Life Changes in reinsurance contracts by remaining coverage and incurred claims current year Assets for remaining coverage Assets for incurred claims Total Estimates of the Risk
Excluding present adjustment loss Loss value of the for non-recovery recovery future cash financial 2025 component component flows risk At 1 January 373—116 2 491 Changes in the income statement:
Allocation of reinsurance premiums paid -820 ——-820 Amounts recoverable from reinsurers — 724 1 725 Changes in amounts recoverable arising from changes
in assets for incurred claims — -6—-6 Net expenses from reinsurance contracts
-820—718—-102 Net finance result from reinsurance contracts
-40—3—-36 Total changes in the income statement -860—721—-138
Cash flows: Premiums paid 752 ——752 Reinsurance recoveries received — -739—-739 Total cash flows
752—-739—13 Other -17—2—-15 At 31 December 248—100 3 351 Changes in reinsurance contracts by
remaining coverage and incurred claims prior year Assets for remaining coverage Assets for incurred claims Total Estimates of the Risk Excluding present adjustment loss Loss value of the for non-recovery
recovery future cash financial 2024 component component flows risk At 1 January 392—123 2 518 Changes in the income statement: Allocation of reinsurance premiums paid -679 ——-679 Amounts recoverable from reinsurers — 566—566 Changes in amounts recoverable arising from changes in assets for incurred claims — 13 -1 12
Net expenses from reinsurance contracts -679—579 -1 -101 Net finance result from reinsurance contracts 21—5—26
Total changes in the income statement -658—584 -1 -75 Cash flows: Premiums paid 655 ——655 Reinsurance
recoveries received — -607—-607 Total cash flows 655—-607—48 Other -16—16—-0 At 31 December 373—116 2 491 Financial statements Introduction Consolidated financial statements Accounting policies Group structure and segment information Notes to the
consolidated balance sheet Notes to the consolidated income statement Other notes Risk management Capital management Operating result Company financial statements
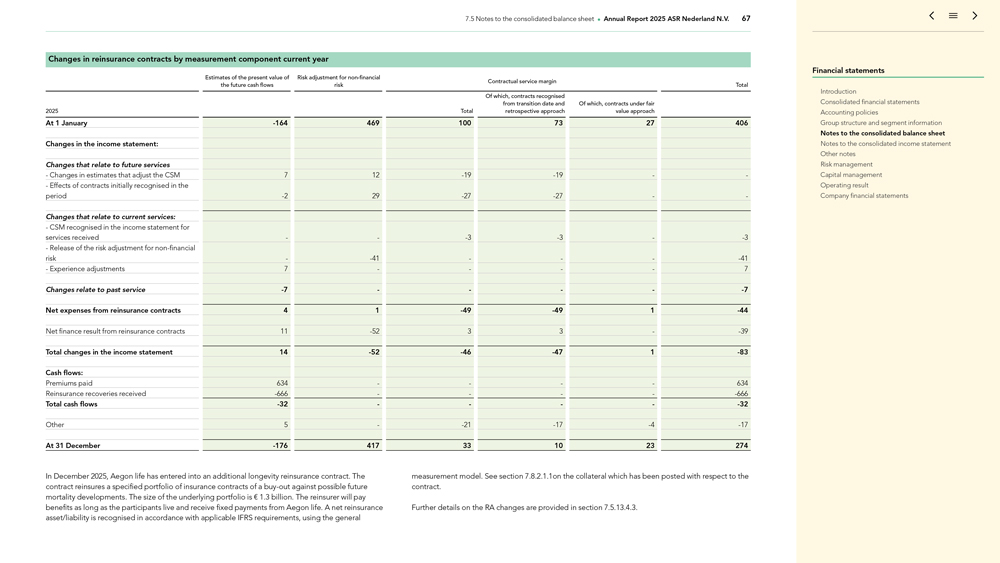
7.5 Notes to the consolidated balance sheet Annual Report 2025 ASR Nederland N.V. 67 Changes in reinsurance
contracts by measurement component current year Estimates of the present value of Risk adjustment for non-financial Contractual service margin the future cash flows risk Total Of which, contracts recognised
from transition date and Of which, contracts under fair 2025 Total retrospective approach value approach At 1 January -164 469 100 73 27 406 Changes in the income statement: Changes that relate to future
services —Changes in estimates that adjust the CSM 7 12 -19 -19 —- Effects of contracts initially recognised in the period
-2 29 -27 -27 — Changes that relate to current services: —CSM recognised in the income statement for services
received — -3 -3—-3—Release of the risk adjustment for non-financial risk—-41 ——-41—Experience adjustments 7 — — 7 Changes relate to past service -7 — — -7 Net expenses from reinsurance contracts 4 1 -49 -49 1 -44 Net finance result from
reinsurance contracts 11 -52 3 3—-39 Total changes in the income statement 14 -52
-46 -47 1 -83 Cash flows: Premiums paid 634 — — 634 Reinsurance recoveries received
-666 — — -666 Total cash flows -32 — — -32 Other 5—-21 -17 -4 -17 At 31 December -176 417 33
10 23 274 In December 2025, Aegon life has entered into an additional longevity reinsurance contract. The contract reinsures a specified portfolio of insurance contracts of a buy-out against possible future
mortality developments. The size of the underlying portfolio is € 1.3 billion. The reinsurer will pay benefits as long as the participants live and receive fixed payments from Aegon life. A net reinsurance asset/liability is
recognised in accordance with applicable IFRS requirements, using the general measurement model. See section 7.8.2.1.1on the collateral which has been posted with respect to the contract. Further details on the RA changes are provided in section
7.5.13.4.3. Financial statements Introduction Consolidated financial statements Accounting policies Group structure and segment information Notes to the consolidated balance sheet Notes to the consolidated income statement Other notes Risk
management Capital management Operating result Company financial statements
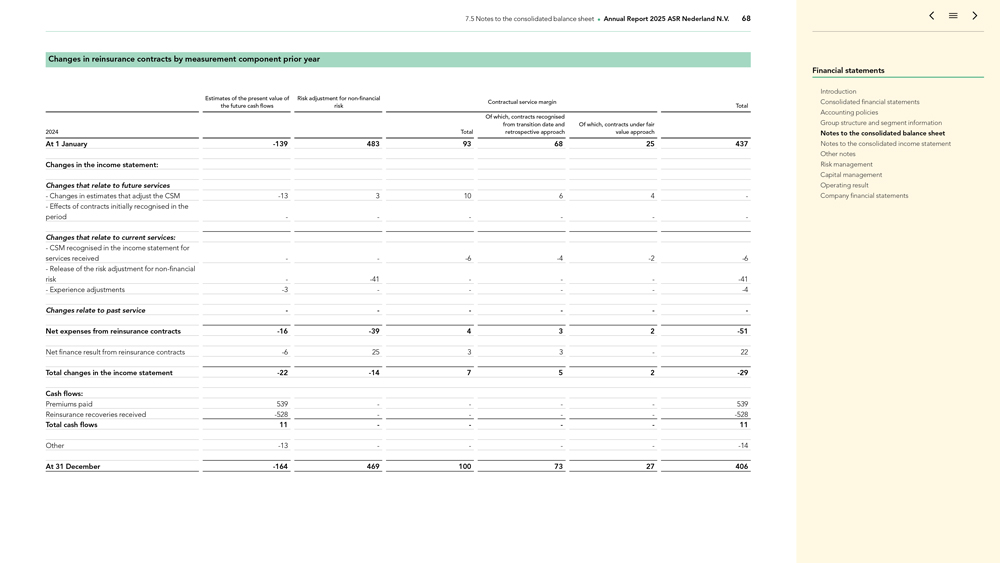
7.5 Notes to the consolidated balance sheet Annual Report 2025 ASR Nederland N.V. 68 Changes in reinsurance
contracts by measurement component prior year Estimates of the present value of Risk adjustment for non-financial Contractual service margin the future cash flows risk Total Of which, contracts recognised from
transition date and Of which, contracts under fair 2024 Total retrospective approach value approach At 1 January -139 483 93 68 25 437 Changes in the income statement: Changes that relate to future
services —Changes in estimates that adjust the CSM -13 3 10 6 4 — Effects of contracts initially recognised in the period — — — Changes that relate to current services: —CSM
recognised in the income statement for services received — -6 -4 -2
-6—Release of the risk adjustment for non-financial risk—-41
——-41—Experience adjustments -3 — — -4 Changes relate to past service — — — Net
expenses from reinsurance contracts -16 -39 4 3 2 -51 Net finance result from reinsurance contracts -6 25 3 3—22 Total changes in the income statement -22 -14 7 5 2 -29 Cash flows: Premiums
paid 539 — — 539 Reinsurance recoveries received -528 — — -528 Total cash flows 11 — — 11 Other
-13 — — -14 At 31 December -164 469 100 73 27 406 Financial statements Introduction Consolidated financial
statements Accounting policies Group structure and segment information Notes to the consolidated balance sheet Notes to the consolidated income statement Other notes Risk management Capital management Operating result Company financial statements
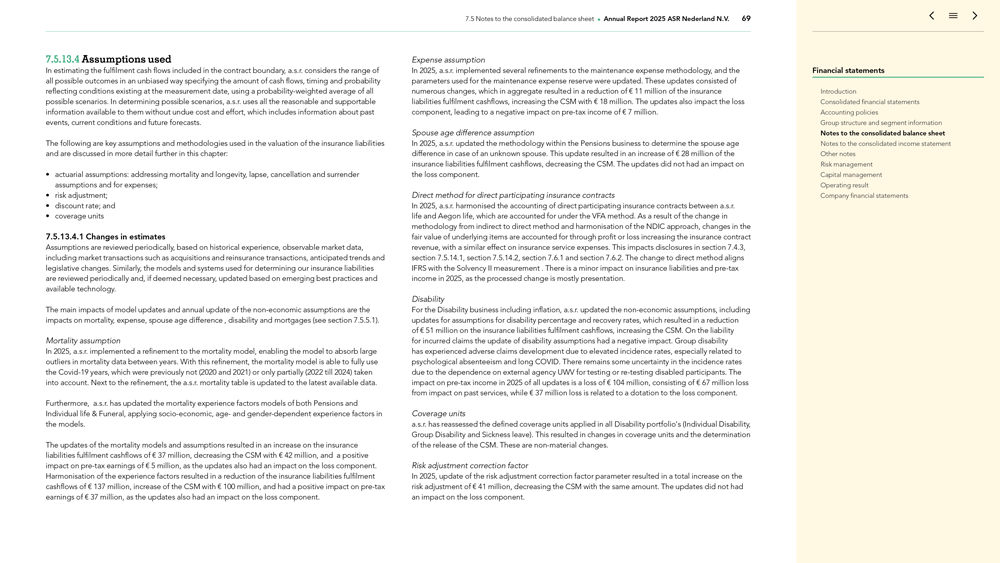
7.5 Notes to the consolidated balance sheet Annual Report 2025 ASR Nederland N.V. 69 7.5.13.4 Assumptions used
In estimating the fulfilment cash flows included in the contract boundary, a.s.r. considers the range of all possible outcomes in an unbiased way specifying the amount of cash flows, timing and probability reflecting conditions existing at the
measurement date, using a probability-weighted average of all possible scenarios. In determining possible scenarios, a.s.r. uses all the reasonable and supportable information available to them without undue cost and effort, which includes
information about past events, current conditions and future forecasts. The following are key assumptions and methodologies used in the valuation of the insurance liabilities and are discussed in more detail further in this chapter: actuarial
assumptions: addressing mortality and longevity, lapse, cancellation and surrender assumptions and for expenses; risk adjustment; discount rate; and coverage units 7.5.13.4.1 Changes in estimates Assumptions are reviewed periodically, based on
historical experience, observable market data, including market transactions such as acquisitions and reinsurance transactions, anticipated trends and legislative changes. Similarly, the models and systems used for determining our insurance
liabilities are reviewed periodically and, if deemed necessary, updated based on emerging best practices and available technology. The main impacts of model updates and annual update of the non-economic
assumptions are the impacts on mortality, expense, spouse age difference , disability and mortgages (see section 7.5.5.1) . Mortality assumption In 2025, a.s.r. implemented a refinement to the mortality model, enabling the model to absorb large
outliers in mortality data between years. With this refinement, the mortality model is able to fully use the Covid-19 years, which were previously not (2020 and 2021) or only partially (2022 till 2024) taken
into account. Next to the refinement, the a.s.r. mortality table is updated to the latest available data. Furthermore, a.s.r. has updated the mortality experience factors models of both Pensions and Individual life & Funeral, applying
socio-economic, age- and gender-dependent experience factors in the models. The updates of the mortality models and assumptions resulted in an increase on the insurance liabilities fulfilment cashflows of
€ 37 million, decreasing the CSM with € 42 million, and a positive impact on pre-tax earnings of € 5 million, as the updates also had an impact on the loss
component. Harmonisation of the experience factors resulted in a reduction of the insurance liabilities fulfilment cashflows of € 137 million, increase of the CSM with € 100 million, and had a positive impact on pre-tax earnings of € 37 million, as the updates also had an impact on the loss component. Expense assumption In 2025, a.s.r. implemented several refinements to the maintenance expense methodology,
and the parameters used for the maintenance expense reserve were updated. These updates consisted of numerous changes, which in aggregate resulted in a reduction of € 11 million of the insurance liabilities fulfilment cashflows,
increasing the CSM with € 18 million. The updates also impact the loss component, leading to a negative impact on pre-tax income of € 7 million. Spouse age difference assumption
In 2025, a.s.r. updated the methodology within the Pensions business to determine the spouse age difference in case of an unknown spouse. This update resulted in an increase of € 28 million of the insurance liabilities fulfilment
cashflows, decreasing the CSM. The updates did not had an impact on the loss component. Direct method for direct participating insurance contracts In 2025, a.s.r. harmonised the accounting of direct participating insurance contracts between a.s.r.
life and Aegon life, which are accounted for under the VFA method. As a result of the change in methodology from indirect to direct method and harmonisation of the NDIC approach, changes in the fair value of underlying items are accounted for
through profit or loss increasing the insurance contract revenue, with a similar effect on insurance service expenses. This impacts disclosures in section 7.4.3, section 7.5.14.1, section 7.5.14.2, section 7.6.1 and section 7.6.2. The change to
direct method aligns IFRS with the Solvency II measurement . There is a minor impact on insurance liabilities and pre-tax income in 2025, as the processed change is mostly presentation. Disability For the
Disability business including inflation, a.s.r. updated the non-economic assumptions, including updates for assumptions for disability percentage and recovery rates, which resulted in a reduction of
€ 51 million on the insurance liabilities fulfilment cashflows, increasing the CSM. On the liability for incurred claims the update of disability assumptions had a negative impact. Group disability has experienced adverse claims
development due to elevated incidence rates, especially related to psychological absenteeism and long COVID. There remains some uncertainty in the incidence rates due to the dependence on external agency UWV for testing or re-testing disabled participants. The impact on pre-tax income in 2025 of all updates is a loss of € 104 million, consisting of € 67 million loss
from impact on past services, while € 37 million loss is related to a dotation to the loss component. Coverage units a.s.r. has reassessed the defined coverage units applied in all Disability portfolio’s (Individual
Disability, Group Disability and Sickness leave). This resulted in changes in coverage units and the determination of the release of the CSM. These are non-material changes. Risk adjustment correction factor
In 2025, update of the risk adjustment correction factor parameter resulted in a total increase on the risk adjustment of € 41 million, decreasing the CSM with the same amount. The updates did not had an impact on the loss component.
Financial statements Introduction Consolidated financial statements Accounting policies Group structure and segment information Notes to the consolidated balance sheet Notes to the consolidated income statement Other notes Risk management Capital
management Operating result Company financial statements
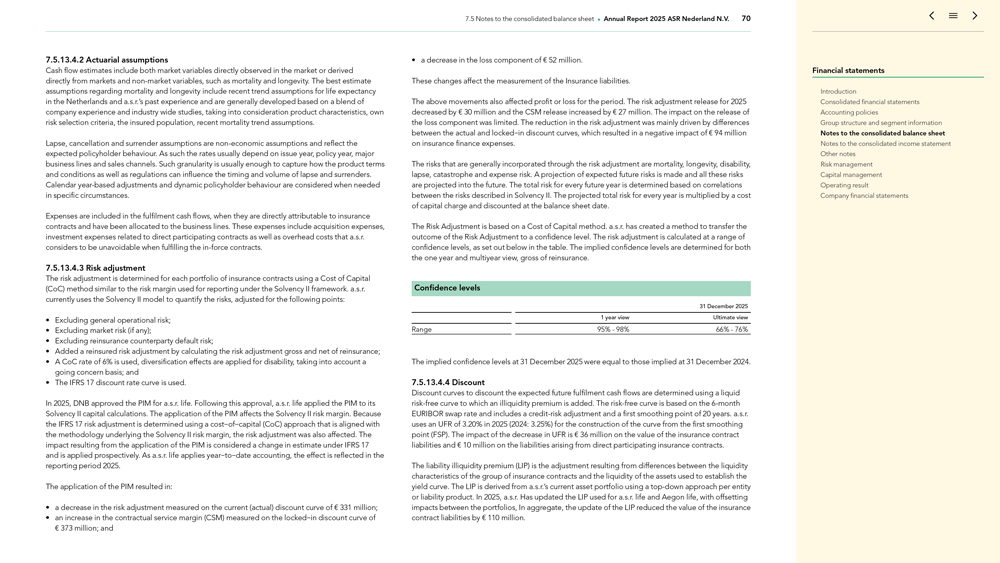
7.5 Notes to the consolidated balance sheet Annual Report 2025 ASR Nederland N.V. 70 7.5.13.4.2 Actuarial
assumptions Cash flow estimates include both market variables directly observed in the market or derived directly from markets and non-market variables, such as mortality and longevity. The best estimate
assumptions regarding mortality and longevity include recent trend assumptions for life expectancy in the Netherlands and a.s.r.’s past experience and are generally developed based on a blend of company experience and industry wide studies,
taking into consideration product characteristics, own risk selection criteria, the insured population, recent mortality trend assumptions. Lapse, cancellation and surrender assumptions are non-economic
assumptions and reflect the expected policyholder behaviour. As such the rates usually depend on issue year, policy year, major business lines and sales channels. Such granularity is usually enough to capture how the product terms and conditions as
well as regulations can influence the timing and volume of lapse and surrenders. Calendar year-based adjustments and dynamic policyholder behaviour are considered when needed in specific circumstances. Expenses are included in the fulfilment cash
flows, when they are directly attributable to insurance contracts and have been allocated to the business lines. These expenses include acquisition expenses, investment expenses related to direct participating contracts as well as overhead costs
that a.s.r. considers to be unavoidable when fulfilling the in-force contracts. 7.5.13.4.3 Risk adjustment The risk adjustment is determined for each portfolio of insurance contracts using a Cost of Capital
(CoC) method similar to the risk margin used for reporting under the Solvency II framework. a.s.r. currently uses the Solvency II model to quantify the risks, adjusted for the following points: Excluding general operational risk; Excluding market
risk (if any); Excluding reinsurance counterparty default risk; Added a reinsured risk adjustment by calculating the risk adjustment gross and net of reinsurance; A CoC rate of 6% is used, diversification effects are applied for disability, taking
into account a going concern basis; and The IFRS 17 discount rate curve is used. In 2025, DNB approved the PIM for a.s.r. life. Following this approval, a.s.r. life applied the PIM to its Solvency II capital calculations. The application of the PIM
affects the Solvency II risk margin. Because the IFRS 17 risk adjustment is determined using a cost-of-capital (CoC) approach that is aligned with the methodology underlying the Solvency II risk margin, the risk adjustment was also affected.
The impact resulting from the application of the PIM is considered a change in estimate under IFRS 17 and is applied prospectively. As a.s.r. life applies year-to-date accounting, the effect is reflected in the reporting period 2025. The
application of the PIM resulted in: a decrease in the risk adjustment measured on the current (actual) discount curve of € 331 million; an increase in the contractual service margin (CSM) measured on the locked-in discount curve of
€ 373 million; and a decrease in the loss component of € 52 million. These changes affect the measurement of the Insurance liabilities. The above movements also affected profit or loss for the period. The risk
adjustment release for 2025 decreased by € 30 million and the CSM release increased by € 27 million. The impact on the release of the loss component was limited. The reduction in the risk adjustment was mainly driven by
differences between the actual and locked-in discount curves, which resulted in a negative impact of € 94 million on insurance finance expenses. The risks that are generally incorporated through the risk adjustment are mortality,
longevity, disability, lapse, catastrophe and expense risk. A projection of expected future risks is made and all these risks are projected into the future. The total risk for every future year is determined based on correlations between the risks
described in Solvency II. The projected total risk for every year is multiplied by a cost of capital charge and discounted at the balance sheet date. The Risk Adjustment is based on a Cost of Capital method. a.s.r. has created a method to transfer
the outcome of the Risk Adjustment to a confidence level. The risk adjustment is calculated at a range of confidence levels, as set out below in the table. The implied confidence levels are determined for both the one year and multiyear view, gross
of reinsurance. Confidence levels 31 December 2025 1 year view Ultimate view Range 95%—98% 66%—76% The implied confidence levels at 31 December 2025 were equal to those implied at 31 December 2024. 7.5.13.4.4 Discount
Discount curves to discount the expected future fulfilment cash flows are determined using a liquid risk-free curve to which an illiquidity premium is added. The risk-free curve is based on the 6-month EURIBOR
swap rate and includes a credit-risk adjustment and a first smoothing point of 20 years. a.s.r. uses an UFR of 3.20% in 2025 (2024: 3.25%) for the construction of the curve from the first smoothing point (FSP). The impact of the decrease in UFR is
€ 36 million on the value of the insurance contract liabilities and € 10 million on the liabilities arising from direct participating insurance contracts. The liability illiquidity premium (LIP) is the adjustment
resulting from differences between the liquidity characteristics of the group of insurance contracts and the liquidity of the assets used to establish the yield curve. The LIP is derived from a.s.r.’s current asset portfolio using a top-down approach per entity or liability product. In 2025, a.s.r. Has updated the LIP used for a.s.r. life and Aegon life, with offsetting impacts between the portfolios, In aggregate, the update of the LIP reduced
the value of the insurance contract liabilities by € 110 million. Financial statements Introduction Consolidated financial statements Accounting policies Group structure and segment information Notes to the consolidated balance sheet
Notes to the consolidated income statement Other notes Risk management Capital management Operating result Company financial statements
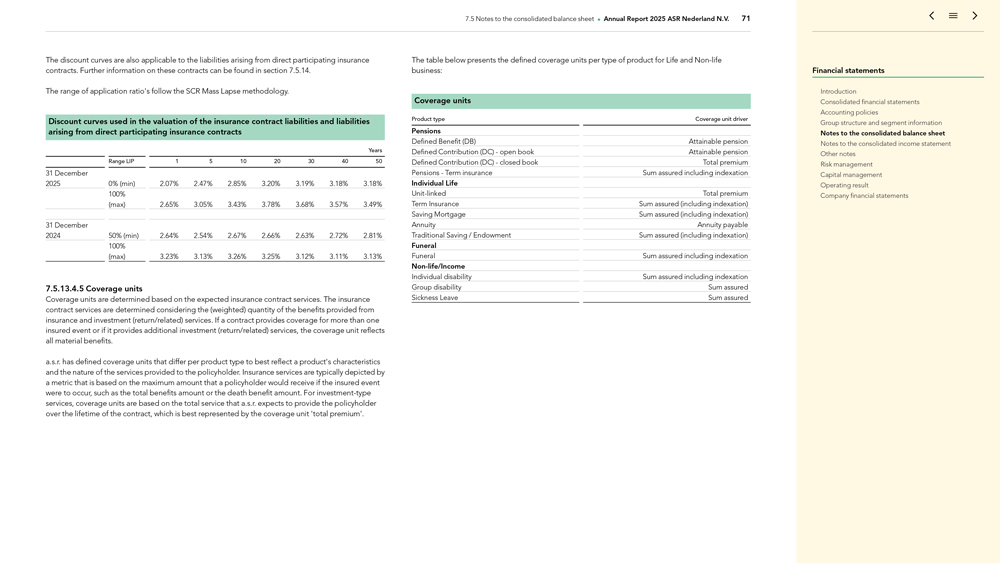
7.5 Notes to the consolidated balance sheet Annual Report 2025 ASR Nederland N.V. 71 The discount curves are
also applicable to the liabilities arising from direct participating insurance contracts. Further information on these contracts can be found in section 7.5.14. The range of application ratio’s follow the SCR Mass Lapse methodology. Discount
curves used in the valuation of the insurance contract liabilities and liabilities arising from direct participating insurance contracts Years Range LIP 1 5 10 20 30 40 50 31 December 2025 0% (min) 2.07% 2.47% 2.85% 3.20% 3.19% 3.18% 3.18% 100%
(max) 2.65% 3.05% 3.43% 3.78% 3.68% 3.57% 3.49% 31 December 2024 50% (min) 2.64% 2.54% 2.67% 2.66% 2.63% 2.72% 2.81% 100% (max) 3.23% 3.13% 3.26% 3.25% 3.12% 3.11% 3.13% 7.5.13.4.5 Coverage units Coverage units are determined based on the
expected insurance contract services. The insurance contract services are determined considering the (weighted) quantity of the benefits provided from insurance and investment (return/related) services. If a contract provides coverage for more than
one insured event or if it provides additional investment (return/related) services, the coverage unit reflects all material benefits. a.s.r. has defined coverage units that differ per product type to best reflect a product’s characteristics
and the nature of the services provided to the policyholder. Insurance services are typically depicted by a metric that is based on the maximum amount that a policyholder would receive if the insured event were to occur, such as the total benefits
amount or the death benefit amount. For investment-type services, coverage units are based on the total service that a.s.r. expects to provide the policyholder over the lifetime of the contract, which is best represented by the coverage unit
‘total premium’. The table below presents the defined coverage units per type of product for Life and Non-life business: Coverage units Product type Coverage unit driver Pensions Defined Benefit
(DB) Attainable pension Defined Contribution (DC)—open book Attainable pension Defined Contribution (DC)—closed book Total premium Pensions—Term insurance Sum assured including indexation Individual Life Unit-linked Total premium
Term Insurance Sum assured (including indexation) Saving Mortgage Sum assured (including indexation) Annuity Annuity payable Traditional Saving / Endowment Sum assured (including indexation) Funeral Funeral Sum assured including indexation Non-life/Income Individual disability Sum assured including indexation Group disability Sum assured Sickness Leave Sum assured Financial statements Introduction Consolidated financial statements Accounting policies
Group structure and segment information Notes to the consolidated balance sheet Notes to the consolidated income statement Other notes Risk management Capital management Operating result Company financial statements
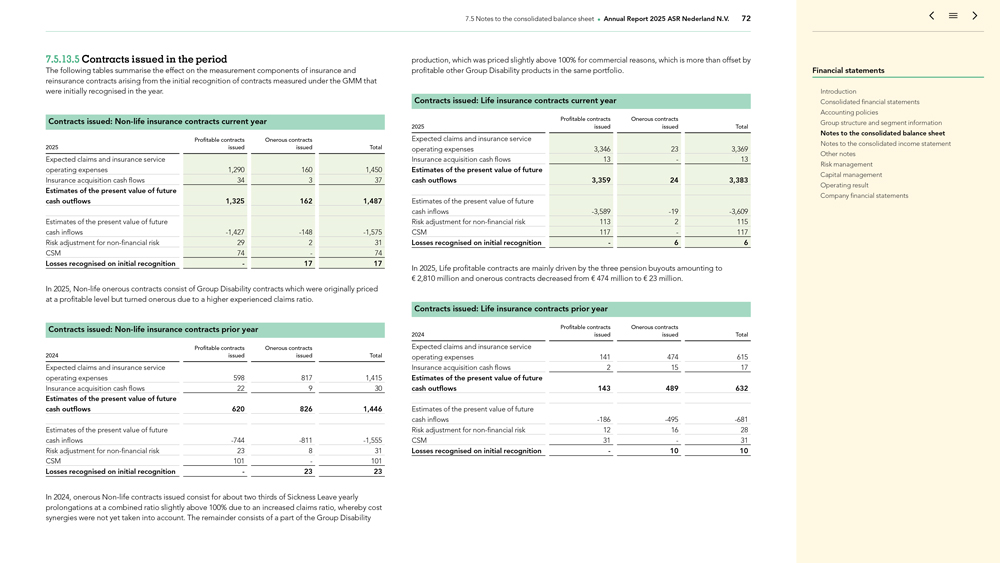
7.5 Notes to the consolidated balance sheet Annual Report 2025 ASR Nederland N.V. 72 7.5.13.5 Contracts issued
in the period The following tables summarise the effect on the measurement components of insurance and reinsurance contracts arising from the initial recognition of contracts measured under the GMM that were initially recognised in the year.
Contracts issued: Non-life insurance contracts current year Profitable contracts Onerous contracts 2025 issued issued Total Expected claims and insurance service operating expenses 1,290 160 1,450 Insurance
acquisition cash flows 34 3 37 Estimates of the present value of future cash outflows 1,325 162 1,487 Estimates of the present value of future cash inflows -1,427 -148 -1,575 Risk adjustment for non-financial risk 29 2 31 CSM 74—74 Losses recognised on initial recognition—17 17 In 2025,
Non-life onerous contracts consist of Group Disability contracts which were originally priced at a profitable level but turned onerous due to a higher experienced claims ratio. Contracts issued: Non-life insurance contracts prior year Profitable contracts Onerous contracts 2024 issued issued Total Expected claims and insurance service operating expenses 598 817 1,415 Insurance acquisition cash flows 22 9 30
Estimates of the present value of future cash outflows 620 826 1,446 Estimates of the present value of future cash inflows -744 -811
-1,555 Risk adjustment for non-financial risk 23 8 31 CSM 101—101 Losses recognised on initial recognition—23 23 In 2024, onerous Non-life contracts issued consist for about two thirds of Sickness Leave yearly prolongations at a combined ratio slightly above 100% due to an increased claims ratio, whereby cost synergies were not yet taken into
account. The remainder consists of a part of the Group Disability production, which was priced slightly above 100% for commercial reasons, which is more than offset by profitable other Group Disability products in the same portfolio. Contracts
issued: Life insurance contracts current year Profitable contracts Onerous contracts 2025 issued issued Total Expected claims and insurance service operating expenses 3,346 23 3,369 Insurance acquisition cash flows 13—13 Estimates of the
present value of future cash outflows 3,359 24 3,383 Estimates of the present value of future cash inflows -3,589 -19 -3,609 Risk
adjustment for non-financial risk 113 2 115 CSM 117—117 Losses recognised on initial recognition—6 6 In 2025, Life profitable contracts are mainly driven by the three pension buyouts amounting to
€ 2,810 million and onerous contracts decreased from € 474 million to € 23 million. Contracts issued: Life insurance contracts prior year Profitable contracts Onerous contracts 2024 issued issued Total
Expected claims and insurance service operating expenses 141 474 615 Insurance acquisition cash flows 2 15 17 Estimates of the present value of future cash outflows 143 489 632 Estimates of the present value of future cash inflows -186 -495 -681 Risk adjustment for non-financial risk 12 16 28 CSM 31—31 Losses
recognised on initial recognition—10 10 Financial statements Introduction Consolidated financial statements Accounting policies Group structure and segment information Notes to the consolidated balance sheet Notes to the consolidated income
statement Other notes Risk management Capital management Operating result Company financial statements
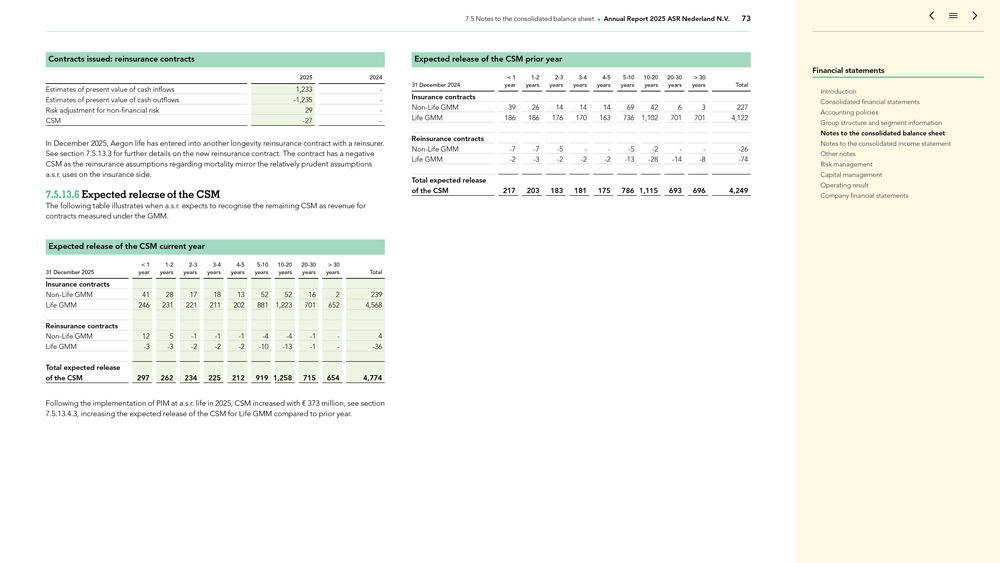
7.5 Notes to the consolidated balance sheet Annual Report 2025 ASR Nederland N.V. 73 Contracts issued:
reinsurance contracts 2025 2024 Estimates of present value of cash inflows 1,233 -Estimates of present value of cash outflows -1,235 -Risk adjustment for non-financial
risk 29 -CSM -27— In December 2025, Aegon life has entered into another longevity reinsurance contract with a reinsurer. See section 7.5.13.3 for further details
on the new reinsurance contract. The contract has a negative CSM as the reinsurance assumptions regarding mortality mirror the relatively prudent assumptions a.s.r. uses on the insurance side. 7.5.13.6 Expected release of the CSM The following table
illustrates when a.s.r. expects to recognise the remaining CSM as revenue for contracts measured under the GMM. Expected release of the CSM current year < 1 1-2 2-3 3-4 4-5 5-10 10-20 20-30 > 30 31 December 2025
year years years years years years years years years Total Insurance contracts Non-Life GMM 41 28 17 18 13 52 52 16 2 239 Life GMM 246 231 221 211 202 881 1,223 701 652 4,568 Reinsurance contracts Non-Life GMM 12 5 -1 -1 -1 -4 -4 -1—4 Life GMM -3 -3 -2 -2 -2 -10 -13
-1—-36 Total expected release of the CSM 297 262 234 225 212 919 1,258 715 654 4,774 Following the implementation of PIM at a.s.r. life in 2025, CSM increased with
€ 373 million, see section 7.5.13.4.3, increasing the expected release of the CSM for Life GMM compared to prior year. Expected release of the CSM prior year < 1 1-2 2-3 3-4 4-5 5-10 10-20
20-30 > 30 31 December 2024 year years years years years years years years years Total Insurance contracts Non-Life GMM 39 26 14 14 14 69 42 6 3 227 Life GMM 186
186 176 170 163 736 1,102 701 701 4,122 Reinsurance contracts Non-Life GMM -7 -7 -5
— -5 -2 — -26 Life GMM -2 -3 -2 -2 -2 -13 -28
-14 -8 -74 Total expected release of the CSM 217 203 183 181 175 786 1,115 693 696 4,249 Financial statements Introduction
Consolidated financial statements Accounting policies Group structure and segment information Notes to the consolidated balance sheet Notes to the consolidated income statement Other notes Risk management Capital management Operating result Company
financial statements
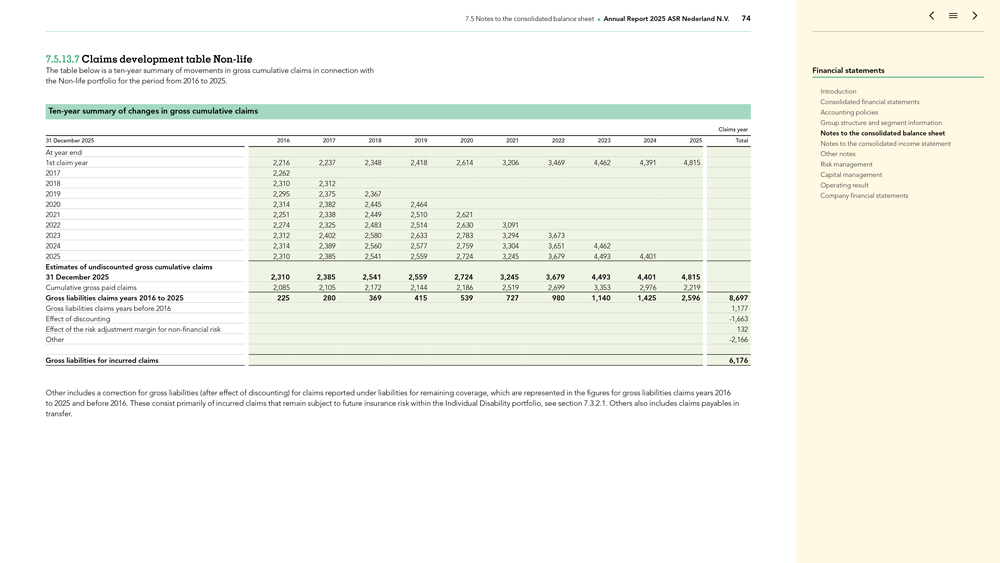
7.5 Notes to the consolidated balance sheet Annual Report 2025 ASR Nederland N.V. 74 7.5.13.7 Claims
development table Non-life The table below is a ten-year summary of movements in gross cumulative claims in connection with the
Non-life portfolio for the period from 2016 to 2025. Ten-year summary of changes in gross cumulative claims Claims year 31 December 2025 2016 2017 2018 2019 2020
2021 2022 2023 2024 2025 Total At year end 1st claim year 2,216 2,237 2,348 2,418 2,614 3,206 3,469 4,462 4,391 4,815 2017 2,262 2018 2,310 2,312 2019 2,295 2,375 2,367 2020 2,314 2,382 2,445 2,464 2021 2,251 2,338 2,449 2,510 2,621 2022 2,274 2,325
2,483 2,514 2,630 3,091 2023 2,312 2,402 2,580 2,633 2,783 3,294 3,673 2024 2,314 2,389 2,560 2,577 2,759 3,304 3,651 4,462 2025 2,310 2,385 2,541 2,559 2,724 3,245 3,679 4,493 4,401 Estimates of undiscounted gross cumulative claims 31 December
2025 2,310 2,385 2,541 2,559 2,724 3,245 3,679 4,493 4,401 4,815 Cumulative gross paid claims 2,085 2,105 2,172 2,144 2,186 2,519 2,699 3,353 2,976 2,219 Gross liabilities claims years 2016 to 2025 225 280 369 415 539 727 980 1,140 1,425 2,596 8,697
Gross liabilities claims years before 2016 1,177 Effect of discounting -1,663 Effect of the risk adjustment margin for non-financial risk 132 Other -2,166 Gross liabilities for incurred claims 6,176 Other includes a correction for gross liabilities (after effect of discounting) for claims reported under liabilities for remaining coverage, which are represented
in the figures for gross liabilities claims years 2016 to 2025 and before 2016. These consist primarily of incurred claims that remain subject to future insurance risk within the Individual Disability portfolio, see section 7.3.2.1. Others also
includes claims payables in transfer. Financial statements Introduction Consolidated financial statements Accounting policies Group structure and segment information Notes to the consolidated balance sheet Notes to the consolidated income statement
Other notes Risk management Capital management Operating result Company financial statements
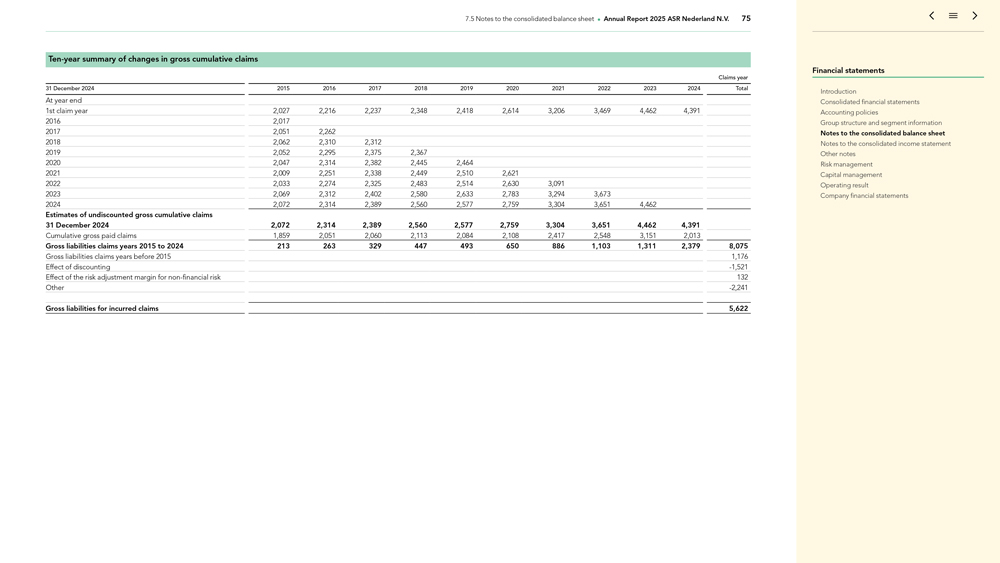
7.5 Notes to the consolidated balance sheet Annual Report 2025 ASR Nederland N.V. 75 Ten-year summary of changes in gross cumulative claims Claims year 31 December 2024 2015 2016 2017 2018 2019 2020 2021 2022 2023 2024 Total At year end 1st claim year 2,027 2,216 2,237 2,348 2,418 2,614 3,206
3,469 4,462 4,391 2016 2,017 2017 2,051 2,262 2018 2,062 2,310 2,312 2019 2,052 2,295 2,375 2,367 2020 2,047 2,314 2,382 2,445 2,464 2021 2,009 2,251 2,338 2,449 2,510 2,621 2022 2,033 2,274 2,325 2,483 2,514 2,630 3,091 2023 2,069 2,312 2,402 2,580
2,633 2,783 3,294 3,673 2024 2,072 2,314 2,389 2,560 2,577 2,759 3,304 3,651 4,462 Estimates of undiscounted gross cumulative claims 31 December 2024 2,072 2,314 2,389 2,560 2,577 2,759 3,304 3,651 4,462 4,391 Cumulative gross paid claims 1,859
2,051 2,060 2,113 2,084 2,108 2,417 2,548 3,151 2,013 Gross liabilities claims years 2015 to 2024 213 263 329 447 493 650 886 1,103 1,311 2,379 8,075 Gross liabilities claims years before 2015 1,176 Effect of discounting -1,521 Effect of the risk adjustment margin for non-financial risk 132 Other -2,241 Gross liabilities for incurred claims 5,622
Financial statements Introduction Consolidated financial statements Accounting policies Group structure and segment information Notes to the consolidated balance sheet Notes to the consolidated income statement Other notes Risk management Capital
management Operating result Company financial statements
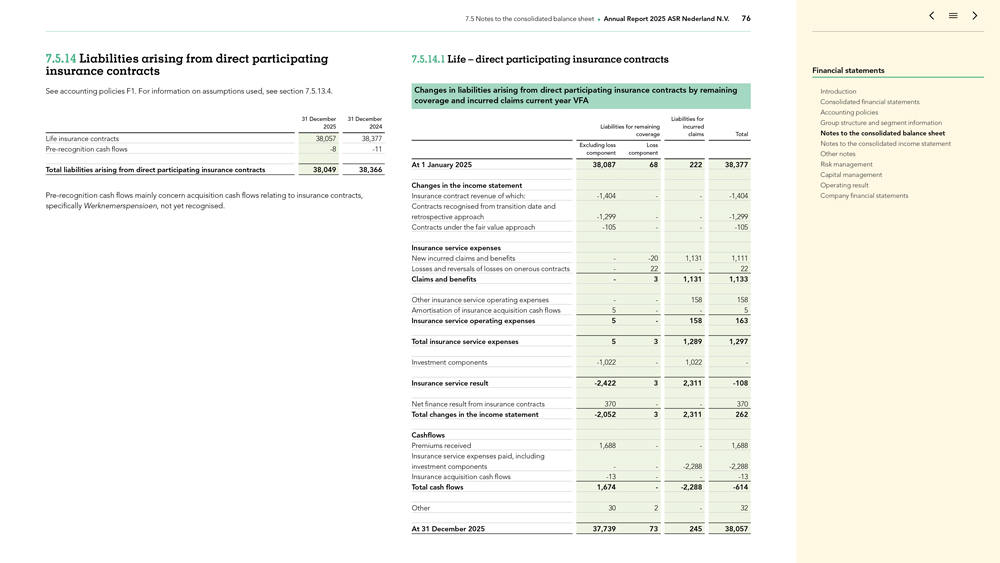
7.5 Notes to the consolidated balance sheet Annual Report 2025 ASR Nederland N.V. 76 7.5.14 insurance
Liabilities contracts arising from direct participating See accounting policies F1. For information on assumptions used, see section 7.5.13.4. 31 December 31 December 2025 2024 Life insurance contracts 38,057 38,377 Pre-recognition cash flows -8 -11 Total liabilities arising from direct participating insurance contracts 38,049 38,366 Pre-recognition cash flows mainly concern acquisition cash flows relating to insurance contracts, specifically Werknemerspensioen, not yet recognised. 7.5.14.1 Life – direct participating insurance contracts
Changes in liabilities arising from direct participating insurance contracts by remaining coverage and incurred claims current year VFA Liabilities for Liabilities for remaining incurred coverage claims Total Excluding loss Loss component component
At 1 January 2025 38,087 68 222 38,377 Changes in the income statement Insurance contract revenue of which: -1,404 — -1,404 Contracts recognised from
transition date and retrospective approach -1,299 — -1,299 Contracts under the fair value approach -105 — -105 Insurance service expenses New incurred claims and benefits—-20 1,131 1,111 Losses and reversals of losses on onerous contracts—22—22 Claims and
benefits—3 1,131 1,133 Other insurance service operating expenses — 158 158 Amortisation of insurance acquisition cash flows 5 — 5 Insurance service operating expenses 5—158 163 Total insurance service expenses 5 3 1,289
1,297 Investment components -1,022—1,022— Insurance service result -2,422 3 2,311 -108 Net finance result from
insurance contracts 370 — 370 Total changes in the income statement -2,052 3 2,311 262 Cashflows Premiums received 1,688 — 1,688 Insurance service expenses paid, including investment components
— -2,288 -2,288 Insurance acquisition cash flows -13 — -13 Total cash flows 1,674—-2,288 -614 Other 30 2—32 At 31 December 2025 37,739 73 245 38,057 Financial statements Introduction Consolidated financial statements Accounting
policies Group structure and segment information Notes to the consolidated balance sheet Notes to the consolidated income statement Other notes Risk management Capital management Operating result Company financial statements
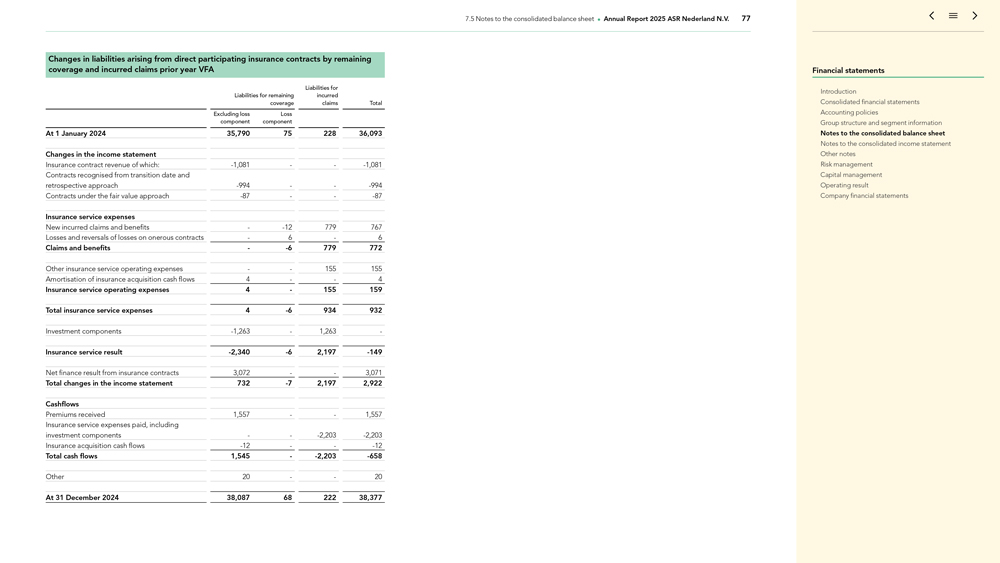
7.5 Notes to the consolidated balance sheet Annual Report 2025 ASR Nederland N.V. 77 Changes in liabilities
arising from direct participating insurance contracts by remaining coverage and incurred claims prior year VFA Liabilities for Liabilities for remaining incurred coverage claims Total Excluding loss Loss component component At 1 January 2024
35,790 75 228 36,093 Changes in the income statement Insurance contract revenue of which: -1,081 — -1,081 Contracts recognised from transition date and
retrospective approach -994 — -994 Contracts under the fair value approach -87 —
-87 Insurance service expenses New incurred claims and benefits—-12 779 767 Losses and reversals of losses on onerous contracts—6—6 Claims and benefits—-6 779 772 Other insurance service operating expenses — 155 155 Amortisation of insurance acquisition cash flows 4 — 4 Insurance service operating expenses 4—155 159 Total insurance
service expenses 4 -6 934 932 Investment components -1,263—1,263— Insurance service result -2,340 -6 2,197 -149 Net finance result from insurance contracts 3,072 — 3,071 Total changes in the income statement 732 -7 2,197 2,922
Cashflows Premiums received 1,557 — 1,557 Insurance service expenses paid, including investment components — -2,203 -2,203 Insurance acquisition cash flows -12 — -12 Total cash flows 1,545—-2,203 -658 Other 20 — 20 At
31 December 2024 38,087 68 222 38,377 Financial statements Introduction Consolidated financial statements Accounting policies Group structure and segment information Notes to the consolidated balance sheet Notes to the consolidated income
statement Other notes Risk management Capital management Operating result Company financial statements
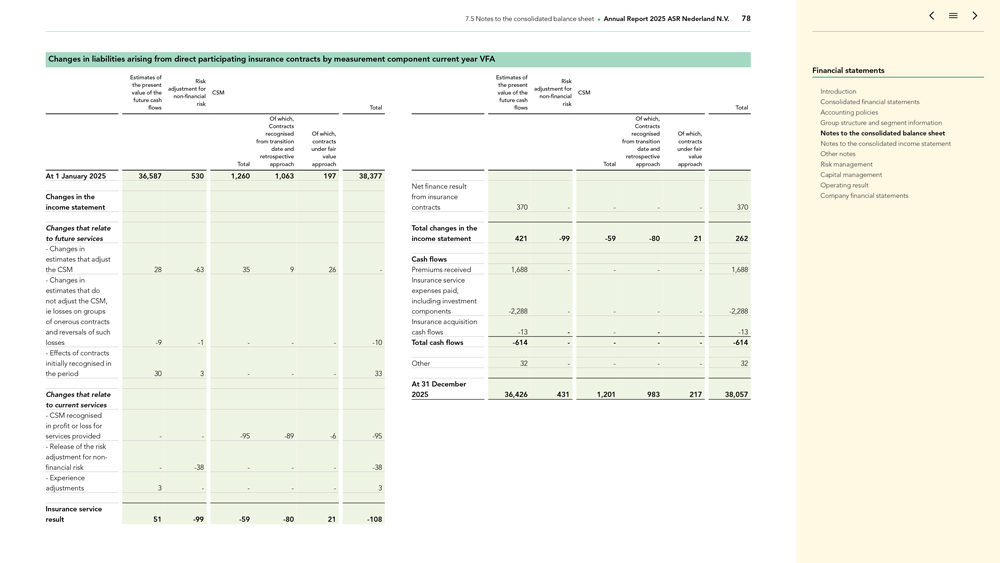
7.5 Notes to the consolidated balance sheet Annual Report 2025 ASR Nederland N.V. 78 Changes in liabilities
arising from direct participating insurance contracts by measurement component current year VFA Estimates of Risk the present adjustment for value of the CSM non-financial future cash risk flows Total Of
which, Contracts recognised Of which, from transition contracts date and under fair retrospective value Total approach approach At 1 January 2025 36,587 530 1,260 1,063 197 38,377 Changes in the income statement Changes that relate to future
services —Changes in estimates that adjust the CSM 28 -63 35 9 26 — Changes in estimates that do not adjust the CSM, ie losses on groups of onerous contracts and reversals of such losses -9 -1 ——-10—Effects of contracts initially recognised in the period 30 3 ——33 Changes that relate to
current services —CSM recognised in profit or loss for services provided — -95 -89 -6
-95—Release of the risk adjustment for non-financial risk—-38
——-38—Experience adjustments 3 — — 3 Insurance service result 51 -99 -59 -80 21 -108 Estimates of Risk the present adjustment for value of the CSM non-financial future cash risk flows Total Of which,
Contracts recognised Of which, from transition contracts date and under fair retrospective value Total approach approach Net finance result from insurance contracts 370 — — 370 Total changes in the income statement 421 -99 -59 -80 21 262 Cash flows Premiums received 1,688 — — 1,688 Insurance service expenses paid, including investment
components -2,288 — — -2,288 Insurance acquisition cash flows -13 — —
-13 Total cash flows -614 — — -614 Other 32 — — 32 At 31 December 2025 36,426 431 1,201 983 217
38,057 Financial statements Introduction Consolidated financial statements Accounting policies Group structure and segment information Notes to the consolidated balance sheet Notes to the consolidated income statement Other notes Risk management
Capital management Operating result Company financial statements
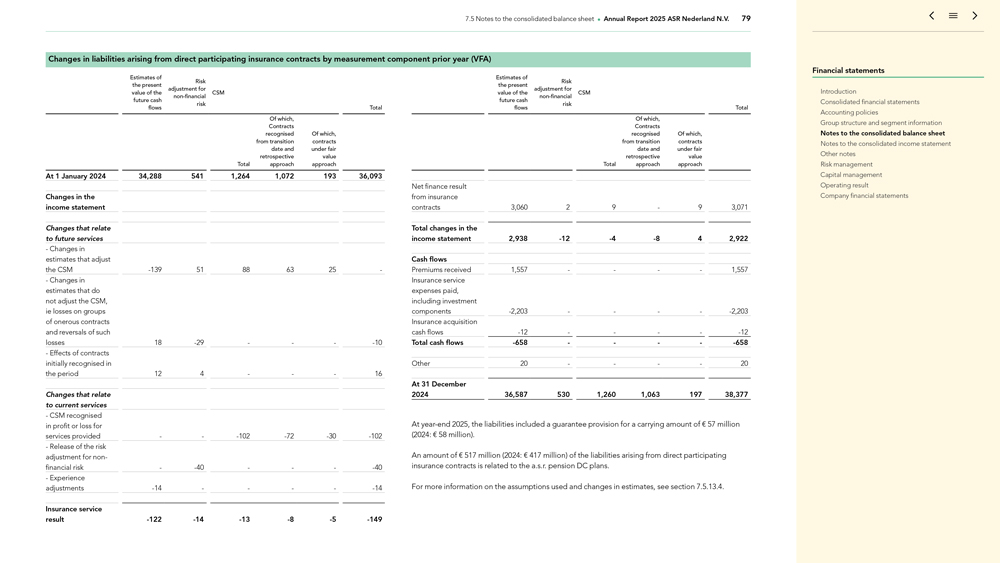
7.5 Notes to the consolidated balance sheet Annual Report 2025 ASR Nederland N.V. 79 Changes in liabilities
arising from direct participating insurance contracts by measurement component prior year (VFA) Estimates of Risk the present adjustment for value of the CSM non-financial future cash risk flows Total Of
which, Contracts recognised Of which, from transition contracts date and under fair retrospective value Total approach approach At 1 January 2024 34,288 541 1,264 1,072 193 36,093 Changes in the income statement Changes that relate to future
services —Changes in estimates that adjust the CSM -139 51 88 63 25 — Changes in estimates that do not adjust the CSM, ie losses on groups of onerous contracts and reversals of such losses 18 -29 ——-10—Effects of contracts initially recognised in the period 12 4 ——16 Changes that relate to current services —CSM recognised in
profit or loss for services provided — -102 -72 -30 -102—Release of the risk
adjustment for non-financial risk—-40 ——-40—Experience adjustments
-14 — — -14 Insurance service result -122 -14
-13 -8 -5 -149 Estimates of Risk the present adjustment for value of the CSM non-financial future cash risk flows Total Of which, Contracts recognised Of which, from transition contracts date and under fair retrospective value Total approach approach Net finance result from insurance
contracts 3,060 2 9—9 3,071 Total changes in the income statement 2,938 -12 -4 -8 4 2,922 Cash flows Premiums received
1,557 — — 1,557 Insurance service expenses paid, including investment components -2,203 — — -2,203 Insurance acquisition cash flows -12 — — -12 Total cash flows -658 — — -658 Other 20 — — 20
At 31 December 2024 36,587 530 1,260 1,063 197 38,377 At year-end 2025, the liabilities included a guarantee provision for a carrying amount of € 57 million (2024: € 58 million).
An amount of € 517 million (2024: € 417 million) of the liabilities arising from direct participating insurance contracts is related to the a.s.r. pension DC plans. For more information on the assumptions used and changes in
estimates, see section 7.5.13.4. Financial statements Introduction Consolidated financial statements Accounting policies Group structure and segment information Notes to the consolidated balance sheet Notes to the consolidated income statement Other
notes Risk management Capital management Operating result Company financial statements
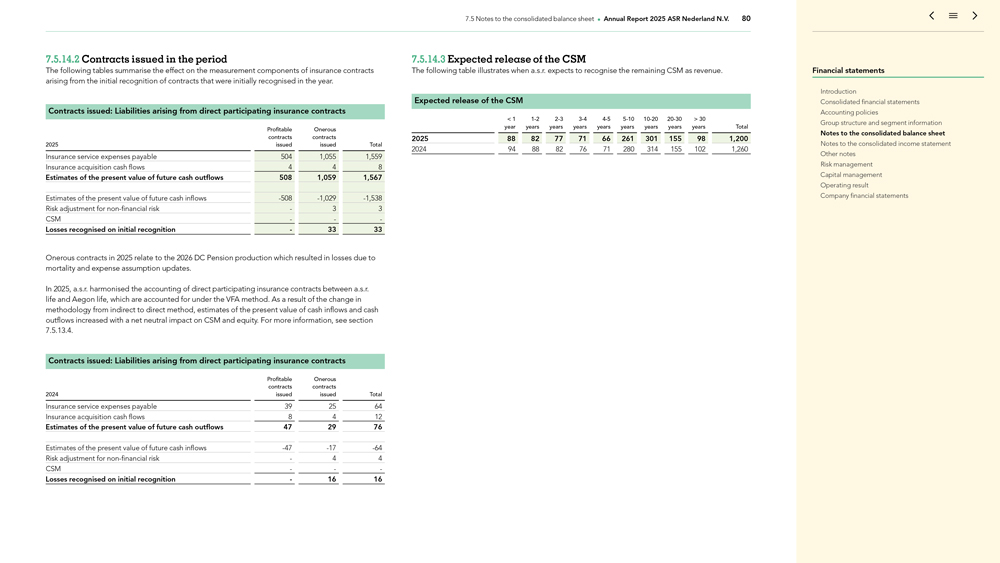
7.5 Notes to the consolidated balance sheet Annual Report 2025 ASR Nederland N.V. 80 7.5.14.2 Contracts issued
in the period The following tables summarise the effect on the measurement components of insurance contracts arising from the initial recognition of contracts that were initially recognised in the year. Contracts issued: Liabilities arising from
direct participating insurance contracts Profitable Onerous contracts contracts 2025 issued issued Total Insurance service expenses payable 504 1,055 1,559 Insurance acquisition cash flows 4 4 8 Estimates of the present value of future cash outflows
508 1,059 1,567 Estimates of the present value of future cash inflows -508 -1,029 -1,538 Risk adjustment for non-financial risk—3 3 CSM —— Losses recognised on initial recognition—33 33 Onerous contracts in 2025 relate to the 2026 DC Pension production which resulted in losses due to mortality and
expense assumption updates. In 2025, a.s.r. harmonised the accounting of direct participating insurance contracts between a.s.r. life and Aegon life, which are accounted for under the VFA method. As a result of the change in methodology from
indirect to direct method, estimates of the present value of cash inflows and cash outflows increased with a net neutral impact on CSM and equity. For more information, see section 7.5.13.4. Contracts issued: Liabilities arising from direct
participating insurance contracts Profitable Onerous contracts contracts 2024 issued issued Total Insurance service expenses payable 39 25 64 Insurance acquisition cash flows 8 4 12 Estimates of the present value of future cash outflows 47 29 76
Estimates of the present value of future cash inflows -47 -17 -64 Risk adjustment for
non-financial risk—4 4 CSM —— Losses recognised on initial recognition—16 16 7.5.14.3 Expected release of the CSM The following table illustrates when a.s.r. expects to recognise the
remaining CSM as revenue. Expected release of the CSM < 1 1-2 2-3 3-4 4-5 5-10 10-20 20-30 > 30 year years years years years years years years years Total 2025 88 82 77 71 66 261 301 155 98 1,200 2024 94 88
82 76 71 280 314 155 102 1,260 Financial statements Introduction Consolidated financial statements Accounting policies Group structure and segment information Notes to the consolidated balance sheet Notes to the consolidated income statement Other
notes Risk management Capital management Operating result Company financial statements
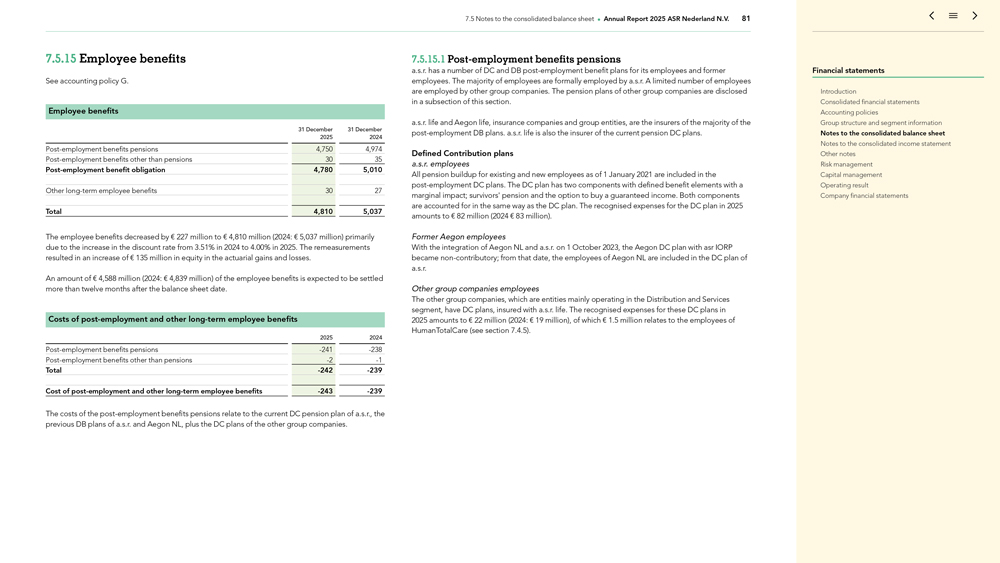
7.5 Notes to the consolidated balance sheet Annual Report 2025 ASR Nederland N.V. 81 7.5.15 Employee benefits
See accounting policy G. Employee benefits 31 December 31 December 2025 2024 Post-employment benefits pensions 4,750 4,974 Post-employment benefits other than pensions 30 35 Post-employment benefit obligation 4,780 5,010 Other long-term
employee benefits 30 27 Total 4,810 5,037 The employee benefits decreased by € 227 million to € 4,810 million (2024: € 5,037 million) primarily due to the increase in the discount rate from 3.51% in 2024 to
4.00% in 2025. The remeasurements resulted in an increase of € 135 million in equity in the actuarial gains and losses. An amount of € 4,588 million (2024: € 4,839 million) of the employee benefits is expected
to be settled more than twelve months after the balance sheet date. Costs of post-employment and other long-term employee benefits 2025 2024 Post-employment benefits pensions -241 -238 Post-employment benefits other than pensions -2 -1 Total -242 -239 Cost of post-employment and other long-term employee benefits -243 -239 The costs of the post-employment benefits pensions relate
to the current DC pension plan of a.s.r., the previous DB plans of a.s.r. and Aegon NL, plus the DC plans of the other group companies. 7.5.15.1 Post-employment benefits pensions a.s.r. has a number of DC and DB post-employment benefit plans for its
employees and former employees. The majority of employees are formally employed by a.s.r. A limited number of employees are employed by other group companies. The pension plans of other group companies are disclosed in a subsection of this section.
a.s.r. life and Aegon life, insurance companies and group entities, are the insurers of the majority of the post-employment DB plans. a.s.r. life is also the insurer of the current pension DC plans. Defined Contribution plans a.s.r. employees All
pension buildup for existing and new employees as of 1 January 2021 are included in the post-employment DC plans. The DC plan has two components with defined benefit elements with a marginal impact; survivors’ pension and the option to
buy a guaranteed income. Both components are accounted for in the same way as the DC plan. The recognised expenses for the DC plan in 2025 amounts to € 82 million (2024 € 83 million). Former Aegon employees With the
integration of Aegon NL and a.s.r. on 1 October 2023, the Aegon DC plan with asr IORP became non-contributory; from that date, the employees of Aegon NL are included in the DC plan of a.s.r. Other group
companies employees The other group companies, which are entities mainly operating in the Distribution and Services segment, have DC plans, insured with a.s.r. life. The recognised expenses for these DC plans in 2025 amounts to
€ 22 million (2024: € 19 million), of which € 1.5 million relates to the employees of HumanTotalCare (see section 7.4.5) . Financial statements Introduction Consolidated financial statements Accounting
policies Group structure and segment information Notes to the consolidated balance sheet Notes to the consolidated income statement Other notes Risk management Capital management Operating result Company financial statements
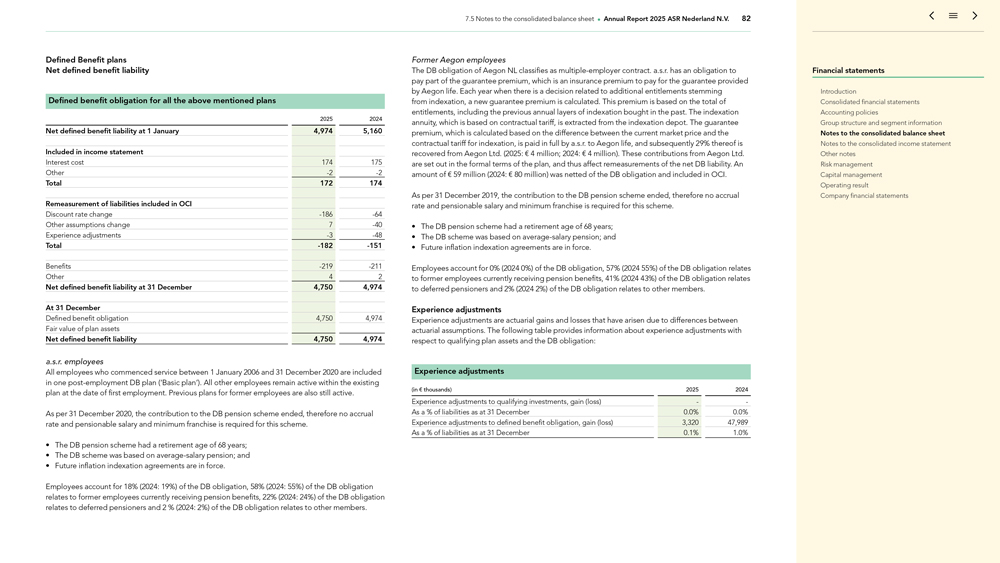
7.5 Notes to the consolidated balance sheet Annual Report 2025 ASR Nederland N.V. 82 Defined Benefit plans Net
defined benefit liability Defined benefit obligation for all the above mentioned plans 2025 2024 Net defined benefit liability at 1 January 4,974 5,160 Included in income statement Interest cost 174 175 Other
-2 -2 Total 172 174 Remeasurement of liabilities included in OCI Discount rate change -186
-64 Other assumptions change 7 -40 Experience adjustments -3 -48 Total -182 -151 Benefits -219 -211 Other 4 2 Net defined benefit liability at 31 December 4,750
4,974 At 31 December Defined benefit obligation 4,750 4,974 Fair value of plan assets Net defined benefit liability 4,750 4,974 a.s.r. employees All employees who commenced service between 1 January 2006 and 31 December 2020 are
included in one post-employment DB plan (‘Basic plan’). All other employees remain active within the existing plan at the date of first employment. Previous plans for former employees are also still active. As per 31 December 2020,
the contribution to the DB pension scheme ended, therefore no accrual rate and pensionable salary and minimum franchise is required for this scheme. The DB pension scheme had a retirement age of 68 years; The DB scheme was based on average-salary
pension; and Future inflation indexation agreements are in force. Employees account for 18% (2024: 19%) of the DB obligation, 58% (2024: 55%) of the DB obligation relates to former employees currently receiving pension benefits, 22% (2024: 24%) of
the DB obligation relates to deferred pensioners and 2 % (2024: 2%) of the DB obligation relates to other members. Former Aegon employees The DB obligation of Aegon NL classifies as multiple-employer contract. a.s.r. has an obligation to pay
part of the guarantee premium, which is an insurance premium to pay for the guarantee provided by Aegon life. Each year when there is a decision related to additional entitlements stemming from indexation, a new guarantee premium is calculated. This
premium is based on the total of entitlements, including the previous annual layers of indexation bought in the past. The indexation annuity, which is based on contractual tariff, is extracted from the indexation depot. The guarantee premium, which
is calculated based on the difference between the current market price and the contractual tariff for indexation, is paid in full by a.s.r. to Aegon life, and subsequently 29% thereof is recovered from Aegon Ltd. (2025: € 4 million;
2024: € 4 million). These contributions from Aegon Ltd. are set out in the formal terms of the plan, and thus affect remeasurements of the net DB liability. An amount of € 59 million (2024: € 80 million) was netted
of the DB obligation and included in OCI. As per 31 December 2019, the contribution to the DB pension scheme ended, therefore no accrual rate and pensionable salary and minimum franchise is required for this scheme. The DB pension scheme had a
retirement age of 68 years; The DB scheme was based on average-salary pension; and Future inflation indexation agreements are in force. Employees account for 0% (2024 0%) of the DB obligation, 57% (2024 55%) of the DB obligation relates to former
employees currently receiving pension benefits, 41% (2024 43%) of the DB obligation relates to deferred pensioners and 2% (2024 2%) of the DB obligation relates to other members. Experience adjustments Experience adjustments are actuarial gains and
losses that have arisen due to differences between actuarial assumptions. The following table provides information about experience adjustments with respect to qualifying plan assets and the DB obligation: Experience adjustments (in
€ thousands) 2025 2024 Experience adjustments to qualifying investments, gain (loss)—-As a % of liabilities as at 31 December 0.0% 0.0% Experience adjustments to defined benefit
obligation, gain (loss) 3,320 47,989 As a % of liabilities as at 31 December 0.1% 1.0% Financial statements Introduction Consolidated financial statements Accounting policies Group structure and segment information Notes to the consolidated
balance sheet Notes to the consolidated income statement Other notes Risk management Capital management Operating result Company financial statements
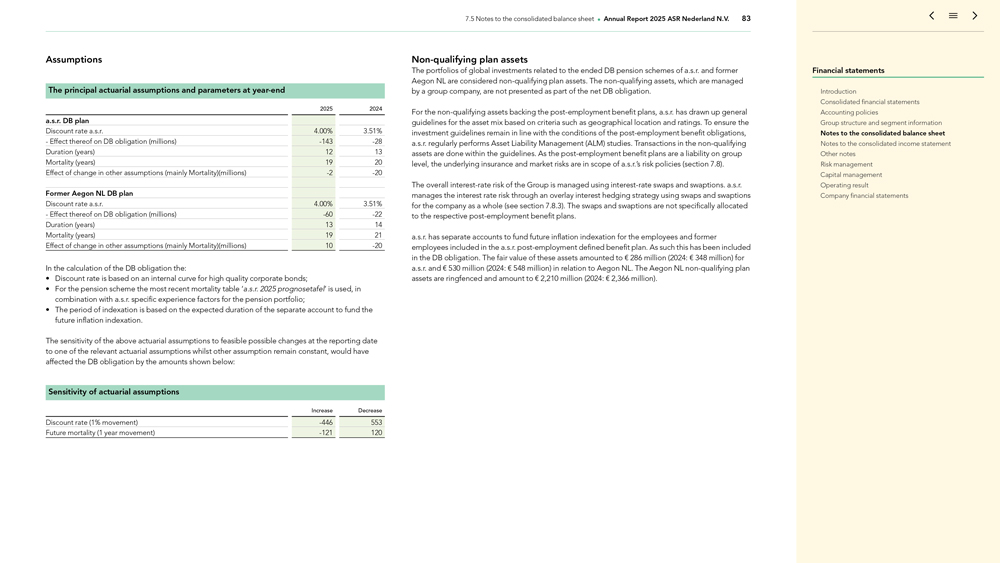
7.5 Notes to the consolidated balance sheet Annual Report 2025 ASR Nederland N.V. 83 Assumptions The principal
actuarial assumptions and parameters at year-end 2025 2024 a.s.r. DB plan Discount rate a.s.r. 4.00% 3.51%—Effect thereof on DB obligation (millions) -143 -28 Duration (years) 12 13 Mortality (years) 19 20 Effect of change in other assumptions (mainly Mortality)(millions) -2 -20 Former
Aegon NL DB plan Discount rate a.s.r. 4.00% 3.51%—Effect thereof on DB obligation (millions) -60 -22 Duration (years) 13 14 Mortality (years) 19 21 Effect of
change in other assumptions (mainly Mortality)(millions) 10 -20 In the calculation of the DB obligation the: Discount rate is based on an internal curve for high quality corporate bonds; For the pension scheme
the most recent mortality table ‘a.s.r. 2025 prognosetafel’ is used, in combination with a.s.r. specific experience factors for the pension portfolio; The period of indexation is based on the expected duration of the separate account to
fund the future inflation indexation. The sensitivity of the above actuarial assumptions to feasible possible changes at the reporting date to one of the relevant actuarial assumptions whilst other assumption remain constant, would have affected the
DB obligation by the amounts shown below: Sensitivity of actuarial assumptions Increase Decrease Discount rate (1% movement) -446 553 Future mortality (1 year movement)
-121 120 Non-qualifying plan assets The portfolios of global investments related to the ended DB pension schemes of a.s.r. and former Aegon NL are considered non-qualifying plan assets. The non-qualifying assets, which are managed by a group company, are not presented as part of the net DB obligation. For the non-qualifying assets backing the post-employment benefit plans, a.s.r. has drawn up general guidelines for the asset mix based on criteria such as geographical location and ratings. To ensure the investment
guidelines remain in line with the conditions of the post-employment benefit obligations, a.s.r. regularly performs Asset Liability Management (ALM) studies. Transactions in the non-qualifying assets are done
within the guidelines. As the post-employment benefit plans are a liability on group level, the underlying insurance and market risks are in scope of a.s.r.’s risk policies (section 7.8) . The overall interest-rate risk of the Group is managed
using interest-rate swaps and swaptions. a.s.r. manages the interest rate risk through an overlay interest hedging strategy using swaps and swaptions for the company as a whole (see section 7.8.3) . The swaps and swaptions are not specifically
allocated to the respective post-employment benefit plans. a.s.r. has separate accounts to fund future inflation indexation for the employees and former employees included in the a.s.r. post-employment defined benefit plan. As such this has been
included in the DB obligation. The fair value of these assets amounted to € 286 million (2024: € 348 million) for a.s.r. and € 530 million (2024: € 548 million) in relation to Aegon NL. The Aegon NL non-qualifying plan assets are ringfenced and amount to € 2,210 million (2024: € 2,366 million). Financial statements Introduction Consolidated financial statements Accounting policies Group
structure and segment information Notes to the consolidated balance sheet Notes to the consolidated income statement Other notes Risk management Capital management Operating result Company financial statements
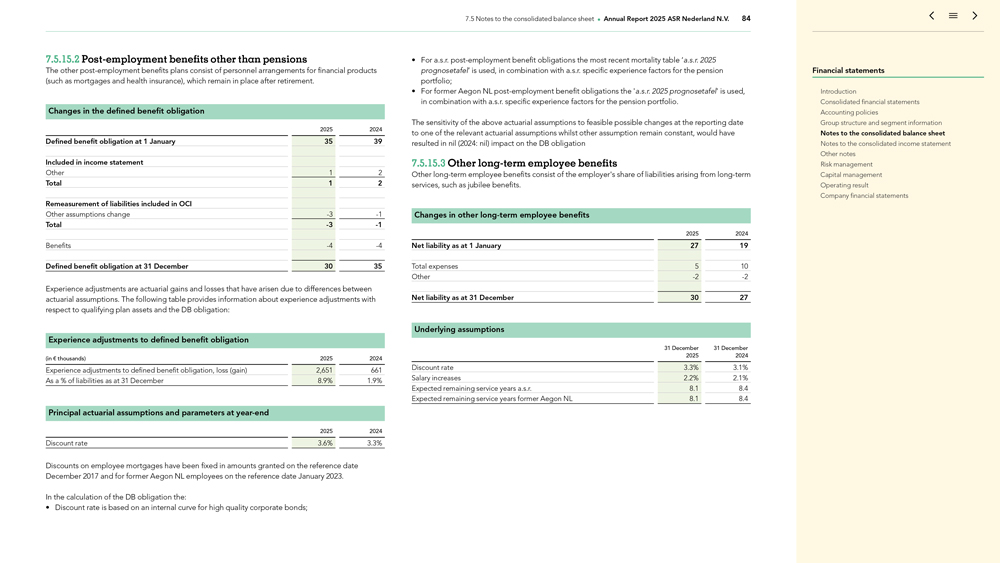
7.5 Notes to the consolidated balance sheet Annual Report 2025 ASR Nederland N.V. 84 7.5.15.2 Post-employment
benefits other than pensions The other post-employment benefits plans consist of personnel arrangements for financial products (such as mortgages and health insurance), which remain in place after retirement. Changes in the defined benefit
obligation 2025 2024 Defined benefit obligation at 1 January 35 39 Included in income statement Other 1 2 Total 1 2 Remeasurement of liabilities included in OCI Other assumptions change -3 -1 Total -3 -1 Benefits -4 -4 Defined benefit
obligation at 31 December 30 35 Experience adjustments are actuarial gains and losses that have arisen due to differences between actuarial assumptions. The following table provides information about experience adjustments with respect to
qualifying plan assets and the DB obligation: Experience adjustments to defined benefit obligation (in € thousands) 2025 2024 Experience adjustments to defined benefit obligation, loss (gain) 2,651 661 As a % of liabilities as at
31 December 8.9% 1.9% Principal actuarial assumptions and parameters at year-end 2025 2024 Discount rate 3.6% 3.3% Discounts on employee mortgages have been fixed in amounts granted on the reference date
December 2017 and for former Aegon NL employees on the reference date January 2023. In the calculation of the DB obligation the: Discount rate is based on an internal curve for high quality corporate bonds; For a.s.r. post-employment benefit
obligations the most recent mortality table ‘a.s.r. 2025 prognosetafel’ is used, in combination with a.s.r. specific experience factors for the pension portfolio; For former Aegon NL post-employment benefit obligations the ‘a.s.r.
2025 prognosetafel’ is used, in combination with a.s.r. specific experience factors for the pension portfolio. The sensitivity of the above actuarial assumptions to feasible possible changes at the reporting date to one of the relevant
actuarial assumptions whilst other assumption remain constant, would have resulted in nil (2024: nil) impact on the DB obligation 7.5.15.3 Other long-term employee benefits Other long-term employee benefits consist of the employer’s share of
liabilities arising from long-term services, such as jubilee benefits. Changes in other long-term employee benefits 2025 2024 Net liability as at 1 January 27 19 Total expenses 5 10 Other -2 -2 Net liability as at 31 December 30 27 Underlying assumptions 31 December 31 December 2025 2024 Discount rate 3.3% 3.1% Salary increases 2.2% 2.1% Expected remaining service years a.s.r. 8.1 8.4
Expected remaining service years former Aegon NL 8.1 8.4 Financial statements Introduction Consolidated financial statements Accounting policies Group structure and segment information Notes to the consolidated balance sheet Notes to the
consolidated income statement Other notes Risk management Capital management Operating result Company financial statements
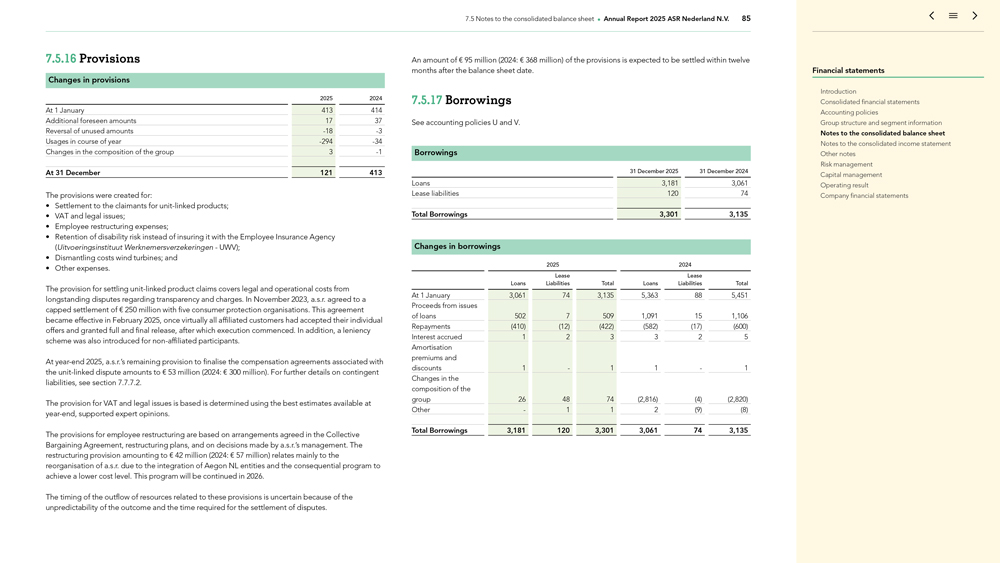
7.5 Notes to the consolidated balance sheet Annual Report 2025 ASR Nederland N.V. 85 7.5.16 Provisions Changes
in provisions 2025 2024 At 1 January 413 414 Additional foreseen amounts 17 37 Reversal of unused amounts -18 -3 Usages in course of year -294 -34 Changes in the composition of the group 3 -1 At 31 December 121 413 The provisions were created for: Settlement to the
claimants for unit-linked products; VAT and legal issues; Employee restructuring expenses; Retention of disability risk instead of insuring it with the Employee Insurance Agency (Uitvoeringsinstituut Werknemersverzekeringen—UWV); Dismantling
costs wind turbines; and Other expenses. The provision for settling unit-linked product claims covers legal and operational costs from longstanding disputes regarding transparency and charges. In November 2023, a.s.r. agreed to a capped settlement
of € 250 million with five consumer protection organisations. This agreement became effective in February 2025, once virtually all affiliated customers had accepted their individual offers and granted full and final release, after
which execution commenced. In addition, a leniency scheme was also introduced for non-affiliated participants. At year-end 2025, a.s.r.’s remaining provision to
finalise the compensation agreements associated with the unit-linked dispute amounts to € 53 million (2024: € 300 million). For further details on contingent liabilities, see section 7.7.7.2. The provision for VAT and legal
issues is based is determined using the best estimates available at year-end, supported expert opinions. The provisions for employee restructuring are based on arrangements agreed in the Collective Bargaining
Agreement, restructuring plans, and on decisions made by a.s.r.’s management. The restructuring provision amounting to € 42 million (2024: € 57 million) relates mainly to the reorganisation of a.s.r. due to the
integration of Aegon NL entities and the consequential program to achieve a lower cost level. This program will be continued in 2026. The timing of the outflow of resources related to these provisions is uncertain because of the
unpredictability of the outcome and the time required for the settlement of disputes. An amount of € 95 million (2024: € 368 million) of the provisions is expected to be settled within twelve months after the balance sheet
date. 7.5.17 Borrowings See accounting policies U and V. Borrowings 31 December 2025 31 December 2024 Loans 3,181 3,061 Lease liabilities 120 74 Total Borrowings 3,301 3,135 Changes in borrowings 2025 2024 Lease Lease Loans Liabilities
Total Loans Liabilities Total At 1 January 3,061 74 3,135 5,363 88 5,451 Proceeds from issues of loans 502 7 509 1,091 15 1,106 Repayments (410) (12) (422) (582) (17) (600) Interest accrued 1 2 3 3 2 5 Amortisation premiums and discounts
1—1 1—1 Changes in the composition of the group 26 48 74 (2,816) (4) (2,820) Other—1 1 2 (9) (8) Total Borrowings 3,181 120 3,301 3,061 74 3,135 Financial statements Introduction Consolidated financial statements Accounting
policies Group structure and segment information Notes to the consolidated balance sheet Notes to the consolidated income statement Other notes Risk management Capital management Operating result Company financial statements
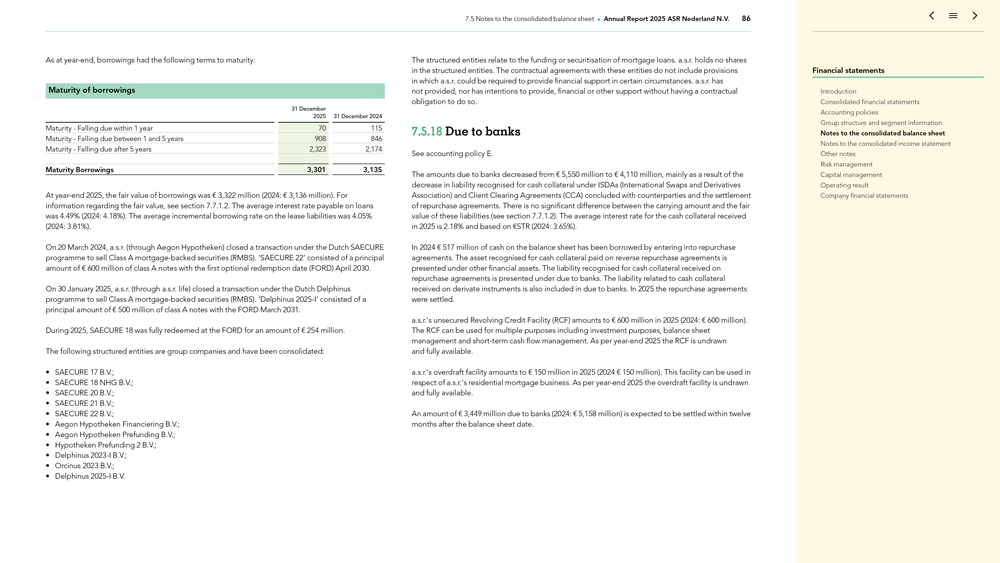
7.5 Notes to the consolidated balance sheet Annual Report 2025 ASR Nederland N.V. 86 As at year-end, borrowings had the following terms to maturity: Maturity of borrowings 31 December 2025 31 December 2024 Maturity—Falling due within 1 year 70 115 Maturity—Falling due between 1 and 5
years 908 846 Maturity—Falling due after 5 years 2,323 2,174 Maturity Borrowings 3,301 3,135 At year-end 2025, the fair value of borrowings was € 3,322 million (2024: € 3,136
million). For information regarding the fair value, see section 7.7.1.2. The average interest rate payable on loans was 4.49% (2024: 4.18%) . The average incremental borrowing rate on the lease liabilities was 4.05% (2024: 3.81%) . On 20 March
2024, a.s.r. (through Aegon Hypotheken) closed a transaction under the Dutch SAECURE programme to sell Class A mortgage-backed securities (RMBS). ‘SAECURE 22’ consisted of a principal amount of € 600 million of class
A notes with the first optional redemption date (FORD) April 2030. On 30 January 2025, a.s.r. (through a.s.r. life) closed a transaction under the Dutch Delphinus programme to sell Class A mortgage-backed securities (RMBS).
‘Delphinus 2025-I’ consisted of a principal amount of € 500 million of class A notes with the FORD March 2031. During 2025, SAECURE 18 was fully redeemed at the FORD for an amount of
€ 254 million. The following structured entities are group companies and have been consolidated: SAECURE 17 B.V.; SAECURE 18 NHG B.V.; SAECURE 20 B.V.; SAECURE 21 B.V.; SAECURE 22 B.V.; Aegon Hypotheken Financiering B.V.; Aegon
Hypotheken Prefunding B.V.; Hypotheken Prefunding 2 B.V.; Delphinus 2023-I B.V.; Orcinus 2023 B.V.; Delphinus 2025-I B.V. The structured entities relate to the funding
or securitisation of mortgage loans. a.s.r. holds no shares in the structured entities. The contractual agreements with these entities do not include provisions in which a.s.r. could be required to provide financial support in certain circumstances.
a.s.r. has not provided, nor has intentions to provide, financial or other support without having a contractual obligation to do so. 7.5.18 Due to banks See accounting policy E. The amounts due to banks decreased from € 5,550 million
to € 4,110 million, mainly as a result of the decrease in liability recognised for cash collateral under ISDAs (International Swaps and Derivatives Association) and Client Clearing Agreements (CCA) concluded with counterparties and
the settlement of repurchase agreements. There is no significant difference between the carrying amount and the fair value of these liabilities (see section 7.7.1.2) . The average interest rate for the cash collateral received in 2025 is 2.18% and
based on €STR (2024: 3.65%) . In 2024 € 517 million of cash on the balance sheet has been borrowed by entering into repurchase agreements. The asset recognised for cash collateral paid on reverse repurchase agreements is
presented under other financial assets. The liability recognised for cash collateral received on repurchase agreements is presented under due to banks. The liability related to cash collateral received on derivate instruments is also included in due
to banks. In 2025 the repurchase agreements were settled. a.s.r.’s unsecured Revolving Credit Facility (RCF) amounts to € 600 million in 2025 (2024: € 600 million). The RCF can be used for multiple purposes including
investment purposes, balance sheet management and short-term cash flow management. As per year-end 2025 the RCF is undrawn and fully available. a.s.r.’s overdraft facility amounts to
€ 150 million in 2025 (2024 € 150 million). This facility can be used in respect of a.s.r.’s residential mortgage business. As per year-end 2025 the overdraft facility is undrawn
and fully available. An amount of € 3,449 million due to banks (2024: € 5,158 million) is expected to be settled within twelve months after the balance sheet date. Financial statements Introduction Consolidated financial
statements Accounting policies Group structure and segment information Notes to the consolidated balance sheet Notes to the consolidated income statement Other notes Risk management Capital management Operating result Company financial statements
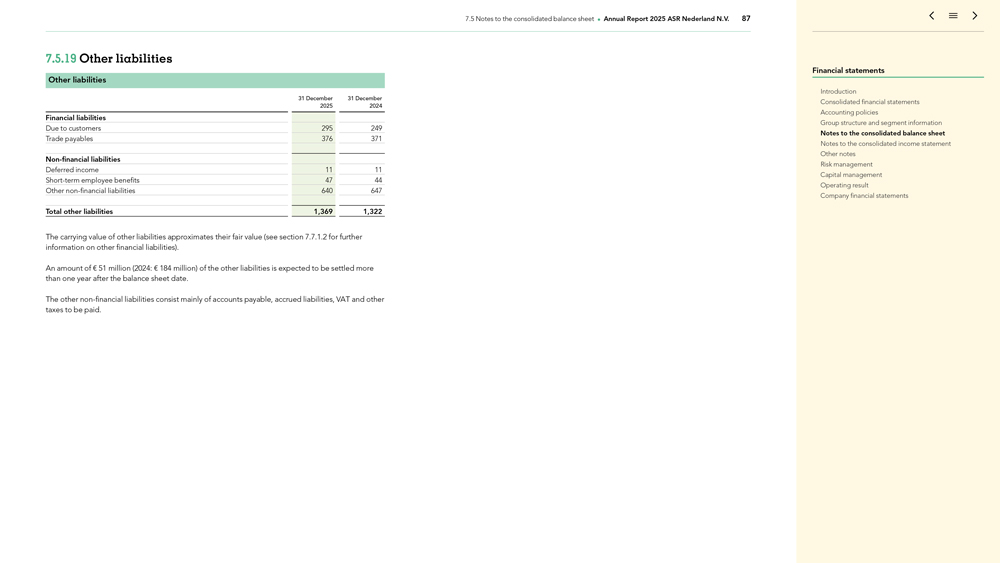
7.5 Notes to the consolidated balance sheet Annual Report 2025 ASR Nederland N.V. 87 7.5.19 Other liabilities
Other liabilities 31 December 31 December 2025 2024 Financial liabilities Due to customers 295 249 Trade payables 376 371 Non-financial liabilities Deferred income 11 11 Short-term employee benefits
47 44 Other non-financial liabilities 640 647 Total other liabilities 1,369 1,322 The carrying value of other liabilities approximates their fair value (see section 7.7.1.2 for further information on other
financial liabilities). An amount of € 51 million (2024: € 184 million) of the other liabilities is expected to be settled more than one year after the balance sheet date. The other
non-financial liabilities consist mainly of accounts payable, accrued liabilities, VAT and other taxes to be paid. Financial statements Introduction Consolidated financial statements Accounting policies Group
structure and segment information Notes to the consolidated balance sheet Notes to the consolidated income statement Other notes Risk management Capital management Operating result Company financial statements
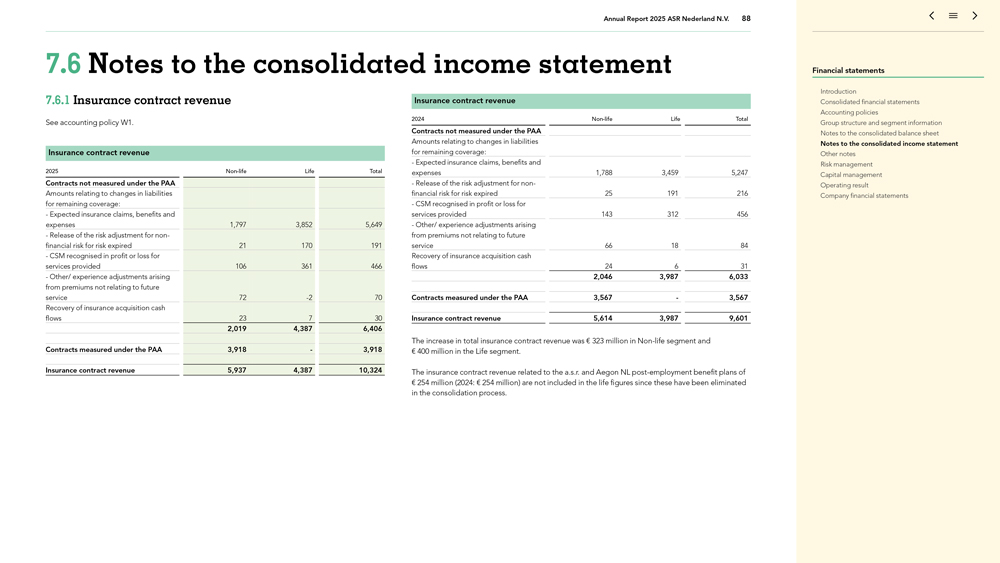
Annual Report 2025 ASR Nederland N.V. 88 7.6 Notes to the consolidated income statement 7.6.1 Insurance
contract revenue See accounting policy W1. Insurance contract revenue 2025 Non-life Life Total Contracts not measured under the PAA Amounts relating to changes in liabilities for remaining
coverage:—Expected insurance claims, benefits and expenses 1,797 3,852 5,649—Release of the risk adjustment for non-financial risk for risk expired 21 170 191—CSM recognised in profit or loss
for services provided 106 361 466—Other/ experience adjustments arising from premiums not relating to future service 72 -2 70 Recovery of insurance acquisition cash flows 23 7 30 2,019 4,387 6,406
Contracts measured under the PAA 3,918—3,918 Insurance contract revenue 5,937 4,387 10,324 Insurance contract revenue 2024 Non-life Life Total Contracts not measured under the PAA Amounts relating to
changes in liabilities for remaining coverage:—Expected insurance claims, benefits and expenses 1,788 3,459 5,247—Release of the risk adjustment for non-financial risk for risk expired 25 191
216—CSM recognised in profit or loss for services provided 143 312 456—Other/ experience adjustments arising from premiums not relating to future service 66 18 84 Recovery of insurance acquisition cash flows 24 6 31 2,046 3,987 6,033
Contracts measured under the PAA 3,567—3,567 Insurance contract revenue 5,614 3,987 9,601 The increase in total insurance contract revenue was € 323 million in Non-life segment and
€ 400 million in the Life segment. The insurance contract revenue related to the a.s.r. and Aegon NL post-employment benefit plans of € 254 million (2024: € 254 million) are not included in the life figures
since these have been eliminated in the consolidation process. Financial statements Introduction Consolidated financial statements Accounting policies Group structure and segment information Notes to the consolidated balance sheet Notes to the
consolidated income statement Other notes Risk management Capital management Operating result Company financial statements
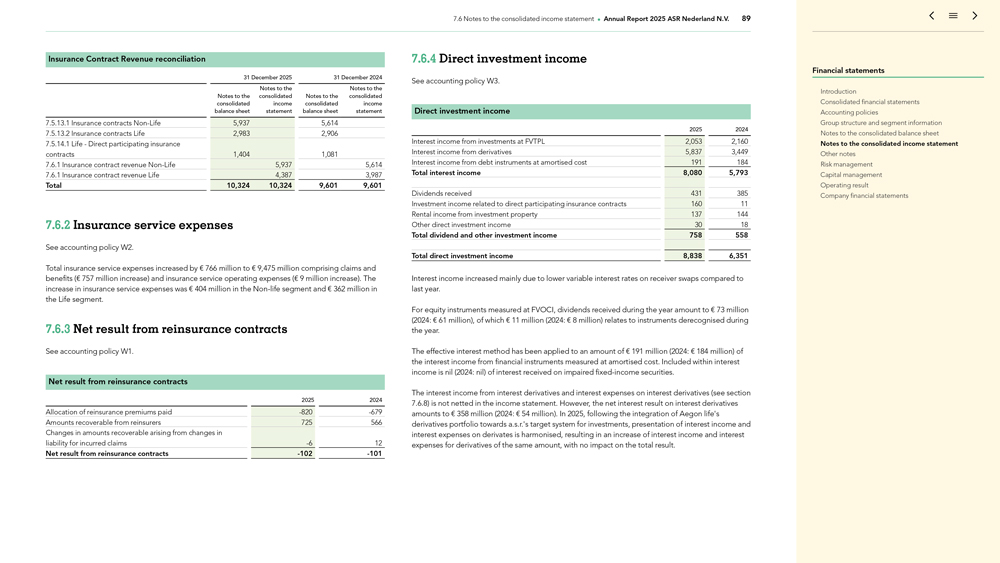
7.6 Notes to the consolidated income statement Annual Report 2025 ASR Nederland N.V. 89 Insurance Contract
Revenue reconciliation 31 December 2025 31 December 2024 Notes to the Notes to the Notes to the consolidated Notes to the consolidated consolidated income consolidated income balance sheet statement balance sheet statement 7.5.13.1
Insurance contracts Non-Life 5,937 5,614 7.5.13.2 Insurance contracts Life 2,983 2,906 7.5.14.1 Life—Direct participating insurance contracts 1,404 1,081 7.6.1 Insurance contract revenue Non-Life 5,937 5,614 7.6.1 Insurance contract revenue Life 4,387 3,987 Total 10,324 10,324 9,601 9,601 7.6.2 Insurance service expenses See accounting policy W2. Total insurance service expenses increased by
€ 766 million to € 9,475 million comprising claims and benefits (€ 757 million increase) and insurance service operating expenses (€ 9 million increase). The increase in insurance service
expenses was € 404 million in the Non-life segment and € 362 million in the Life segment. 7.6.3 Net result from reinsurance contracts See accounting policy W1. Net result from
reinsurance contracts 2025 2024 Allocation of reinsurance premiums paid -820 -679 Amounts recoverable from reinsurers 725 566 Changes in amounts recoverable arising from
changes in liability for incurred claims -6 12 Net result from reinsurance contracts -102 -101 7.6.4 Direct investment income See
accounting policy W3. Direct investment income 2025 2024 Interest income from investments at FVTPL 2,053 2,160 Interest income from derivatives 5,837 3,449 Interest income from debt instruments at amortised cost 191 184 Total interest income 8,080
5,793 Dividends received 431 385 Investment income related to direct participating insurance contracts 160 11 Rental income from investment property 137 144 Other direct investment income 30 18 Total dividend and other investment income 758 558
Total direct investment income 8,838 6,351 Interest income increased mainly due to lower variable interest rates on receiver swaps compared to last year. For equity instruments measured at FVOCI, dividends received during the year amount to
€ 73 million (2024: € 61 million), of which € 11 million (2024: € 8 million) relates to instruments derecognised during the year. The effective interest method has been applied to an amount of
€ 191 million (2024: € 184 million) of the interest income from financial instruments measured at amortised cost. Included within interest income is nil (2024: nil) of interest received on impaired fixed-income securities.
The interest income from interest derivatives and interest expenses on interest derivatives (see section 7.6.8) is not netted in the income statement. However, the net interest result on interest derivatives amounts to € 358 million
(2024: € 54 million). In 2025, following the integration of Aegon life’s derivatives portfolio towards a.s.r.’s target system for investments, presentation of interest income and interest expenses on derivates is harmonised,
resulting in an increase of interest income and interest expenses for derivatives of the same amount, with no impact on the total result. Financial statements Introduction Consolidated financial statements Accounting policies Group structure and
segment information Notes to the consolidated balance sheet Notes to the consolidated income statement Other notes Risk management Capital management Operating result Company financial statements
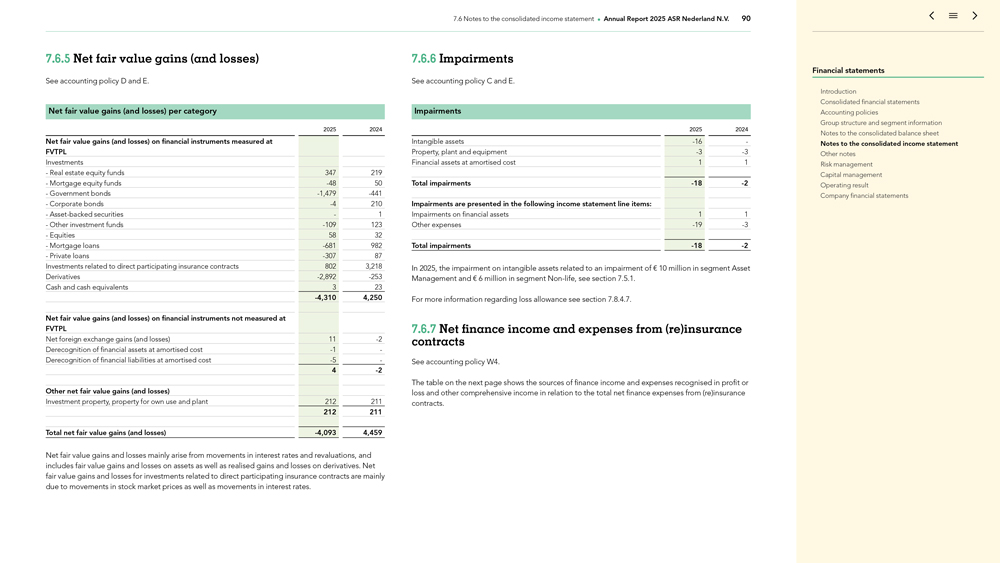
7.6 Notes to the consolidated income statement Annual Report 2025 ASR Nederland N.V. 90 7.6.5 Net fair value
gains (and losses) See accounting policy D and E. Net fair value gains (and losses) per category 2025 2024 Net fair value gains (and losses) on financial instruments measured at FVTPL Investments —Real estate equity funds 347
219—Mortgage equity funds -48 50—Government bonds -1,479 -441—Corporate bonds
-4 210—Asset-backed securities—1—Other investment funds -109 123—Equities 58 32—Mortgage loans -681
982—Private loans -307 87 Investments related to direct participating insurance contracts 802 3,218 Derivatives -2,892 -253
Cash and cash equivalents 3 23 -4,310 4,250 Net fair value gains (and losses) on financial instruments not measured at FVTPL Net foreign exchange gains (and losses) 11
-2 Derecognition of financial assets at amortised cost -1 -Derecognition of financial liabilities at amortised cost -5— 4 -2 Other net fair value gains (and losses) Investment property, property for own use and plant 212 211 212 211 Total net fair value gains (and losses) -4,093 4,459 Net fair
value gains and losses mainly arise from movements in interest rates and revaluations, and includes fair value gains and losses on assets as well as realised gains and losses on derivatives. Net fair value gains and losses for investments related to
direct participating insurance contracts are mainly due to movements in stock market prices as well as movements in interest rates. 7.6.6 Impairments See accounting policy C and E. Impairments 2025 2024 Intangible assets -16 -Property, plant and equipment -3 -3 Financial assets at amortised cost 1 1 Total impairments
-18 -2 Impairments are presented in the following income statement line items: Impairments on financial assets 1 1 Other expenses
-19 -3 Total impairments -18 -2 In 2025, the impairment on intangible assets related to
an impairment of € 10 million in segment Asset Management and € 6 million in segment Non-life, see section 7.5.1. For more information regarding loss allowance see section
7.8.4.7. 7.6.7 contracts Net finance income and expenses from (re)insurance See accounting policy W4. The table on the next page shows the sources of finance income and expenses recognised in profit or loss and other comprehensive income in relation
to the total net finance expenses from (re)insurance contracts. Financial statements Introduction Consolidated financial statements Accounting policies Group structure and segment information Notes to the consolidated balance sheet Notes to the
consolidated income statement Other notes Risk management Capital management Operating result Company financial statements
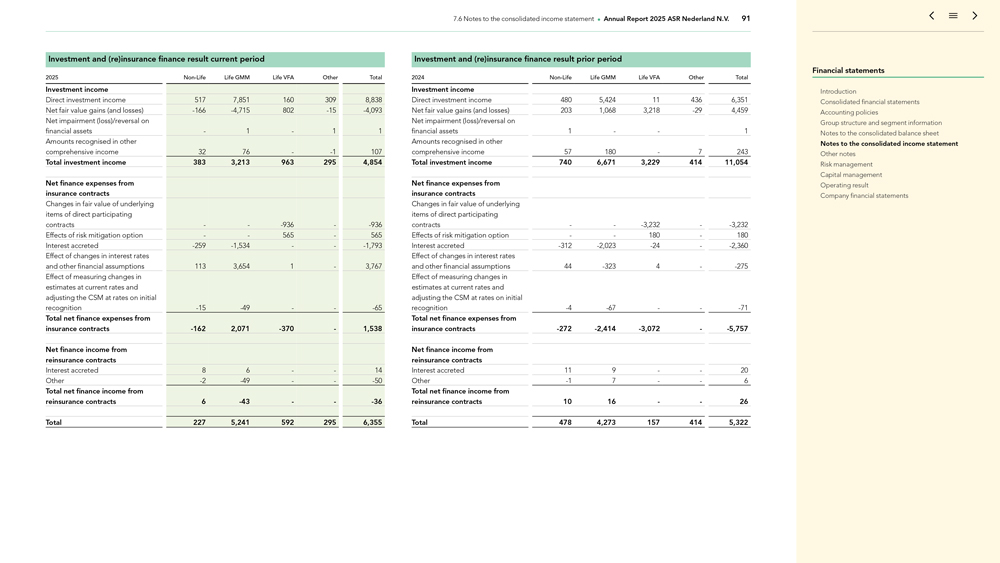
7.6 Notes to the consolidated income statement Annual Report 2025 ASR Nederland N.V. 91 Investment and
(re)insurance finance result current period 2025 Non-Life Life GMM Life VFA Other Total Investment income Direct investment income 517 7,851 160 309 8,838 Net fair value gains (and losses) -166 -4,715 802 -15 -4,093 Net impairment (loss)/reversal on financial assets—1—1 1
Amounts recognised in other comprehensive income 32 76—-1 107 Total investment income 383 3,213 963 295 4,854 Net finance expenses from insurance contracts Changes in fair value of underlying items of
direct participating contracts — -936—-936 Effects of risk mitigation option — 565—565 Interest accreted
-259 -1,534 — -1,793 Effect of changes in interest rates and other financial assumptions 113 3,654 1—3,767 Effect of
measuring changes in estimates at current rates and adjusting the CSM at rates on initial recognition -15 -49 — -65 Total
net finance expenses from insurance contracts -162 2,071 -370—1,538 Net finance income from reinsurance contracts Interest accreted 8 6 — 14 Other -2 -49 — -50 Total net finance income from reinsurance contracts 6 -43 — -36 Total 227 5,241 592 295 6,355 Investment and (re)insurance finance result prior period 2024 Non-Life Life GMM Life VFA Other Total Investment income Direct investment
income 480 5,424 11 436 6,351 Net fair value gains (and losses) 203 1,068 3,218 -29 4,459 Net impairment (loss)/reversal on financial assets 1 — 1 Amounts recognised in other comprehensive income 57
180—7 243 Total investment income 740 6,671 3,229 414 11,054 Net finance expenses from insurance contracts Changes in fair value of underlying items of direct participating contracts — -3,232—-3,232 Effects of risk mitigation option — 180—180 Interest accreted -312 -2,023 -24—-2,360 Effect of changes in interest rates and other financial assumptions 44 -323
4—-275 Effect of measuring changes in estimates at current rates and adjusting the CSM at rates on initial recognition -4
-67 — -71 Total net finance expenses from insurance contracts -272 -2,414 -3,072—-5,757 Net finance income from reinsurance contracts Interest accreted 11 9 — 20 Other -1 7 — 6 Total net
finance income from reinsurance contracts 10 16 — 26 Total 478 4,273 157 414 5,322 Financial statements Introduction Consolidated financial statements Accounting policies Group structure and segment information Notes to the consolidated
balance sheet Notes to the consolidated income statement Other notes Risk management Capital management Operating result Company financial statements
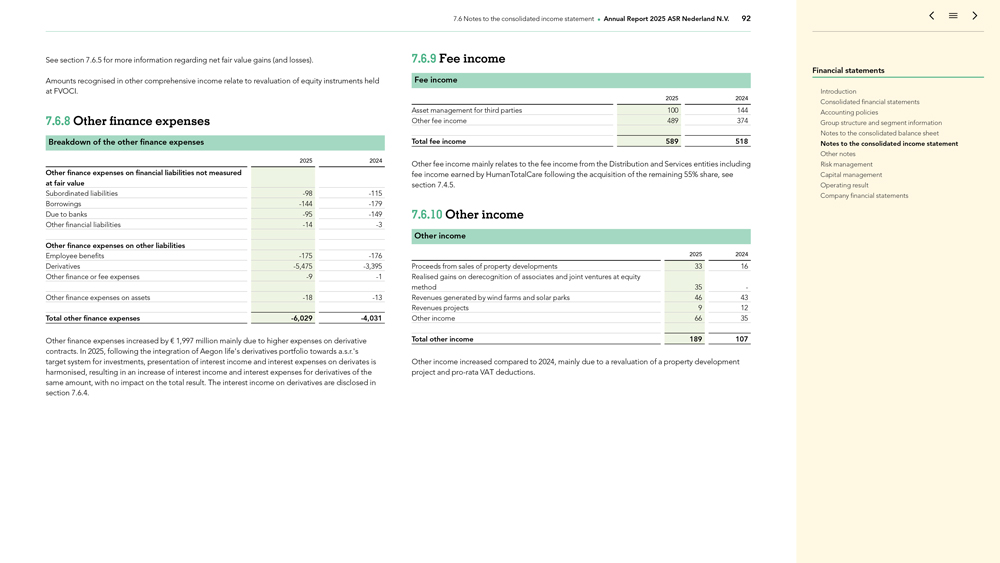
7.6 Notes to the consolidated income statement Annual Report 2025 ASR Nederland N.V. 92 See section 7.6.5 for
more information regarding net fair value gains (and losses). Amounts recognised in other comprehensive income relate to revaluation of equity instruments held at FVOCI. 7.6.8 Other finance expenses Breakdown of the other finance expenses 2025 2024
Other finance expenses on financial liabilities not measured at fair value Subordinated liabilities -98 -115 Borrowings -144 -179 Due to banks -95 -149 Other financial liabilities -14
-3 Other finance expenses on other liabilities Employee benefits -175 -176 Derivatives
-5,475 -3,395 Other finance or fee expenses -9 -1 Other finance expenses on assets -18 -13 Total other finance expenses -6,029 -4,031 Other finance expenses increased by
€ 1,997 million mainly due to higher expenses on derivative contracts. In 2025, following the integration of Aegon life’s derivatives portfolio towards a.s.r.’s target system for investments, presentation of interest
income and interest expenses on derivates is harmonised, resulting in an increase of interest income and interest expenses for derivatives of the same amount, with no impact on the total result. The interest income on derivatives are disclosed in
section 7.6.4. 7.6.9 Fee income Fee income 2025 2024 Asset management for third parties 100 144 Other fee income 489 374 Total fee income 589 518 Other fee income mainly relates to the fee income from the Distribution and Services entities including
fee income earned by HumanTotalCare following the acquisition of the remaining 55% share, see section 7.4.5. 7.6.10 Other income Other income 2025 2024 Proceeds from sales of property developments 33 16 Realised gains on derecognition of associates
and joint ventures at equity method 35 -Revenues generated by wind farms and solar parks 46 43 Revenues projects 9 12 Other income 66 35 Total other income 189 107 Other income increased compared to 2024, mainly due to a revaluation of a property
development project and pro-rata VAT deductions. Financial statements Introduction Consolidated financial statements Accounting policies Group structure and segment information Notes to the consolidated
balance sheet Notes to the consolidated income statement Other notes Risk management Capital management Operating result Company financial statements
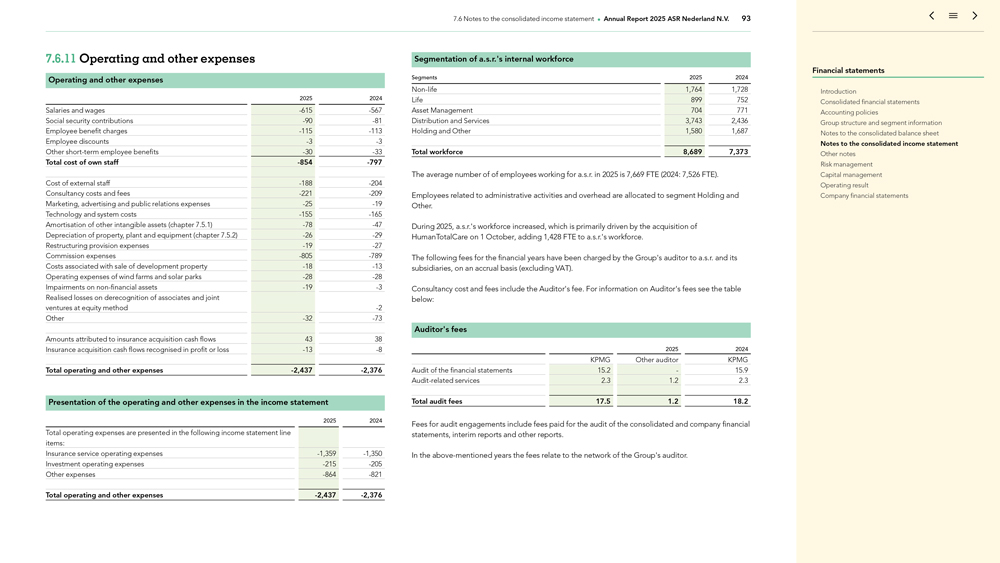
7.6 Notes to the consolidated income statement Annual Report 2025 ASR Nederland N.V. 93 7.6.11 Operating and
other expenses Operating and other expenses 2025 2024 Salaries and wages -615 -567 Social security contributions -90 -81 Employee benefit charges -115 -113 Employee discounts -3
-3 Other short-term employee benefits -30 -33 Total cost of own staff -854 -797 Cost of external staff -188 -204 Consultancy costs and fees -221 -209 Marketing, advertising and public relations expenses -25 -19 Technology and system costs
-155 -165 Amortisation of other intangible assets (chapter 7.5.1) -78 -47 Depreciation of
property, plant and equipment (chapter 7.5.2) -26 -29 Restructuring provision expenses -19
-27 Commission expenses -805 -789 Costs associated with sale of development property -18 -13 Operating expenses of wind farms and solar parks -28 -28 Impairments on non-financial
assets -19 -3 Realised losses on derecognition of associates and joint ventures at equity method -2 Other -32 -73 Amounts attributed to insurance acquisition cash flows 43 38 Insurance acquisition cash flows recognised in profit or loss -13 -8 Total operating and other expenses -2,437 -2,376 Presentation of the operating and other expenses in the income statement 2025 2024
Total operating expenses are presented in the following income statement line items: Insurance service operating expenses -1,359 -1,350 Investment operating expenses -215 -205 Other expenses -864 -821 Total operating and other expenses -2,437 -2,376 Segmentation of a.s.r.’s internal workforce Segments 2025 2024 Non-life 1,764 1,728 Life 899 752 Asset Management
704 771 Distribution and Services 3,743 2,436 Holding and Other 1,580 1,687 Total workforce 8,689 7,373 The average number of of employees working for a.s.r. in 2025 is 7,669 FTE (2024: 7,526 FTE). Employees related to administrative activities and
overhead are allocated to segment Holding and Other. During 2025, a.s.r.’s workforce increased, which is primarily driven by the acquisition of HumanTotalCare on 1 October, adding 1,428 FTE to a.s.r.’s workforce. The following fees
for the financial years have been charged by the Group’s auditor to a.s.r. and its subsidiaries, on an accrual basis (excluding VAT). Consultancy cost and fees include the Auditor’s fee. For information on Auditor’s fees see the
table below: Auditor’s fees 2025 2024 KPMG Other auditor KPMG Audit of the financial statements 15.2—15.9 Audit-related services 2.3 1.2 2.3 Total audit fees 17.5 1.2 18.2 Fees for audit engagements include fees paid for the audit of the
consolidated and company financial statements, interim reports and other reports. In the above-mentioned years the fees relate to the network of the Group’s auditor. Financial statements Introduction Consolidated financial statements
Accounting policies Group structure and segment information Notes to the consolidated balance sheet Notes to the consolidated income statement Other notes Risk management Capital management Operating result Company financial statements

7.6 Notes to the consolidated income statement Annual Report 2025 ASR Nederland N.V. 94 7.6.12 Income tax
expense Income tax (expense) / gain 2025 2024 Current taxes for the current period -199 -95 Current taxes referring to previous periods 26 156 Total current tax -172 62 Deferred taxes arising from current period 41 -448 Total deferred tax 41 -448 Total income tax (expense) / gain -131 -387 The expected income tax expense is determined by applying the tax rate in the Netherlands to the result before tax. In 2025, this rate was 25.8% (2024: 25.8%) . The
enacted tax rate for 2026 will be 25.8% . The impact of the current tax to previous periods is to a highly extent set off in the deferred taxes arising from current period. Reconciliation of expected income tax (expense) / gain with the actual
income tax (expense) / gain 2025 2024 Result before tax from continuing operations 696 1,464 Current tax rates 25,8% 25,8% Expected income tax expense -180 -378 Effects
of: Tax on interest on other equity instruments 21 15 Tax-exempt dividend 16 11 Tax-exempt capital gains 10 -1 Tax-exempt associates and joint ventures—2 Tax-exempt other income—-3 Changes in impairments
-2 -2 Adjustments for taxes due on previous financial years—-15 Other effects 4 -16
Total income tax (expense) / gain -131 -387 The result is almost entirely earned and taxable in the Netherlands. The effective income tax rate is 18.8% (2024: 26.4%) .
The decrease of the effective income tax rate is mostly driven by the decrease of the result before tax from continuing operations, while the total impact from tax exempt items increased, resulting in a relatively larger impact from tax exempt items
on the effective income tax rate. International Tax Reform – Pillar II Model rules (Amendments to IAS 12) The EU Directive Pillar Two, implemented in the Netherlands as the ‘Wet minimum belasting’, and is effective for accounting
periods beginning on or after 1 January 2024, applies to multinational enterprises and large-scale domestic groups with consolidated revenues of € 750 million or more in at least two out of the last four years. These revenues, as
defined by the OECD, include any form of income and are therefore not limited to revenue recognised in accordance with IFRS 15. a.s.r. operates in the Netherlands as a large-scale domestic group and should, in principle, be subject to the top-up tax rules under Pilar 2. a.s.r. has determined that any top-up tax due under Pillar 2 is an income tax within the scope of IAS 12 and accounts for it as a current tax
when it is incurred. However, a.s.r. has assessed the potential exposure to Pillar 2 and does not expect the impact of the Pillar 2 income taxes to be material. This is because a.s.r. can rely on: The domestic group exemption during the first five
years after the Pillar 2 legislation comes into effect; and The Transitional CbCR Safe Harbour rules during the first three years after the Pillar 2 legislation comes into effect, which allows a.s.r. to reduce the
top-up tax to zero. Although a.s.r. could reduce any top-up tax to zero during the first five years by applying a combination of the domestic group exemption and the
Transitional CbCR Safe Harbour rules, a.s.r. notes that it applies the temporary mandatory relief from recognising and disclosing information about deferred taxes related to Pillar 2 income taxes. a.s.r. will continue to monitor the developments of
Pillar 2 legislation, the applicability of the domestic group exemption, and the applicability of the CbCR Safe Harbour rules on the Group’s financial position. Financial statements Introduction Consolidated financial statements Accounting
policies Group structure and segment information Notes to the consolidated balance sheet Notes to the consolidated income statement Other notes Risk management Capital management Operating result Company financial statements
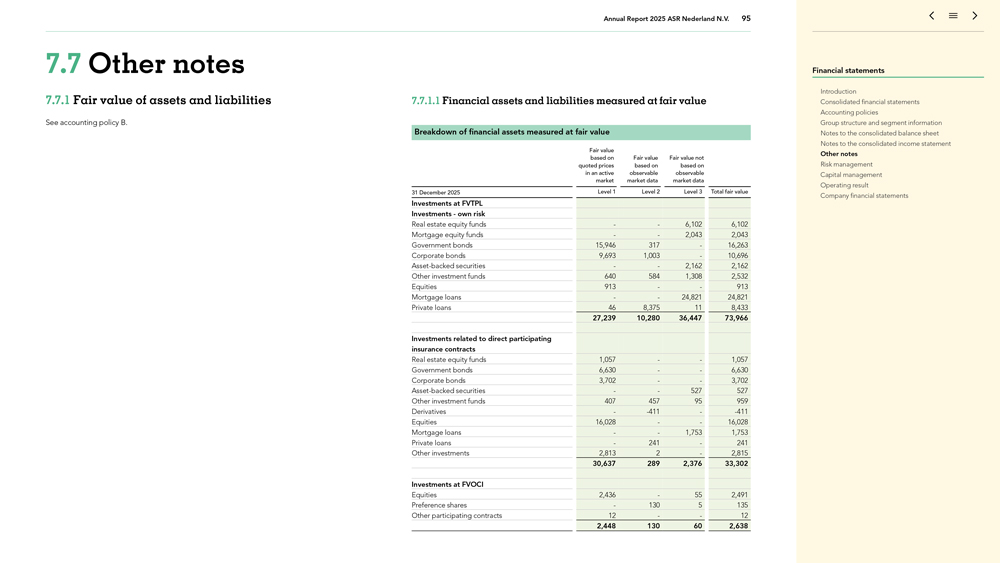
Annual Report 2025 ASR Nederland N.V. 95 7.7 Other notes 7.7.1 Fair value of assets and liabilities See
accounting policy B. 7.7.1.1 Financial assets and liabilities measured at fair value Breakdown of financial assets measured at fair value Fair value based on Fair value Fair value not quoted prices based on based on in an active observable
observable market market data market data 31 December 2025 Level 1 Level 2 Level 3 Total fair value Investments at FVTPL Investments—own risk Real estate equity funds — 6,102 6,102 Mortgage equity funds — 2,043
2,043 Government bonds 15,946 317—16,263 Corporate bonds 9,693 1,003—10,696 Asset-backed securities — 2,162 2,162 Other investment funds 640 584 1,308 2,532 Equities 913 — 913 Mortgage loans — 24,821 24,821 Private
loans 46 8,375 11 8,433 27,239 10,280 36,447 73,966 Investments related to direct participating insurance contracts Real estate equity funds 1,057 — 1,057 Government bonds 6,630 — 6,630 Corporate bonds 3,702 — 3,702 Asset-backed
securities — 527 527 Other investment funds 407 457 95 959 Derivatives—-411—-411 Equities 16,028 — 16,028 Mortgage loans — 1,753 1,753
Private loans—241—241 Other investments 2,813 2—2,815 30,637 289 2,376 33,302 Investments at FVOCI Equities 2,436—55 2,491 Preference shares—130 5 135 Other participating contracts 12 — 12 2,448 130 60 2,638
Financial statements Introduction Consolidated financial statements Accounting policies Group structure and segment information Notes to the consolidated balance sheet Notes to the consolidated income statement Other notes Risk management Capital
management Operating result Company financial statements
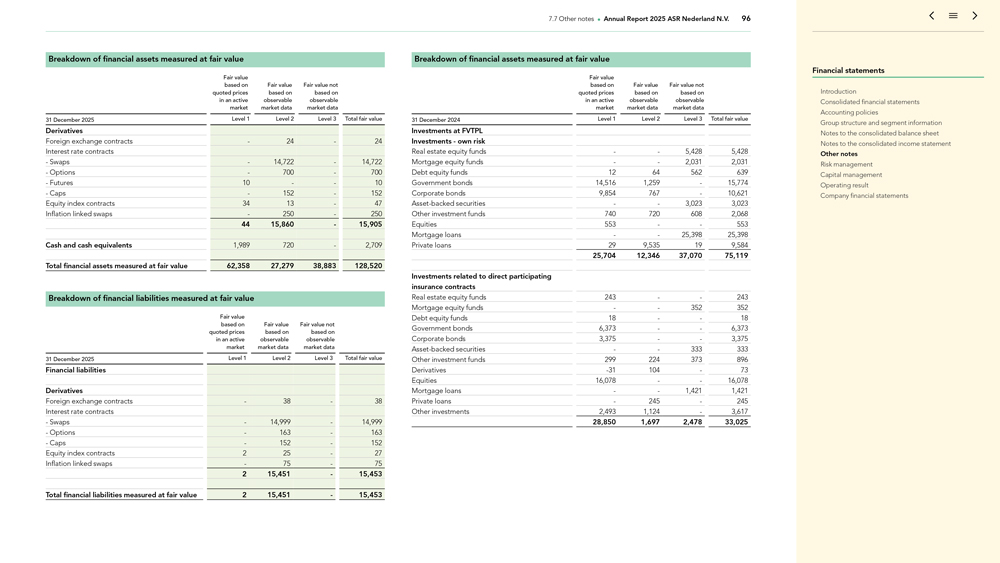
7.7 Other notes Annual Report 2025 ASR Nederland N.V. 96 Breakdown of financial assets measured at fair value
Fair value based on Fair value Fair value not quoted prices based on based on in an active observable observable market market data market data 31 December 2025 Level 1 Level 2 Level 3 Total fair value Derivatives Foreign
exchange contracts—24—24 Interest rate contracts—Swaps—14,722—14,722—Options—700—700—Futures 10 — 10—Caps—152—152 Equity index contracts 34 13—47 Inflation linked
swaps—250—250 44 15,860—15,905 Cash and cash equivalents 1,989 720—2,709 Total financial assets measured at fair value 62,358 27,279 38,883 128,520 Breakdown of financial liabilities measured at fair value Fair value based on
Fair value Fair value not quoted prices based on based on in an active observable observable market market data market data 31 December 2025 Level 1 Level 2 Level 3 Total fair value Financial liabilities Derivatives Foreign
exchange contracts—38—38 Interest rate contracts—Swaps—14,999—14,999—Options—163—163—Caps—152—152 Equity index contracts 2 25—27 Inflation linked swaps—75—75 2
15,451—15,453 Total financial liabilities measured at fair value 2 15,451—15,453 Breakdown of financial assets measured at fair value Fair value based on Fair value Fair value not quoted prices based on based on in an active observable
observable market market data market data 31 December 2024 Level 1 Level 2 Level 3 Total fair value Investments at FVTPL Investments—own risk Real estate equity funds — 5,428 5,428 Mortgage equity funds — 2,031
2,031 Debt equity funds 12 64 562 639 Government bonds 14,516 1,259—15,774 Corporate bonds 9,854 767—10,621 Asset-backed securities — 3,023 3,023 Other investment funds 740 720 608 2,068 Equities 553 — 553 Mortgage loans
— 25,398 25,398 Private loans 29 9,535 19 9,584 25,704 12,346 37,070 75,119 Investments related to direct participating insurance contracts Real estate equity funds 243 — 243 Mortgage equity funds — 352 352 Debt equity funds 18
— 18 Government bonds 6,373 — 6,373 Corporate bonds 3,375 — 3,375 Asset-backed securities — 333 333 Other investment funds 299 224 373 896 Derivatives -31 104—73 Equities 16,078
— 16,078 Mortgage loans — 1,421 1,421 Private loans—245—245 Other investments 2,493 1,124—3,617 28,850 1,697 2,478 33,025 Financial statements Introduction Consolidated financial statements Accounting policies Group
structure and segment information Notes to the consolidated balance sheet Notes to the consolidated income statement Other notes Risk management Capital management Operating result Company financial statements
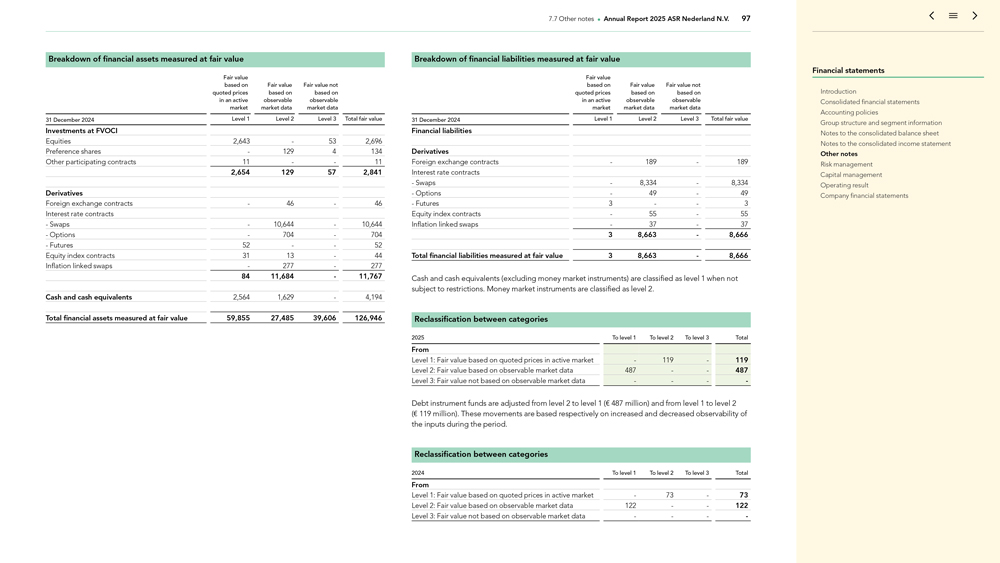
7.7 Other notes Annual Report 2025 ASR Nederland N.V. 97 Breakdown of financial assets measured at fair value
Fair value based on Fair value Fair value not quoted prices based on based on in an active observable observable market market data market data 31 December 2024 Level 1 Level 2 Level 3 Total fair value Investments at FVOCI
Equities 2,643—53 2,696 Preference shares—129 4 134 Other participating contracts 11 — 11 2,654 129 57 2,841 Derivatives Foreign exchange contracts—46—46 Interest rate
contracts—Swaps—10,644—10,644—Options—704—704—Futures 52 — 52 Equity index contracts 31 13—44 Inflation linked swaps—277—277 84 11,684—11,767 Cash and cash equivalents 2,564
1,629—4,194 Total financial assets measured at fair value 59,855 27,485 39,606 126,946 Breakdown of financial liabilities measured at fair value Fair value based on Fair value Fair value not quoted prices based on based on in an active
observable observable market market data market data 31 December 2024 Level 1 Level 2 Level 3 Total fair value Financial liabilities Derivatives Foreign exchange contracts—189—189 Interest rate
contracts—Swaps—8,334—8,334—Options—49—49—Futures 3 — 3 Equity index contracts—55—55 Inflation linked swaps—37—37 3 8,663—8,666 Total financial liabilities measured at
fair value 3 8,663—8,666 Cash and cash equivalents (excluding money market instruments) are classified as level 1 when not subject to restrictions. Money market instruments are classified as level 2. Reclassification between categories 2025 To
level 1 To level 2 To level 3 Total From Level 1: Fair value based on quoted prices in active market—119—119 Level 2: Fair value based on observable market data 487 — 487 Level 3: Fair value not based on observable
market data — — Debt instrument funds are adjusted from level 2 to level 1 (€ 487 million) and from level 1 to level 2 (€ 119 million). These movements are based respectively on increased and decreased observability
of the inputs during the period. Reclassification between categories 2024 To level 1 To level 2 To level 3 Total From Level 1: Fair value based on quoted prices in active market—73—73 Level 2: Fair value based on observable
market data 122 — 122 Level 3: Fair value not based on observable market data — — Financial statements Introduction Consolidated financial statements Accounting policies Group structure and segment information Notes to the
consolidated balance sheet Notes to the consolidated income statement Other notes Risk management Capital management Operating result Company financial statements
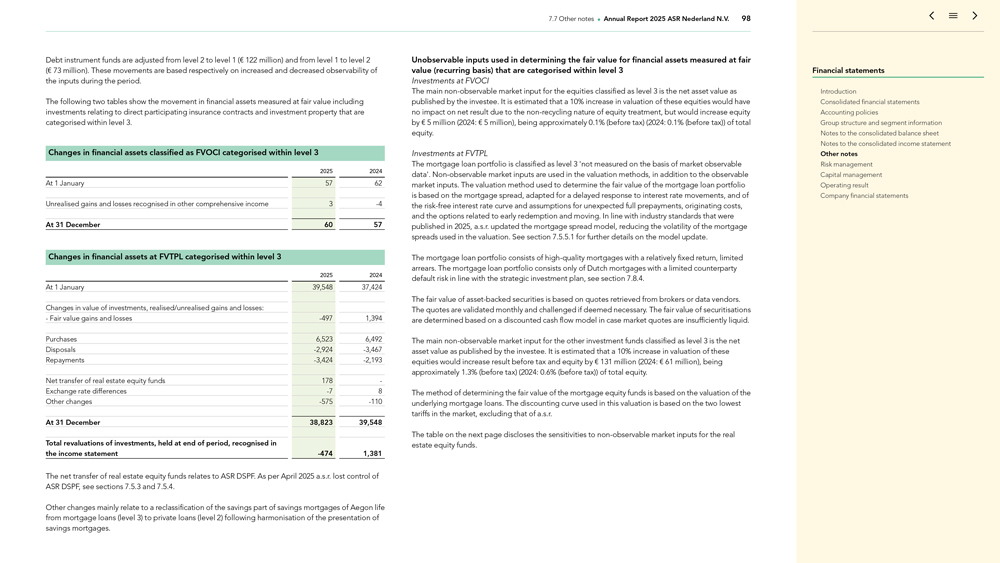
7.7 Other notes Annual Report 2025 ASR Nederland N.V. 98 Debt instrument funds are adjusted from level 2 to
level 1 (€ 122 million) and from level 1 to level 2 (€ 73 million). These movements are based respectively on increased and decreased observability of the inputs during the period. The following two tables show the movement in
financial assets measured at fair value including investments relating to direct participating insurance contracts and investment property that are categorised within level 3. Changes in financial assets classified as FVOCI categorised within level
3 2025 2024 At 1 January 57 62 Unrealised gains and losses recognised in other comprehensive income 3 -4 At 31 December 60 57 Changes in financial assets at FVTPL categorised within level 3 2025 2024
At 1 January 39,548 37,424 Changes in value of investments, realised/unrealised gains and losses: —Fair value gains and losses -497 1,394 Purchases 6,523 6,492 Disposals -2,924 -3,467 Repayments -3,424 -2,193 Net transfer of real estate equity funds 178 -Exchange
rate differences -7 8 Other changes -575 -110 At 31 December 38,823 39,548 Total revaluations of investments, held at end of
period, recognised in the income statement -474 1,381 The net transfer of real estate equity funds relates to ASR DSPF. As per April 2025 a.s.r. lost control of ASR DSPF, see sections 7.5.3 and 7.5.4. Other
changes mainly relate to a reclassification of the savings part of savings mortgages of Aegon life from mortgage loans (level 3) to private loans (level 2) following harmonisation of the presentation of savings mortgages. Unobservable inputs used in
determining the fair value for financial assets measured at fair value (recurring basis) that are categorised within level 3 Investments at FVOCI The main non-observable market input for the equities
classified as level 3 is the net asset value as published by the investee. It is estimated that a 10% increase in valuation of these equities would have no impact on net result due to the non-recycling nature
of equity treatment, but would increase equity by € 5 million (2024: € 5 million), being approximately 0.1% (before tax) (2024: 0.1% (before tax)) of total equity. Investments at FVTPL The mortgage loan portfolio is
classified as level 3 ‘not measured on the basis of market observable data’. Non-observable market inputs are used in the valuation methods, in addition to the observable market inputs. The
valuation method used to determine the fair value of the mortgage loan portfolio is based on the mortgage spread, adapted for a delayed response to interest rate movements, and of the risk-free interest rate curve and assumptions for unexpected full
prepayments, originating costs, and the options related to early redemption and moving. In line with industry standards that were published in 2025, a.s.r. updated the mortgage spread model, reducing the volatility of the mortgage spreads used in
the valuation. See section 7.5.5.1 for further details on the model update. The mortgage loan portfolio consists of high-quality mortgages with a relatively fixed return, limited arrears. The mortgage loan portfolio consists only of Dutch mortgages
with a limited counterparty default risk in line with the strategic investment plan, see section 7.8.4. The fair value of asset-backed securities is based on quotes retrieved from brokers or data vendors. The quotes are validated monthly and
challenged if deemed necessary. The fair value of securitisations are determined based on a discounted cash flow model in case market quotes are insufficiently liquid. The main non-observable market input for
the other investment funds classified as level 3 is the net asset value as published by the investee. It is estimated that a 10% increase in valuation of these equities would increase result before tax and equity by € 131 million
(2024: € 61 million), being approximately 1.3% (before tax) (2024: 0.6% (before tax)) of total equity. The method of determining the fair value of the mortgage equity funds is based on the valuation of the underlying mortgage loans. The
discounting curve used in this valuation is based on the two lowest tariffs in the market, excluding that of a.s.r. The table on the next page discloses the sensitivities to non-observable market inputs for
the real estate equity funds. Financial statements Introduction Consolidated financial statements Accounting policies Group structure and segment information Notes to the consolidated balance sheet Notes to the consolidated income statement Other
notes Risk management Capital management Operating result Company financial statements
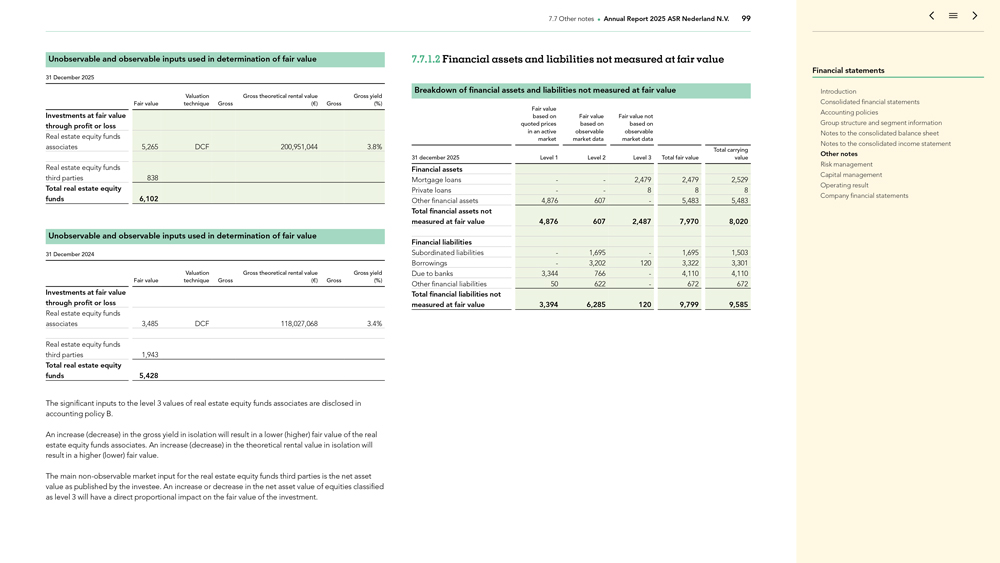
7.7 Other notes Annual Report 2025 ASR Nederland N.V. 99 Unobservable and observable inputs used in
determination of fair value 31 December 2025 Valuation Gross theoretical rental value Gross yield Fair value technique Gross (€) Gross (%) Investments at fair value through profit or loss Real estate equity funds associates 5,265 DCF
200,951,044 3.8% Real estate equity funds third parties 838 Total real estate equity funds 6,102 Unobservable and observable inputs used in determination of fair value 31 December 2024 Valuation Gross theoretical rental value Gross yield Fair
value technique Gross (€) Gross (%) Investments at fair value through profit or loss Real estate equity funds associates 3,485 DCF 118,027,068 3.4% Real estate equity funds third parties 1,943 Total real estate equity funds 5,428 The
significant inputs to the level 3 values of real estate equity funds associates are disclosed in accounting policy B. An increase (decrease) in the gross yield in isolation will result in a lower (higher) fair value of the real estate equity funds
associates. An increase (decrease) in the theoretical rental value in isolation will result in a higher (lower) fair value. The main non-observable market input for the real estate equity funds third parties
is the net asset value as published by the investee. An increase or decrease in the net asset value of equities classified as level 3 will have a direct proportional impact on the fair value of the investment. 7.7.1.2 Financial assets and
liabilities not measured at fair value Breakdown of financial assets and liabilities not measured at fair value Fair value based on Fair value Fair value not quoted prices based on based on in an active observable observable market market data
market data Total carrying 31 december 2025 Level 1 Level 2 Level 3 Total fair value value Financial assets Mortgage loans — 2,479 2,479 2,529 Private loans — 8 8 8 Other financial assets 4,876 607—5,483 5,483
Total financial assets not measured at fair value 4,876 607 2,487 7,970 8,020 Financial liabilities Subordinated liabilities—1,695—1,695 1,503 Borrowings—3,202 120 3,322 3,301 Due to banks 3,344 766—4,110 4,110 Other
financial liabilities 50 622—672 672 Total financial liabilities not measured at fair value 3,394 6,285 120 9,799 9,585 Financial statements Introduction Consolidated financial statements Accounting policies Group structure and segment
information Notes to the consolidated balance sheet Notes to the consolidated income statement Other notes Risk management Capital management Operating result Company financial statements
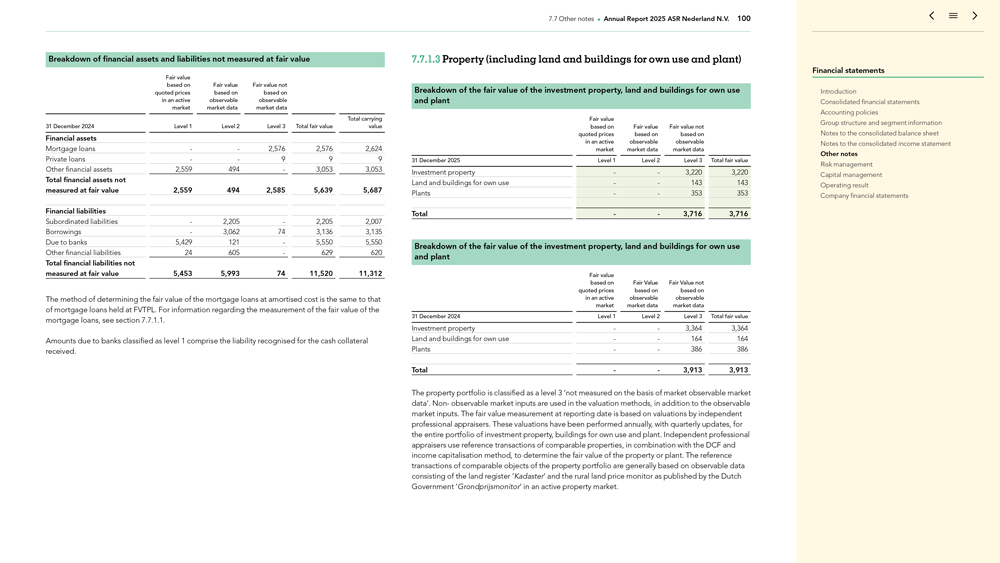
7.7 Other notes Annual Report 2025 ASR Nederland N.V. 100 Breakdown of financial assets and liabilities not
measured at fair value Fair value based on Fair value Fair value not quoted prices based on based on in an active observable observable market market data market data Total carrying 31 December 2024 Level 1 Level 2 Level 3 Total
fair value value Financial assets Mortgage loans — 2,576 2,576 2,624 Private loans — 9 9 9 Other financial assets 2,559 494—3,053 3,053 Total financial assets not measured at fair value 2,559 494 2,585 5,639 5,687 Financial
liabilities Subordinated liabilities—2,205—2,205 2,007 Borrowings—3,062 74 3,136 3,135 Due to banks 5,429 121—5,550 5,550 Other financial liabilities 24 605—629 620 Total financial liabilities not measured at fair value
5,453 5,993 74 11,520 11,312 The method of determining the fair value of the mortgage loans at amortised cost is the same to that of mortgage loans held at FVTPL. For information regarding the measurement of the fair value of the mortgage loans, see
section 7.7.1.1. Amounts due to banks classified as level 1 comprise the liability recognised for the cash collateral received. 7.7.1.3 Property (including land and buildings for own use and plant) Breakdown of the fair value of the investment
property, land and buildings for own use and plant Fair value based on Fair value Fair value not quoted prices based on based on in an active observable observable market market data market data 31 December 2025 Level 1 Level 2
Level 3 Total fair value Investment property — 3,220 3,220 Land and buildings for own use — 143 143 Plants — 353 353 Total — 3,716 3,716 Breakdown of the fair value of the investment property, land and buildings for own
use and plant Fair value based on Fair Value Fair Value not quoted prices based on based on in an active observable observable market market data market data 31 December 2024 Level 1 Level 2 Level 3 Total fair value Investment
property — 3,364 3,364 Land and buildings for own use — 164 164 Plants — 386 386 Total — 3,913 3,913 The property portfolio is classified as a level 3 ‘not measured on the basis of market observable market data’. Non- observable market inputs are used in the valuation methods, in addition to the observable market inputs. The fair value measurement at reporting date is based on valuations by independent professional
appraisers. These valuations have been performed annually, with quarterly updates, for the entire portfolio of investment property, buildings for own use and plant. Independent professional appraisers use reference transactions of comparable
properties, in combination with the DCF and income capitalisation method, to determine the fair value of the property or plant. The reference transactions of comparable objects of the property portfolio are generally based on observable data
consisting of the land register ‘Kadaster’ and the rural land price monitor as published by the Dutch Government ‘Grondprijsmonitor’ in an active property market. Financial statements Introduction Consolidated financial
statements Accounting policies Group structure and segment information Notes to the consolidated balance sheet Notes to the consolidated income statement Other notes Risk management Capital management Operating result Company financial statements
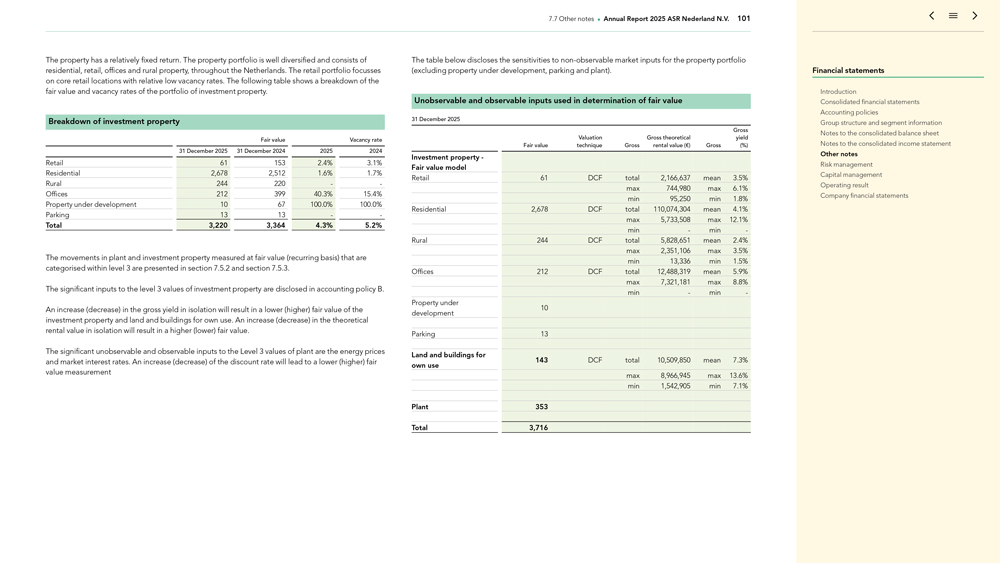
7.7 Other notes Annual Report 2025 ASR Nederland N.V. 101 The property has a relatively fixed return. The
property portfolio is well diversified and consists of residential, retail, offices and rural property, throughout the Netherlands. The retail portfolio focusses on core retail locations with relative low vacancy rates. The following table shows a
breakdown of the fair value and vacancy rates of the portfolio of investment property. Breakdown of investment property Fair value Vacancy rate 31 December 2025 31 December 2024 2025 2024 Retail 61 153 2.4% 3.1% Residential 2,678 2,512
1.6% 1.7% Rural 244 220 —Offices 212 399 40.3% 15.4% Property under development 10 67 100.0% 100.0% Parking 13 13 — Total 3,220 3,364 4.3% 5.2% The movements in plant and investment property measured at fair value (recurring basis) that
are categorised within level 3 are presented in section 7.5.2 and section 7.5.3. The significant inputs to the level 3 values of investment property are disclosed in accounting policy B. An increase (decrease) in the gross yield in isolation will
result in a lower (higher) fair value of the investment property and land and buildings for own use. An increase (decrease) in the theoretical rental value in isolation will result in a higher (lower) fair value. The significant unobservable and
observable inputs to the Level 3 values of plant are the energy prices and market interest rates. An increase (decrease) of the discount rate will lead to a lower (higher) fair value measurement The table below discloses the sensitivities to non-observable market inputs for the property portfolio (excluding property under development, parking and plant). Unobservable and observable inputs used in determination of fair value 31 December 2025 Gross
Valuation Gross theoretical yield Fair value technique Gross rental value (€) Gross (%) Investment property—Fair value model Retail 61 DCF total 2,166,637 mean 3.5% max 744,980 max 6.1% min 95,250 min 1.8% Residential 2,678 DCF total
110,074,304 mean 4.1% max 5,733,508 max 12.1% min—min -Rural 244 DCF total 5,828,651 mean 2.4% max 2,351,106 max 3.5% min 13,336 min 1.5% Offices 212 DCF total 12,488,319 mean 5.9% max 7,321,181 max 8.8% min—min -Property under 10
development Parking 13 Land and buildings for 143 DCF total 10,509,850 mean 7.3% own use max 8,966,945 max 13.6% min 1,542,905 min 7.1% Plant 353 Total 3,716 Financial statements Introduction Consolidated financial statements Accounting policies
Group structure and segment information Notes to the consolidated balance sheet Notes to the consolidated income statement Other notes Risk management Capital management Operating result Company financial statements
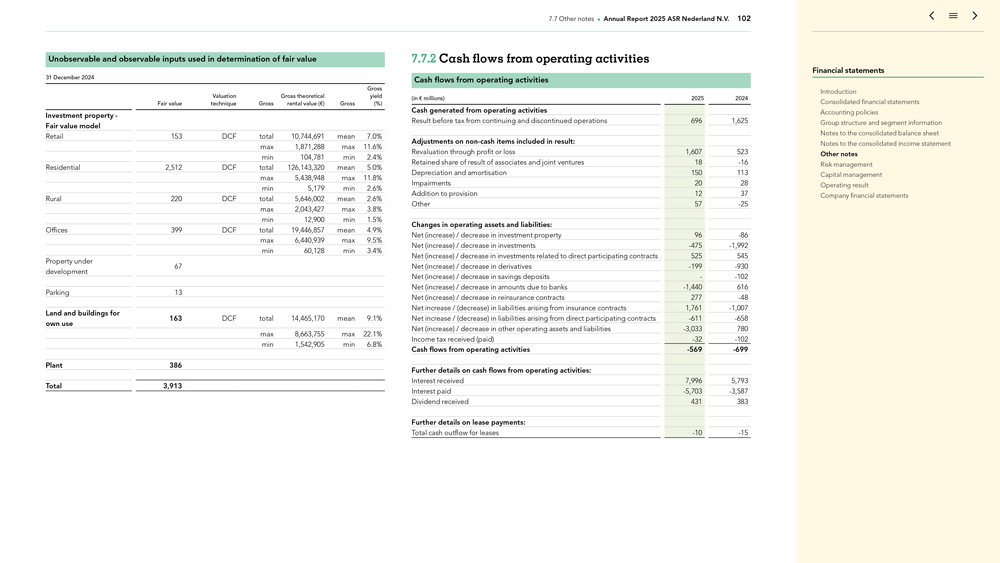
7.7 Other notes Annual Report 2025 ASR Nederland N.V. 102 Unobservable and observable inputs used in
determination of fair value 31 December 2024 Gross Valuation Gross theoretical yield Fair value technique Gross rental value (€) Gross (%) Investment property—Fair value model Retail 153 DCF total 10,744,691 mean 7.0% max 1,871,288
max 11.6% min 104,781 min 2.4% Residential 2,512 DCF total 126,143,320 mean 5.0% max 5,438,948 max 11.8% min 5,179 min 2.6% Rural 220 DCF total 5,646,002 mean 2.6% max 2,043,427 max 3.8% min 12,900 min 1.5% Offices 399 DCF total 19,446,857 mean 4.9%
max 6,440,939 max 9.5% min 60,128 min 3.4% Property under 67 development Parking 13 Land and buildings for 163 DCF total 14,465,170 mean 9.1% own use max 8,663,755 max 22.1% min 1,542,905 min 6.8% Plant 386 Total 3,913 7.7.2 Cash flows from
operating activities Cash flows from operating activities (in € millions) 2025 2024 Cash generated from operating activities Result before tax from continuing and discontinued operations 696 1,625 Adjustments on non-cash items included in result: Revaluation through profit or loss 1,607 523 Retained share of result of associates and joint ventures 18 -16 Depreciation and amortisation
150 113 Impairments 20 28 Addition to provision 12 37 Other 57 -25 Changes in operating assets and liabilities: Net (increase) / decrease in investment property 96 -86
Net (increase) / decrease in investments -475 -1,992 Net (increase) / decrease in investments related to direct participating contracts 525 545 Net (increase) / decrease
in derivatives -199 -930 Net (increase) / decrease in savings deposits—-102 Net (increase) / decrease in amounts due to
banks -1,440 616 Net (increase) / decrease in reinsurance contracts 277 -48 Net increase / (decrease) in liabilities arising from insurance contracts 1,761 -1,007 Net increase / (decrease) in liabilities arising from direct participating contracts -611 -658 Net (increase) / decrease in
other operating assets and liabilities -3,033 780 Income tax received (paid) -32 -102 Cash flows from operating activities -569 -699 Further details on cash flows from operating activities: Interest received 7,996 5,793 Interest paid -5,703 -3,587 Dividend received 431 383 Further details on lease payments: Total cash outflow for leases -10 -15 Financial statements
Introduction Consolidated financial statements Accounting policies Group structure and segment information Notes to the consolidated balance sheet Notes to the consolidated income statement Other notes Risk management Capital management Operating
result Company financial statements
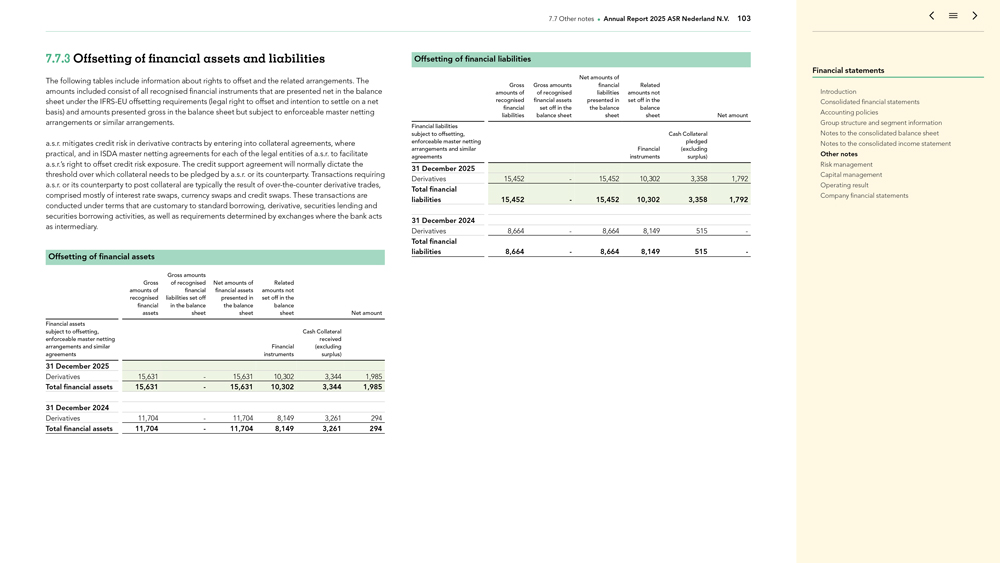
7.7 Other notes Annual Report 2025 ASR Nederland N.V. 103 7.7.3 Offsetting of financial assets and liabilities
The following tables include information about rights to offset and the related arrangements. The amounts included consist of all recognised financial instruments that are presented net in the balance sheet under the
IFRS-EU offsetting requirements (legal right to offset and intention to settle on a net basis) and amounts presented gross in the balance sheet but subject to enforceable master netting arrangements or similar
arrangements. a.s.r. mitigates credit risk in derivative contracts by entering into collateral agreements, where practical, and in ISDA master netting agreements for each of the legal entities of a.s.r. to facilitate a.s.r.’s right to offset
credit risk exposure. The credit support agreement will normally dictate the threshold over which collateral needs to be pledged by a.s.r. or its counterparty. Transactions requiring a.s.r. or its counterparty to post collateral are typically the
result of over-the-counter derivative trades, comprised mostly of interest rate swaps, currency swaps and credit swaps. These transactions are conducted under terms that
are customary to standard borrowing, derivative, securities lending and securities borrowing activities, as well as requirements determined by exchanges where the bank acts as intermediary. Offsetting of financial assets Gross amounts Gross of
recognised Net amounts of Related amounts of financial financial assets amounts not recognised liabilities set off presented in set off in the financial in the balance the balance balance assets sheet sheet sheet Net amount Financial assets subject
to offsetting, Cash Collateral enforceable master netting received arrangements and similar Financial (excluding agreements instruments surplus) 31 December 2025 Derivatives 15,631—15,631 10,302 3,344 1,985 Total financial assets
15,631—15,631 10,302 3,344 1,985 31 December 2024 Derivatives 11,704—11,704 8,149 3,261 294 Total financial assets 11,704—11,704 8,149 3,261 294 Offsetting of financial liabilities Net amounts of Gross Gross amounts financial
Related amounts of of recognised liabilities amounts not recognised financial assets presented in set off in the financial set off in the the balance balance liabilities balance sheet sheet sheet Net amount Financial liabilities subject to
offsetting, Cash Collateral enforceable master netting pledged arrangements and similar Financial (excluding agreements instruments surplus) 31 December 2025 Derivatives 15,452—15,452 10,302 3,358 1,792 Total financial liabilities
15,452—15,452 10,302 3,358 1,792 31 December 2024 Derivatives 8,664—8,664 8,149 515— Total financial liabilities 8,664—8,664 8,149 515— Financial statements Introduction Consolidated financial statements Accounting
policies Group structure and segment information Notes to the consolidated balance sheet Notes to the consolidated income statement Other notes Risk management Capital management Operating result Company financial statements
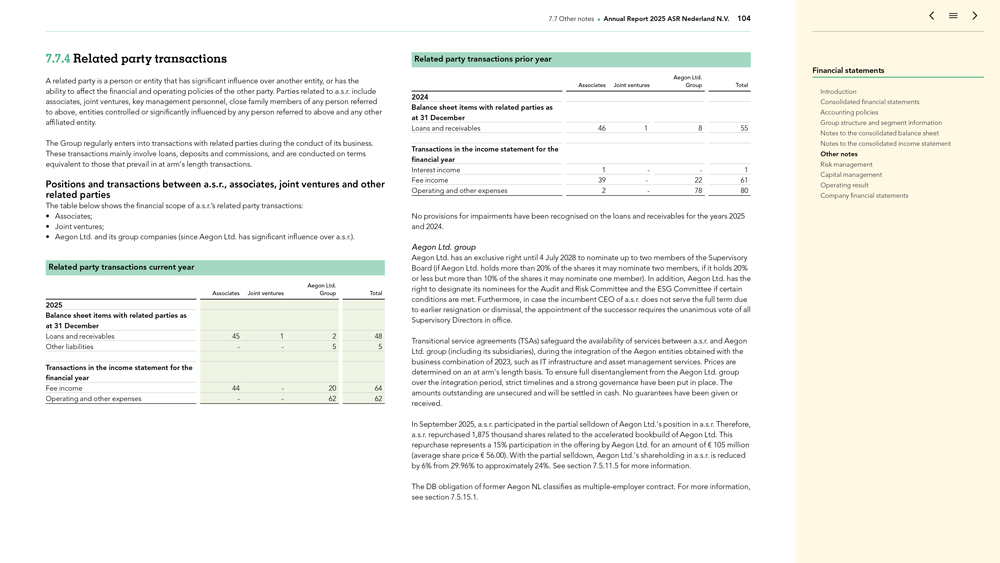
7.7 Other notes Annual Report 2025 ASR Nederland N.V. 104 7.7.4 Related party transactions A related party is a
person or entity that has significant influence over another entity, or has the ability to affect the financial and operating policies of the other party. Parties related to a.s.r. include associates, joint ventures, key management personnel, close
family members of any person referred to above, entities controlled or significantly influenced by any person referred to above and any other affiliated entity. The Group regularly enters into transactions with related parties during the conduct of
its business. These transactions mainly involve loans, deposits and commissions, and are conducted on terms equivalent to those that prevail in at arm’s length transactions. Positions and transactions between a.s.r., associates, joint ventures
and other related parties The table below shows the financial scope of a.s.r.’s related party transactions: Associates; Joint ventures; Aegon Ltd. and its group companies (since Aegon Ltd. has significant influence over a.s.r.). Related party
transactions current year Aegon Ltd. Associates Joint ventures Group Total 2025 Balance sheet items with related parties as at 31 December Loans and receivables 45 1 2 48 Other liabilities — 5 5 Transactions in the income statement for
the financial year Fee income 44—20 64 Operating and other expenses — 62 62 Related party transactions prior year Aegon Ltd. Associates Joint ventures Group Total 2024 Balance sheet items with related parties as at 31 December Loans
and receivables 46 1 8 55 Transactions in the income statement for the financial year Interest income 1 — 1 Fee income 39—22 61 Operating and other expenses 2—78 80 No provisions for impairments have been recognised on the loans
and receivables for the years 2025 and 2024. Aegon Ltd. group Aegon Ltd. has an exclusive right until 4 July 2028 to nominate up to two members of the Supervisory Board (if Aegon Ltd. holds more than 20% of the shares it may nominate two
members, if it holds 20% or less but more than 10% of the shares it may nominate one member). In addition, Aegon Ltd. has the right to designate its nominees for the Audit and Risk Committee and the ESG Committee if certain conditions are met.
Furthermore, in case the incumbent CEO of a.s.r. does not serve the full term due to earlier resignation or dismissal, the appointment of the successor requires the unanimous vote of all Supervisory Directors in office. Transitional service
agreements (TSAs) safeguard the availability of services between a.s.r. and Aegon Ltd. group (including its subsidiaries), during the integration of the Aegon entities obtained with the business combination of 2023, such as IT infrastructure and
asset management services. Prices are determined on an at arm’s length basis. To ensure full disentanglement from the Aegon Ltd. group over the integration period, strict timelines and a strong governance have been put in place. The amounts
outstanding are unsecured and will be settled in cash. No guarantees have been given or received. In September 2025, a.s.r. participated in the partial selldown of Aegon Ltd.’s position in a.s.r. Therefore, a.s.r. repurchased
1,875 thousand shares related to the accelerated bookbuild of Aegon Ltd. This repurchase represents a 15% participation in the offering by Aegon Ltd. for an amount of € 105 million (average share price € 56.00) . With
the partial selldown, Aegon Ltd.’s shareholding in a.s.r. is reduced by 6% from 29.96% to approximately 24%. See section 7.5.11.5 for more information. The DB obligation of former Aegon NL classifies as multiple-employer contract. For more
information, see section 7.5.15.1. Financial statements Introduction Consolidated financial statements Accounting policies Group structure and segment information Notes to the consolidated balance sheet Notes to the consolidated income statement
Other notes Risk management Capital management Operating result Company financial statements
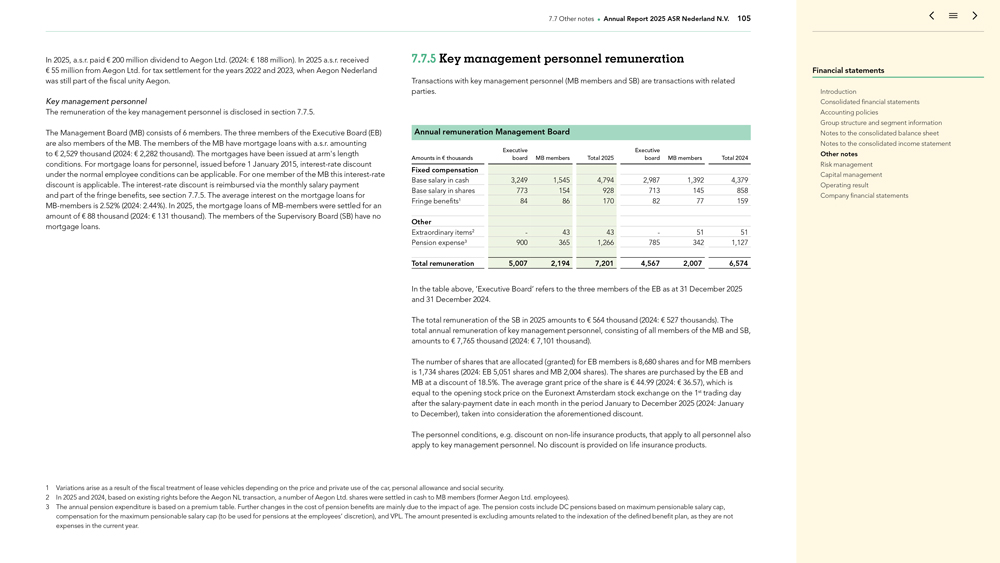
7.7 Other notes Annual Report 2025 ASR Nederland N.V. 105 In 2025, a.s.r. paid € 200 million
dividend to Aegon Ltd. (2024: € 188 million). In 2025 a.s.r. received € 55 million from Aegon Ltd. for tax settlement for the years 2022 and 2023, when Aegon Nederland was still part of the fiscal unity Aegon. Key management
personnel The remuneration of the key management personnel is disclosed in section 7.7.5. The Management Board (MB) consists of 6 members. The three members of the Executive Board (EB) are also members of the MB. The members of the MB have mortgage
loans with a.s.r. amounting to € 2,529 thousand (2024: € 2,282 thousand). The mortgages have been issued at arm’s length conditions. For mortgage loans for personnel, issued before 1 January 2015, interest-rate
discount under the normal employee conditions can be applicable. For one member of the MB this interest-rate discount is applicable. The interest-rate discount is reimbursed via the monthly salary payment and part of the fringe benefits, see section
7.7.5. The average interest on the mortgage loans for MB-members is 2.52% (2024: 2.44%) . In 2025, the mortgage loans of MB-members were settled for an amount of
€ 88 thousand (2024: € 131 thousand). The members of the Supervisory Board (SB) have no mortgage loans. 7.7.5 Key management personnel remuneration Transactions with key management personnel (MB members and SB) are
transactions with related parties. Annual remuneration Management Board Executive Executive Amounts in € thousands board MB members Total 2025 board MB members Total 2024 Fixed compensation Base salary in cash 3,249 1,545 4,794 2,987 1,392
4,379 Base salary in shares 773 154 928 713 145 858 Fringe benefits1 84 86 170 82 77 159 Other Extraordinary items2—43 43—51 51 Pension expense3 900 365 1,266 785 342 1,127 Total remuneration 5,007 2,194 7,201 4,567 2,007 6,574 In the
table above, ‘Executive Board’ refers to the three members of the EB as at 31 December 2025 and 31 December 2024. The total remuneration of the SB in 2025 amounts to € 564 thousand (2024: € 527
thousands). The total annual remuneration of key management personnel, consisting of all members of the MB and SB, amounts to € 7,765 thousand (2024: € 7,101 thousand). The number of shares that are allocated (granted) for
EB members is 8,680 shares and for MB members is 1,734 shares (2024: EB 5,051 shares and MB 2,004 shares). The shares are purchased by the EB and MB at a discount of 18.5% . The average grant price of the share is € 44.99 (2024:
€ 36.57), which is equal to the opening stock price on the Euronext Amsterdam stock exchange on the 1st trading day after the salary-payment date in each month in the period January to December 2025 (2024: January to December), taken into
consideration the aforementioned discount. The personnel conditions, e.g. discount on non-life insurance products, that apply to all personnel also apply to key management personnel. No discount is provided on
life insurance products. 1 Variations arise as a result of the fiscal treatment of lease vehicles depending on the price and private use of the car, personal allowance and social security. 2 In 2025 and 2024, based on existing rights before the
Aegon NL transaction, a number of Aegon Ltd. shares were settled in cash to MB members (former Aegon Ltd. employees). 3 The annual pension expenditure is based on a premium table. Further changes in the cost of pension benefits are mainly due to the
impact of age. The pension costs include DC pensions based on maximum pensionable salary cap, compensation for the maximum pensionable salary cap (to be used for pensions at the employees’ discretion), and VPL. The amount presented is
excluding amounts related to the indexation of the defined benefit plan, as they are not expenses in the current year. Financial statements Introduction Consolidated financial statements Accounting policies Group structure and segment information
Notes to the consolidated balance sheet Notes to the consolidated income statement Other notes Risk management Capital management Operating result Company financial statements
7.7 Other notes Annual Report 2025 ASR Nederland N.V. 106 7.7.6 Employee Share Purchase Plan In 2019 a.s.r.
issued an employee share purchase plan (ESPP or ‘the plan’). a.s.r. employees are thereby given the opportunity to acquire a.s.r. shares at a discount. a.s.r. can suspend or withdraw the plan at any time. There is no option under the
plan for either a.s.r. or the employee to settle in cash or other assets. Therefore the plan is an equity-settled share-based payments plan. In 2023, a.s.r. has introduced the revised remuneration policy for EB and MB members, see section 7.7.5.
Under the terms of the plan the granting and vesting is predefined. The grant date of the plan is the moment the employee registers to participate in the plan. The shares vest immediately on the transaction date when cash is received from the
employee, unconditionally, subject only to a post-vesting transfer restriction of five years. Otherwise, there are no specific restrictions to the share (i.e. voting power, dividend restrictions). The employees purchase the shares at a discount of
18.5% . The fair value of the a.s.r. share with a lock-up of five years at the grant date equals the purchased price by the employee. The ESPP has an impact on equity through the adjustment in the treasury
shares and retained earnings. See section 7.5.11.5 Treasury shares for more information. The number of shares purchased by employees during the reporting period was 235 thousand for an amount of € 11 million (2024:
268 thousand for an amount of € 9 million). 7.7.7 Contingent liabilities and assets 7.7.7.1 General claims and disputes The Group is a respondent in a number of claims, disputes and legal proceedings arising from the normal conduct of
business. Provisions are formed for such occurrences if, in management’s opinion and after consultation with its legal advisors, a.s.r. is likely to have to make payments and the payable amount can be estimated with sufficient reliability. The
probable costs related to the compensation schemes for unit-linked insurance contracts have been fully recognised based on management’s current knowledge of relevant facts, claims and events. These provisions are included in the legal
provisions (see section 7.5.16) and, for 2024, under the liabilities arising from insurance contracts. Further information on the unit-linked insurance contracts is provided in section 7.7.7.2. Dutch insurers continue to receive insurance policies
complaints and claims based on grounds other than the cost compensation. Possible future legal proceedings could have a substantial financial and reputational impact. However it is not possible at this time to make reliable estimates of the number
of expected proceedings, possible future precedents and the financial impact of possible future proceedings. Currently there are no indications that an additional provision would be necessary for a.s.r. As for other claims and legal proceedings,
against a.s.r. known to management (and for which, in accordance with the defined principles, no provision has been formed), management believes, after having sought expert advice, that these claims have no chance of success, or that a.s.r. can
successfully mount a defence against them, or that the outcome of the proceedings is unlikely to result in a significant loss for a.s.r. Financial statements Introduction Consolidated financial statements Accounting policies Group structure and
segment information Notes to the consolidated balance sheet Notes to the consolidated income statement Other notes Risk management Capital management Operating result Company financial statements
7.7 Other notes Annual Report 2025 ASR Nederland N.V. 107 7.7.7.2 Pending litigation portfolio and
product-related issues Unit-linked products (beleggingsverzekeringen) Since 2006, Dutch unit-linked life insurance products have been subject to public criticism regarding fees and transparency, giving rise to industry-wide compensation schemes and
collective claims initiated by consumer groups. a.s.r. was involved in several collective actions, which were ultimately resolved through a comprehensive settlement with five consumer protection organisations, finalised in February 2025. The
agreement did not admit excessive charges and was accepted by virtually all affiliated customers. All related proceedings have been withdrawn, and the participating organisations have agreed not to initiate new actions. Following the
settlement’s finalisation, a leniency scheme was introduced for non-affiliated customers with a closing date of 1 June 2025. A substantial portion of the settlement and leniency scheme obligation
has already been paid in 2025, with the remainder scheduled for settlement in the first half of 2026. These settlements have substantially reduced outstanding legal exposure. Nonetheless, Dutch insurers may continue to face residual risk, including
the possibility of future claims and reputational impact. For further details regarding the recognised provisions, see section 7.5.16 . Optas In 2019 Optas had been merged into Aegon life, based on prior approval and instruction by the DNB. A
limited number of policyholders opposed the merger and appealed the permission of DNB at the administrative Court. On 13 February 2023 the Administrative Court granted the objections and annulled the permission granted by the DNB. The Court
found that DNB should have required that all policyholders should have been individually informed in writing regarding the merger and given the possibility to oppose the merger. The Court also found that DNB should have shared all (including those
marked classified and sensitive) documents relating to the permission to the objectors. Based on the law (Wft) the legality of the merger is not affected by an administrative annulment. This has been confirmed by ruling of the Civil Court in a case
against Aegon life, and by the Supreme Court of the Netherlands. An appeal procedure that is still pending relates to alleged rights to indexation of pension rights, that was lodged by a limited number of policyholders. In first instance the claims
of these policyholders were denied by the District Court in Rotterdam. Aegon life does not expect the pending litigation at the Appeals Court to have a material impact on a.s.r.’s business, results of operations and financial position.
However, there can be no assurances in this respect. 7.7.7.3 Obligations and guarantees a.s.r. has entered into private loans agreements € 262 million (2024: € 502 million) and private equity agreements
€ 574 million (2024: € 100 million). Other commitments mainly consist of future purchases of interests in investment funds and amounts to € 813 million (2024: € 463 million). a.s.r. has irrevocable
facilities of € 1,250 million (2024: € 1,223 million) which mainly relate to mortgage loan offers issued. Mortgage loan commitments represent undrawn mortgage loan facilities provided and outstanding proposals on mortgages.
In 2025 there are no sales of mortgage loans related to pre-announced redemptions on mortgage loans (2024: € 74 million). Investment obligations for an amount of € 142 million (2024:
€ 345 million) have been assumed / issued for investment property. The sale of real estate which relates to properties that are under contract to be sold as per 31 December 2025 amounts to € 146 million (2024:
€ 17 million). Real estate commitments represent the committed pipeline of investments in real estate projects. Investment obligations and guarantees for a total amount of € 3 million (2024: € 3 million) have been
issued for real estate development projects and the acquisition of property. Those guarantees were issued by principals for the execution of projects for the benefit of clients. The share of contingent liabilities incurred in relation to interests
in joint ventures amounts to € 13 million (2024: € 14 million). These contingent liabilities, not shown in the balance sheet, relate to investment obligations entered into by a.s.r. (for its share of approximately 50%) for
real estate development projects of Amvest. In October 2017, Aegon NL sold its shares in Unirobe Meeùs Groep (UMG) for € 295 million to Aon Groep Nederland. a.s.r. (after the business combination with Aegon NL) indemnifies and
holds Aon Groep Nederland group (including UMG) harmless (until 2027) for and against any damage incurred resulting from unit-linked insurance claims prior to 1 January 2017 with respect to UMG’s portfolio of Unit Linked Policies. The
aggregate liability for a.s.r. is maximised at an amount equal to the purchase price. The Dutch guarantee fund for motorised traffic has a latent claim on all insurers offering legal liability products. In line with the advice of the guarantee fund
a.s.r.’s contingent liability is € 11 million (2024: € 13 million). Financial statements Introduction Consolidated financial statements Accounting policies Group structure and segment information Notes to the
consolidated balance sheet Notes to the consolidated income statement Other notes Risk management Capital management Operating result Company financial statements
7.7 Other notes Annual Report 2025 ASR Nederland N.V. 108 7.7.7.4 Expected future lease payments The following
table sets out the expected future lease payments for investment property and plants, showing the undiscounted lease payments to be received after the reporting date. 31 December 2025 31 December 2024 To be received within 1 year 22 39 To
be received between 1 and 2 years 16 30 To be received between 2 and 3 years 14 24 To be received between 3 and 4 years 13 18 To be received between 4 and 5 years 11 16 To be received after 5 years 87 98 Total undiscounted lease payments 163 226 The
investments properties, in retail, residential, offices and rural markets are leased to third parties, consisting of various lease terms in a range between shorter than one year and undetermined period with competitive rents mostly indexed to
consumer prices. The plants are leased to third parties with lease terms longer than ten years. 7.7.8 Events after the balance sheet date In July 2025, a.s.r. and Pensioenfonds Zorg & Welzijn (PFZW) announced that an agreement was reached
to divide the real estate activities of Amvest as per January 2026. Following this announcement and approval by the Dutch Authority for the Financial Markets (Autoriteit Financiële Markten—AFM) and the Dutch Authority for Consumers and
Markets (Autoriteit Consument & Markt—ACM), in January 2026 a.s.r. sold its’ shares in Amvest Vastgoed B.V. to PFZW. The management of a.s.r.’s separate account, comprising approximately 7,500 residential units, is
transferred to a.s.r. Besides, the development portfolio of Amvest Development Fund B.V. is split between PFZW and a.s.r. In January 2026, a.s.r. reached an agreement with BOVAG on the full acquisition of all insurance activities of Bovemij N.V.
(Bovemij), representing a premium volume of circa € 400 million. The purchase price amounts to € 185 million and will be paid in cash by a.s.r. Bovemij specialises in insurance and additional services for the mobility
sector. Customers of Bovemij will continue to receive advisory and distribution services for insurance products under the trusted Bovemij and ENRA labels. For the distribution of insurance products, a.s.r. and BOVAG will establish a joint venture in
which both parties will hold a 50% stake. Completion of the transaction is expected in the second half of 2026 and is subject to regulatory approvals. On 18 February 2026, a.s.r. announced a share buyback of € 190 million
(including €15 million for the management and the employee share plans) starting on 18 February 2026, which is expected to be completed before 19 May 2026. Financial statements Introduction Consolidated financial statements
Accounting policies Group structure and segment information Notes to the consolidated balance sheet Notes to the consolidated income statement Other notes Risk management Capital management Operating result Company financial statements
7.7 Other notes Annual Report 2025 ASR Nederland N.V. 109 7.7.9 List of principal group companies List of
principal group companies Company Equity interest Rate of control Seat Segment ASR Aanvullende Ziektekostenverzekeringen N.V.1 100.00 100.00 Utrecht Non-life ASR Basis Ziektekostenverzekeringen N.V.1 100.00
100.00 Utrecht Non-life ASR Schadeverzekering N.V.1 100.00 100.00 Utrecht Non-life ASR Wlz-uitvoerder B.V. 100.00 100.00 Utrecht
Non-life ASR Ziektekostenverzekeringen N.V.2 100.00 100.00 Utrecht Non-life ASR Levensverzekering N.V.1 100.00 100.00 Utrecht Life ASR Utrecht Real Estate Investments
Netherlands B.V. 100.00 100.00 Amsterdam Life ASR Premiepensioeninstelling N.V.3 100.00 100.00 Amsterdam Life Aegon Levensverzekering N.V.1 100.00 100.00 Den Haag Life Aegon Spaarkas N.V.1 100.00 100.00 Den Haag Life Aegon DL B.V.2 100.00 100.00 Den
Haag Life Home Free Nederland B.V.2 100.00 100.00 Zeist Life Orcinus 2023 B.V. 0.00 100.00 Utrecht Life Delphinus 2023-I B.V. 0.00 100.00 Utrecht Life Delphinus 2025-I
B.V. 0.00 100.00 Utrecht Life SAECURE 17 B.V. 0.00 100.00 Amsterdam Life SAECURE 20 B.V. 0.00 100.00 Amsterdam Asset Management SAECURE 21 B.V. 0.00 100.00 Amsterdam Asset Management SAECURE 22 B.V. 0.00 100.00 Amsterdam Asset Management Aegon
Hypotheken Financiering B.V. 0.00 100.00 Amsterdam Asset Management Aegon Hypotheken Prefunding B.V. 0.00 100.00 Amsterdam Asset Management Hypotheken Prefunding 2 B.V. 0.00 100.00 Amsterdam Asset Management ASR Administratieve Dienstverlening B.V.2
100.00 100.00 Utrecht Asset Management ASR Real Estate B.V.3,2 100.00 100.00 Utrecht Asset Management ASR Vermogensbeheer N.V.3,2 100.00 100.00 Utrecht Asset Management Aegon Hypotheken B.V.3 100.00 100.00 Den Haag Asset Management dRA Exploitatie
B.V.3 100.00 100.00 Lochem Distribution & Services BSB Assurantiën B.V.3 85.00 85.00 Geleen Distribution & Services Anac Backoffice B.V.3 100.00 100.00 Eindhoven Distribution & Services ASR Vitaliteit &
Preventieve Diensten B.V. 100.00 100.00 Utrecht Distribution & Services Assurantiekantoor Lodewijk B.V.3 100.00 100.00 Wezep Distribution & Services Boval Assurantiën B.V.3 100.00 100.00 Velserbroek Distribution &
Services Corins B.V.3 100.00 100.00 Amsterdam Distribution & Services 1 Registered insurance companies 2 These are companies for which a statement of joint and several liability under section 403, Book 2 of the Dutch Civil Code has been
issued. 3 Other Wft registered companies Financial statements Introduction Consolidated financial statements Accounting policies Group structure and segment information Notes to the consolidated balance sheet Notes to the consolidated income
statement Other notes Risk management Capital management Operating result Company financial statements
7.7 Other notes Annual Report 2025 ASR Nederland N.V. 110 Company Equity interest Rate of control Seat Segment
Dutch ID B.V. 100.00 100.00 Velserbroek Distribution & Services Felison Assuradeuren B.V.1 100.00 100.00 Velserbroek Distribution & Services Van Helvoort Assuradeuren B.V.1 100.00 100.00 Gemert Distribution & Services Van
Helvoort Registermakelaars in Assurantiën B.V.1 100.00 100.00 Gemert Distribution & Services PoliService B.V.1 100.00 100.00 Hardinxveld-Giessendam Distribution & Services Supergarant Verzekeringen B.V.1 100.00 100.00
Leidschendam Distribution & Services Van Kampen Geld B.V.1 100.00 100.00 Hoorn Distribution & Services Van Kampen Groep Holding B.V.1 100.00 100.00 Hoorn Distribution & Services ZZP Nederland Verzekeringen B.V.1 100.00
100.00 Groningen Distribution & Services D&S Holding B.V.2 100.00 100.00 Velserbroek Distribution & Services D&S Participaties B.V.2 100.00 100.00 Velserbroek Distribution & Services Advies van a.s.r. B.V.1 100.00
100.00 Den Haag Distribution & Services Aegon Bemiddeling B.V.1 100.00 100.00 Den Haag Distribution & Services Robidus Groep B.V. 94.92 94.92 Den Haag Distribution & Services Robidus Arbo B.V.2 94.92 94.92 Zaandam
Distribution & Services Robidus Risk Consulting B.V.2 94.92 94.92 Zaanstad Distribution & Services Robidus Services B.V.2 94.92 94.92 Zaanstad Distribution & Services Robidus Solutions B.V.2 94.92 94.92 Zaanstad
Distribution & Services Bronkhorst Bedrijfskompas B.V. 94.92 94.92 Putten Distribution & Services NIPED Prevention B.V. 94.92 94.92 Amsterdam Distribution & Services Nedasco B.V.1 100.00 100.00 Amersfoort
Distribution & Services GHW Assurantiegroep B.V.1 100.00 100.00 Nijmegen Distribution & Services Bastiaens & Cox B.V.1 100.00 100.00 Venlo Distribution & Services De Regt Adviesgroep B.V.1 100.00 100.00 Den Haag
Distribution & Services TKP Pensioen B.V. 100.00 100.00 Groningen Distribution & Services HumanTouch Holding B.V. 100.00 100.00 Son en Breugel Distribution & Services HumanTotalCare B.V. 100.00 100.00 Eindhoven
Distribution & Services HumanCapitalCare B.V. 100.00 100.00 Eindhoven Distribution & Services ArboNed B.V. 100.00 100.00 Utrecht Distribution & Services Mensely B.V. 100.00 100.00 Eindhoven Distribution & Services
Pensioen Gilde B.V. 100.00 100.00 Emmen Distribution & Services ASAM N.V.2 100.00 100.00 Utrecht Holding & Other ASR Betalingscentrum B.V.2 100.00 100.00 Utrecht Holding & Other ASR Deelnemingen N.V.2 100.00 100.00 Utrecht
Holding & Other ASR Nederland N.V. 100.00 100.00 Utrecht Holding & Other ASR Service Maatschappij N.V.2 100.00 100.00 Rotterdam Holding & Other ASR Real Estate Development B.V. 100.00 100.00 Utrecht Holding &
Other ASR Vooruit B.V.1 100.00 100.00 Utrecht Holding & Other Aegon Administratie B.V.2 100.00 100.00 Den Haag Holding & Other Servicemaatschappij “De Hoofdpoort” N.V.2 100.00 100.00 Utrecht Holding & Other 1
Other Wft registered companies 2 These are companies for which a statement of joint and several liability under section 403, Book 2 of the Dutch Civil Code has been issued. Financial statements Introduction Consolidated financial statements
Accounting policies Group structure and segment information Notes to the consolidated balance sheet Notes to the consolidated income statement Other notes Risk management Capital management Operating result Company financial statements

7.7 Other notes Annual Report 2025 ASR Nederland N.V. 111 The principal group companies are located in the
Netherlands. For notes to equity interests in associates and joint ventures, see section 7.5.4. The list of equity interests which are required under Sections 379 and 414, Book 2 of the Dutch Civil Code has been filed with the Trade Register of the
Chamber of Commerce in Utrecht. The statements of joint and several liability under section 403, Book 2 of the Dutch Civil Code for Obra Services B.V., Robidus Risk Consulting B.V., Robidus Services B.V. and Robidus Solutions B.V. have all been
issued by Robidus Groep B.V. All other statement of joint and several liability in the list of principal group companies have been issued by a.s.r. Nederland N.V. Certain structured entities, in which a.s.r. does not hold any shares, are
consolidated. For more information on these structured entities, see section 7.5.17. 7.7.10 Profit appropriation The EB will propose to the AGM to distribute a final dividend of € 438 million in dividend on ordinary shares over 2025.
Including the interim dividend of € 262 million the total dividends to shareholder amount to € 700 million. The remaining result will be transferred to retained earnings in accordance with Article 37 of the Articles of
Association of a.s.r. Financial statements Introduction Consolidated financial statements Accounting policies Group structure and segment information Notes to the consolidated balance sheet Notes to the consolidated income statement Other notes Risk
management Capital management Operating result Company financial statements
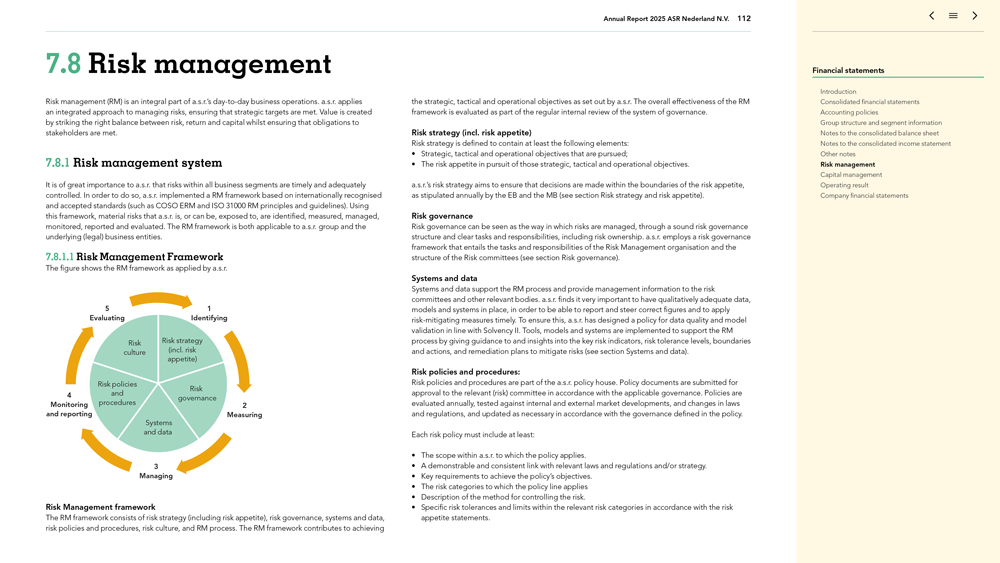
Annual Report 2025 ASR Nederland N.V. 112 7.8 Risk management Risk management (RM) is an integral part of
a.s.r.’s day-to-day business operations. a.s.r. applies an integrated approach to managing risks, ensuring that strategic targets are met. Value is created by
striking the right balance between risk, return and capital whilst ensuring that obligations to stakeholders are met. 7.8.1 Risk management system It is of great importance to a.s.r. that risks within all business segments are timely and adequately
controlled. In order to do so, a.s.r. implemented a RM framework based on internationally recognised and accepted standards (such as COSO ERM and ISO 31000 RM principles and guidelines). Using this framework, material risks that a.s.r. is, or can
be, exposed to, are identified, measured, managed, monitored, reported and evaluated. The RM framework is both applicable to a.s.r. group and the 5 1 Evaluating Identifying Risk Risk strategy culture (incl. risk appetite) Risk policies Risk 4 and
governance Monitoring procedures 2 and reporting Measuring Systems and data 3 Managing Risk Management framework The RM framework consists of risk strategy (including risk appetite), risk governance, systems and data, risk policies and procedures,
risk culture, and RM process. The RM framework contributes to achieving the strategic, tactical and operational objectives as set out by a.s.r. The overall effectiveness of the RM framework is evaluated as part of the regular internal review of the
system of governance. Risk strategy (incl. risk appetite) Risk strategy is defined to contain at least the following elements: Strategic, tactical and operational objectives that are pursued; The risk appetite in pursuit of those strategic, tactical
and operational objectives. a.s.r.’s risk strategy aims to ensure that decisions are made within the boundaries of the risk appetite, as stipulated annually by the EB and the MB (see section Risk strategy and risk appetite). Risk governance
Risk governance can be seen as the way in which risks are managed, through a sound risk governance structure and clear tasks and responsibilities, including risk ownership. a.s.r. employs a risk governance framework that entails the tasks and
responsibilities of the Risk Management organisation and the structure of the Risk committees (see section Risk governance). Systems and data Systems and data support the RM process and provide management information to the risk committees and other
relevant bodies. a.s.r. finds it very important to have qualitatively adequate data, models and systems in place, in order to be able to report and steer correct figures and to apply risk-mitigating measures timely. To ensure this, a.s.r. has
designed a policy for data quality and model validation in line with Solvency II. Tools, models and systems are implemented to support the RM process by giving guidance to and insights into the key risk indicators, risk tolerance levels, boundaries
and actions, and remediation plans to mitigate risks (see section Systems and data). Risk policies and procedures: Risk policies and procedures are part of the a.s.r. policy house. Policy documents are submitted for approval to the relevant (risk)
committee in accordance with the applicable governance. Policies are evaluated annually, tested against internal and external market developments, and changes in laws and regulations, and updated as necessary in accordance with the governance
defined in the policy. Each risk policy must include at least: The scope within a.s.r. to which the policy applies. A demonstrable and consistent link with relevant laws and regulations and/or strategy. Key requirements to achieve the policy’s
objectives. The risk categories to which the policy line applies Description of the method for controlling the risk. Specific risk tolerances and limits within the relevant risk categories in accordance with the risk appetite statements. Financial
statements Introduction Consolidated financial statements Accounting policies Group structure and segment information Notes to the consolidated balance sheet Notes to the consolidated income statement Other notes Risk management Capital management
Operating result Company financial statements
7.8 Risk management Annual Report 2025 ASR Nederland N.V. 113 The frequency and content of regular stress tests
and the circumstances that would justify ad-hoc stress tests. The processes and reporting procedures applied. Exceptions and Escalations. The classification of risks within a.s.r. is performed in line with,
but is not limited to, the Solvency II risks. Each risk category consists of one or more policies or procedures that explicates how risks are identified, measured and controlled within a.s.r. (see section Risk policies and procedures). Risk culture
An effective risk culture is one that enables and rewards individuals and groups for taking risks in an informed manner. It is a term describing the values, beliefs, knowledge, attitudes and understanding about risk. All the elements of the RM
framework combined make an effective risk culture. Within a.s.r. risk culture is an important element that emphasises the human side of Risk Management. The MB has a distinguished role in expressing the appropriate norms and values (tone at the
top). a.s.r. employs several measures to increase the risk awareness and, in doing so, the risk culture (see section Risk culture). Risk management process The RM process contains all activities within the RM processes to structurally 1) identify
risks; 2) measure risks; 3) manage risks; 4) monitor and report on risks; and 5) evaluate the risk profile and RM framework. At a.s.r., the RM process is used to implement the risk strategy in the steps mentioned. These five steps are applicable to
the risks within the company to be managed effectively (see section Risk Management process). Evaluating the effectiveness of the RM and control system The assurance level that a.s.r. provides regarding the effectiveness of the RM and control
system, as well as insight into any shortcomings, is determined by the full set of activities within the so-called assurance chain, which includes the first and second line functions. a.s.r. applies assurance
mapping for all relevant risk categories, specifying for each risk which control activities are performed by the first and second line functions. This integrated approach ensures that relevant control functions collectively provide a consistent and
reliable basis for evaluating the effectiveness of the RM and control system. Based on the outcome, additional control measures and improvement actions are implemented where necessary. Shortcomings and improvement measures are transparently reported
to the EB and the A&RC. Integration of Aegon and a.s.r. In 2024, the integration of Aegon and a.s.r. in the area of risk management commenced. This included the harmonisation of financial and non-financial
risk policies, the introduction of a new taxonomy for non-financial risks, the start of the Internal Model Approval Process (IMAP) for a.s.r. life, and the organisational integration of Group Risk Management
(GRM). In 2024, the GRM teams of Aegon and a.s.r. were fully merged into a single department, with uniform management, processes, and reporting lines. In 2025, this integration was consolidated and further refined. The integrated GRM department now
functions as a stable, uniform line within the organisation. The new taxonomy and reporting structure are now fully embedded across the entire group, and the risk management framework has been further optimised. 7.8.1.1.1 Risk management strategy
and risk appetite a.s.r.’s risk strategy aims to ensure that decisions are made within the boundaries of the risk appetite, as stipulated annually by the EB and the MB. Risk appetite is defined as the level and type of risk a.s.r. is willing
to bear in order to meet its strategic, tactical and operational objectives. The risk appetite is formulated to give direction to the management of the (strategic) risks. The risk appetite contains a number of qualitative and quantitative risk
appetite statements and is defined for both financial (FR) and non-financial risks (NFR). The statements highlight the risk preferences and limits of the organisation and are viewed as key elements for the
realisation of the strategy. The statements and limits are defined at both group level and at legal entity level and are determined by the a.s.r. risk committee and approved by the SB. The statements are evaluated yearly to maintain alignment with
the strategy. Since 2024, a.s.r. has adopted a new, more detailed taxonomy for non-financial risks consisting of two levels. In 2025, this structure has become fully operational and now serves as the standard
for reporting on non-financial risks. The classification at both level 1 and level 2 has been retained. In each risk report, risk colours are assigned at both levels. The NFR statements have been updated in
2025 compared to 2024. These are fully aligned with the revised taxonomy introduced in 2024. The year 2025 focused on further concretisation and continued development of data driven risk reporting. The FR statements have changed noticeably compared
to 2024. These changes have been driven by the harmonisation of the financial risk policies of a.s.r. and Aegon. The policies have also been revised for the Internal Model Approval Process (IMAP) of a.s.r. life. Financial statements Introduction
Consolidated financial statements Accounting policies Group structure and segment information Notes to the consolidated balance sheet Notes to the consolidated income statement Other notes Risk management Capital management Operating result Company
financial statements
7.8 Risk management Annual Report 2025 ASR Nederland N.V. 114 Risk appetite statement ASR Nederland N.V. 2025
1a ASR Nederland N.V. maintains a moderate risk appetite regarding strategic risks. NFR Strategic risks may have significant impact, but excessive risk aversion may hinder the achievement of strategic objectives. ASR prioritizes long-term value
creation over volume, maintains financial robustness to meet obligations, and serves stakeholder interests (customers, employees, society, investors) in a balanced and sustainable manner. Risks are only accepted when necessary to achieve strategic
goals. 1b ASR Nederland N.V. maintains a moderate risk appetite regarding strategic NFR sustainability risks. ASR balances sustainability ambitions with financial objectives and stability, striving to be one of Europe’s most sustainable
financial institutions. ASR acts in accordance with its sustainability ambitions and adequately manages related risks. 1c ASR Nederland N.V. maintains a moderate risk appetite regarding personnel risks. NFR This enables ASR to attract and retain
talented, skilled, sustainably employable, and vital employees, while accepting risks necessary to safeguard organisational agility. 1d ASR Nederland N.V. maintains a minimal risk appetite regarding customer and advisorNFR risks. ASR puts the
customer first , meets its obligations, and ensures customers can easily and quickly manage their affairs through a digital environment with personal contact when needed. ASR invests in technology and customer service to achieve above-average
satisfaction, while maintaining strict quality and compliance standards and ensuring customer data quality. 2a ASR Nederland N.V. maintains a moderate risk appetite regarding risks that may NFR negatively impact our internal processes. ASR accepts
certain risks inherent to the execution of primary, supporting, and governance processes, provided they remain within defined boundaries and are carefully managed. Operational excellence is pursued through robust control mechanisms to minimise
incorrect acceptances, policy and claims handling errors, payment and transaction mistakes, fraud, and other operational failures. 2b ASR Nederland N.V. maintains a moderate risk appetite regarding risks related to NFR outsourcing. ASR collaborates
with external parties under adequate governance and control mechanisms to manage outsourcing risks. The objective is to ensure reliable and efficient partnerships without compromising operational integrity and service quality. 2c ASR Nederland N.V.
maintains a minimal risk appetite regarding business continuity NFR and crisis management. ASR invests in measures to limit the (customer) impact of realistic disruptions caused by cyberattacks, IT outages, third-party failures, natural disasters,
and pandemics. Critical business functions are made resilient through continuity plans and crisis management processes. 3a ASR Nederland N.V. maintains an averse risk appetite regarding information security NFR and cyber resilience. Information
security and cyber resilience are essential for operational processes and business continuity. ASR only accepts risks when absolutely necessary and invests to the maximum extent in required measures to minimise cyber risks and comply with legal
obligations. Systems, data, and digital processes are secured and resilient in accordance with availability, confidentiality, and integrity requirements. 3b ASR Nederland N.V. maintains a moderate risk appetite regarding IT risks. Well- NFR
functioning IT is essential for business execution and strategic objectives. Risks may be taken in deploying IT resources and adopting new technologies, provided they are well understood and effectively managed. 4 ASR Nederland N.V. maintains a
moderate risk appetite regarding project risks. NFR Projects essential to strategic objectives are executed in a controlled manner, with attention to timeliness, budget, and quality. Risks are accepted only when well understood and effectively
managed. 5a ASR Nederland N.V. maintains a minimal risk appetite regarding the integrity of NFR financial reporting. Material financial losses and reputational damage are prevented through robust controls and by ensuring high-quality IFRS and
Solvency II data. 5b ASR Nederlands N.V. maintains a minimal risk appetite regarding the integrity of non- NFR financial reporting. Material financial losses and reputational damage are prevented through
robust controls. 5c ASR Nederland N.V. maintains a minimal risk appetite regarding the reliability of NFR models. ASR invests in the development and documentation of robust modelling methods and designs, with adequate control mechanisms to minimise
errors and misinterpretations. Reliable models are used to support informed decision-making. 5d ASR Nederland N.V. maintains a minimal risk appetite regarding tax risks. The NFR tax policy emphasises compliance, transparency, and responsible tax
management, avoiding aggressive strategies. Tax is viewed as a driver of social cohesion and sustainable growth. ASR commits to timely and accurate tax compliance, with planning based on reasonable legal interpretations and actual economic activity.
6a ASR Nederland N.V. maintains an averse risk appetite regarding Customer Due NFR Diligence (CDD) risks. ASR takes adequate measures to comply with CDD obligations and to minimise potential risks. 6b ASR Nederland N.V. maintains an averse risk
appetite regarding the integrity of NFR personal data. ASR holds a significant amount of sensitive information about its customers and other stakeholders. Compliance with privacy legislation is therefore Financial statements Introduction
Consolidated financial statements Accounting policies Group structure and segment information Notes to the consolidated balance sheet Notes to the consolidated income statement Other notes Risk management Capital management Operating result Company
financial statements
7.8 Risk management Annual Report 2025 ASR Nederland N.V. 115 essential to safeguard their privacy rights and
protect the organisation’s reputation. ASR invests in robust privacy measures to uphold these rights and ensure legal compliance. 6c ASR Nederland N.V. maintains an averse risk appetite regarding the integrity of the NFR organisation. ASR
invests in compliance with laws and regulations and promotes ethical behaviour within the organisation. Ethical conduct and regulatory compliance are essential to ASR’s reputation. 6d ASR Nederland N.V. maintains an averse risk appetite
regarding the integrity of NFR product ans service delivery. Reliable products and services are essential to ASR’s reputation. ASR invests in processes and systems to meet responsibilities towards customers and distribution partners, including
compliance with legal obligations such as the duty of care. A risk-averse approach is adopted to safeguard compliance and uphold stakeholder trust. 6e ASR Nederland N.V. maintains an averse risk appetite regarding risks related to NFR staff
integrity. ASR does everything possible to meet ethical standards and minimise potential risks, ensuring compliance with laws, regulations, and internal standards (including the a.s.r. Code of Conduct). ASR invests in training and awareness to meet
legal, ethical, and societal standards regarding staff behaviour and professional competence. 7 ASR Nederland N.V. has a minimum SCR ratio of 120%. FR 8a ASR Nederland N.V. has an excess of liquidity after a severe stress event of 12 monthsFR 8b ASR
Nederland N.V. has at least a single A rating and therefore has sufficient capital FR redundancy in accordance with the S&P Capital Model. 8c ASR Nederland N.V. has a maximum financial leverage ratio of 40%. Financial leverageFR ratio = Debt /
(Debt + Equity). 8d ASR Nederland N.V. has a maximum double leverage ratio of 135%.Double leverage FR ratio = Total value of associates / (equity attributable to shareholders + hybrids and subordinated liabilities). 8e ASR Nederland N.V. has a
minimum interest coverage ratio of between 4 and 8. FR Interest coverage ratio = EBIT operational / interest expense. 9 ASR Nederland N.V. remains within the bandwidth of periodically reassessed market FR risk budgets 10a ASR Nederland N.V. remains
within the limits of the interest rate risk policy on SCR for FR interest rate risk and ratio sensitivity for rate changes 10b ASR Nederland N.V. remains within the limits of the interest rate risk policy on SCR for FR interest rate volatility risk
10c ASR Nederland N.V. remains within the limits of the interest rate risk policy on ratio FR sensitivity for inflation rate changes 11 ASR Nederland N.V. (excl. ASR Ziektekosten) has a maximum combined ratio of 99%. FR 7.8.1.1.2 Risk governance
a.s.r.’s risk governance can be described by: risk ownership; the implemented three lines model and associated (clear delimitation of) tasks and responsibilities of key function holders; and the risk committee structure to ensure adequate
decision making. Risk ownership The EB has the final responsibility for risk exposures and management within the organisation. Part of the responsibilities have been delegated to persons that manage the divisions where the actual risk-taking takes
place. Risk owners are accountable for one or more risk exposures that are inextricably linked to the department or product line they are responsible for. Through the risk committee structure, risk owners provide accountability for the risk
exposures. Three lines model The risk governance structure is based on the ‘three lines’ model. The three lines model consists of three lines with different responsibilities with respect to the ownership of controlling risks. The table
below provides insight in the organisation of the three lines model within a.s.r. Financial statements Introduction Consolidated financial statements Accounting policies Group structure and segment information Notes to the consolidated balance sheet
Notes to the consolidated income statement Other notes Risk management Capital management Operating result Company financial statements
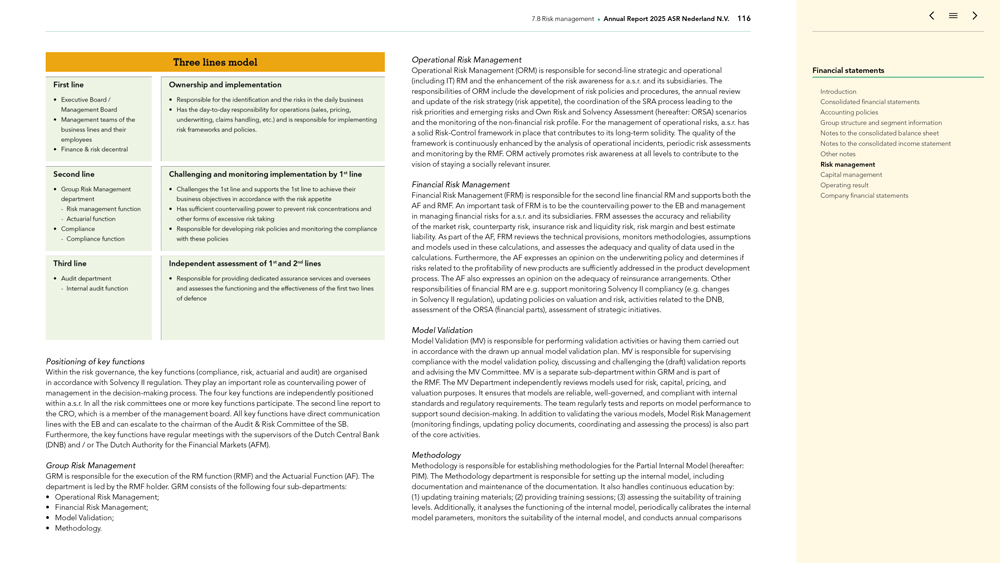
7.8 Risk management Annual Report 2025 ASR Nederland N.V. 116 Positioning of key functions Within the risk
governance, the key functions (compliance, risk, actuarial and audit) are organised in accordance with Solvency II regulation. They play an important role as countervailing power of management in the decision-making process. The four key functions
are independently positioned within a.s.r. In all the risk committees one or more key functions participate. The second line report to the CRO, which is a member of the management board. All key functions have direct communication lines with the EB
and can escalate to the chairman of the Audit & Risk Committee of the SB. Furthermore, the key functions have regular meetings with the supervisors of the Dutch Central Bank (DNB) and / or The Dutch Authority for the Financial Markets
(AFM). Group Risk Management GRM is responsible for the execution of the RM function (RMF) and the Actuarial Function (AF). The department is led by the RMF holder. GRM consists of the following four
sub-departments: Operational Risk Management; Financial Risk Management; Model Validation; Methodology. Operational Risk Management Operational Risk Management (ORM) is responsible for second-line strategic
and operational (including IT) RM and the enhancement of the risk awareness for a.s.r. and its subsidiaries. The responsibilities of ORM include the development of risk policies and procedures, the annual review and update of the risk strategy (risk
appetite), the coordination of the SRA process leading to the risk priorities and emerging risks and Own Risk and Solvency Assessment (hereafter: ORSA) scenarios and the monitoring of the non-financial risk
profile. For the management of operational risks, a.s.r. has a solid Risk-Control framework in place that contributes to its long-term solidity. The quality of the framework is continuously enhanced by the analysis of operational incidents, periodic
risk assessments and monitoring by the RMF. ORM actively promotes risk awareness at all levels to contribute to the vision of staying a socially relevant insurer. Financial Risk Management Financial Risk Management (FRM) is responsible for the
second line financial RM and supports both the AF and RMF. An important task of FRM is to be the countervailing power to the EB and management in managing financial risks for a.s.r. and its subsidiaries. FRM assesses the accuracy and reliability of
the market risk, counterparty risk, insurance risk and liquidity risk, risk margin and best estimate liability. As part of the AF, FRM reviews the technical provisions, monitors methodologies, assumptions and models used in these calculations, and
assesses the adequacy and quality of data used in the calculations. Furthermore, the AF expresses an opinion on the underwriting policy and determines if risks related to the profitability of new products are sufficiently addressed in the product
development process. The AF also expresses an opinion on the adequacy of reinsurance arrangements. Other responsibilities of financial RM are e.g. support monitoring Solvency II compliancy (e.g. changes in Solvency II regulation), updating policies
on valuation and risk, activities related to the DNB, assessment of the ORSA (financial parts), assessment of strategic initiatives. Model Validation Model Validation (MV) is responsible for performing validation activities or having them
carried out in accordance with the drawn up annual model validation plan. MV is responsible for supervising compliance with the model validation policy, discussing and challenging the (draft) validation reports and advising the MV Committee. MV is a
separate sub-department within GRM and is part of the RMF. The MV Department independently reviews models used for risk, capital, pricing, and valuation purposes. It ensures that models are reliable,
well-governed, and compliant with internal standards and regulatory requirements. The team regularly tests and reports on model performance to support sound decision-making. In addition to validating the various models, Model Risk Management
(monitoring findings, updating policy documents, coordinating and assessing the process) is also part of the core activities. Methodology Methodology is responsible for establishing methodologies for the Partial Internal Model (hereafter: PIM). The
Methodology department is responsible for setting up the internal model, including documentation and maintenance of the documentation. It also handles continuous education by: (1) updating training materials; (2) providing training
sessions; (3) assessing the suitability of training levels. Additionally, it analyses the functioning of the internal model, periodically calibrates the internal model parameters, monitors the suitability of the internal model, and conducts
annual comparisons Financial statements Introduction Consolidated financial statements Accounting policies Group structure and segment information Notes to the consolidated balance sheet Notes to the consolidated income statement Other notes Risk
management Capital management Operating result Company financial statements
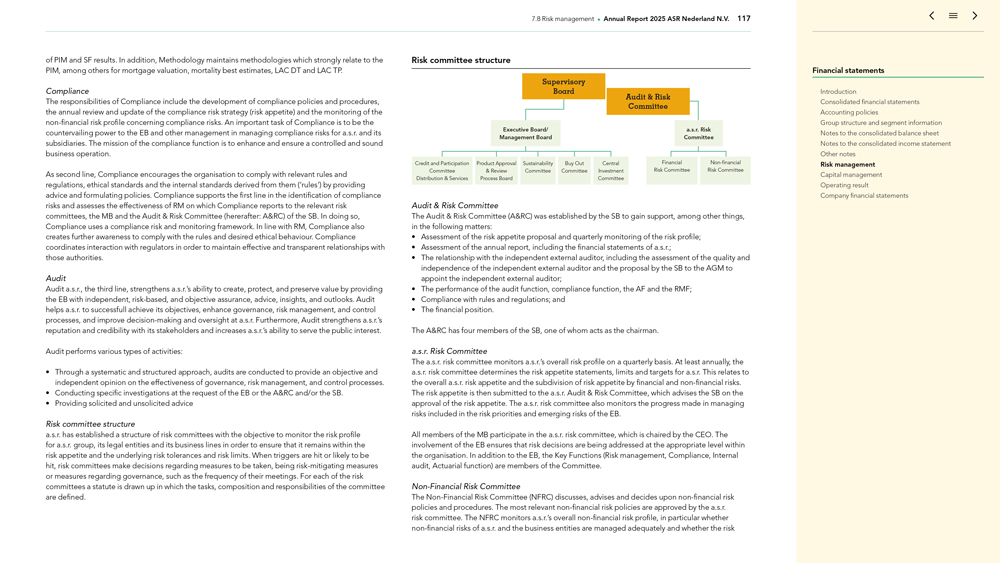
7.8 Risk management Annual Report 2025 ASR Nederland N.V. 117 of PIM and SF results. In addition, Methodology
maintains methodologies which strongly relate to the PIM, among others for mortgage valuation, mortality best estimates, LAC DT and LAC TP. Compliance The responsibilities of Compliance include the development of compliance policies and procedures,
the annual review and update of the compliance risk strategy (risk appetite) and the monitoring of the non-financial risk profile concerning compliance risks. An important task of Compliance is to be the
countervailing power to the EB and other management in managing compliance risks for a.s.r. and its subsidiaries. The mission of the compliance function is to enhance and ensure a controlled and sound business operation. As second line, Compliance
encourages the organisation to comply with relevant rules and regulations, ethical standards and the internal standards derived from them (‘rules’) by providing advice and formulating policies. Compliance supports the first line in the
identification of compliance risks and assesses the effectiveness of RM on which Compliance reports to the relevant risk committees, the MB and the Audit & Risk Committee (hererafter: A&RC) of the SB. In doing so, Compliance uses a
compliance risk and monitoring framework. In line with RM, Compliance also creates further awareness to comply with the rules and desired ethical behaviour. Compliance coordinates interaction with regulators in order to maintain effective and
transparent relationships with those authorities. Audit Audit a.s.r., the third line, strengthens a.s.r.’s ability to create, protect, and preserve value by providing the EB with independent, risk-based, and objective assurance, advice,
insights, and outlooks. Audit helps a.s.r. to successfull achieve its objectives, enhance governance, risk management, and control processes, and improve decision-making and oversight at a.s.r. Furthermore, Audit strengthens a.s.r.’s
reputation and credibility with its stakeholders and increases a.s.r.’s ability to serve the public interest. Audit performs various types of activities: Through a systematic and structured approach, audits are conducted to provide an
objective and independent opinion on the effectiveness of governance, risk management, and control processes. Conducting specific investigations at the request of the EB or the A&RC and/or the SB. Providing solicited and unsolicited advice Risk
committee structure a.s.r. has established a structure of risk committees with the objective to monitor the risk profile for a.s.r. group, its legal entities and its business lines in order to ensure that it remains within the risk appetite and the
underlying risk tolerances and risk limits. When triggers are hit or likely to be hit, risk committees make decisions regarding measures to be taken, being risk-mitigating measures or measures regarding governance, such as the frequency of their
meetings. For each of the risk committees a statute is drawn up in which the tasks, composition and responsibilities of the committee are defined. Risk committee structure Supervisory Board Audit & Risk Committee Executive Board/ a.s.r.
Risk Management Board Committee Credit and Participation Product Approval Sustainability Buy Out Central Financial Non-financial Committee & Review Committee Committee Investment Risk Committee Risk
Committee Distribution & Services Process Board Committee Audit & Risk Committee The Audit & Risk Committee (A&RC) was established by the SB to gain support, among other things, in the following matters: Assessment of
the risk appetite proposal and quarterly monitoring of the risk profile; Assessment of the annual report, including the financial statements of a.s.r.; The relationship with the independent external auditor, including the assessment of the quality
and independence of the independent external auditor and the proposal by the SB to the AGM to appoint the independent external auditor; The performance of the audit function, compliance function, the AF and the RMF; Compliance with rules and
regulations; and The financial position. The A&RC has four members of the SB, one of whom acts as the chairman. a.s.r. Risk Committee The a.s.r. risk committee monitors a.s.r.’s overall risk profile on a quarterly basis. At least annually,
the a.s.r. risk committee determines the risk appetite statements, limits and targets for a.s.r. This relates to the overall a.s.r. risk appetite and the subdivision of risk appetite by financial and
non-financial risks. The risk appetite is then submitted to the a.s.r. Audit & Risk Committee, which advises the SB on the approval of the risk appetite. The a.s.r. risk committee also monitors the
progress made in managing risks included in the risk priorities and emerging risks of the EB. All members of the MB participate in the a.s.r. risk committee, which is chaired by the CEO. The involvement of the EB ensures that risk decisions are
being addressed at the appropriate level within the organisation. In addition to the EB, the Key Functions (Risk management, Compliance, Internal audit, Actuarial function) are members of the Committee.
Non-Financial Risk Committee The Non-Financial Risk Committee (NFRC) discusses, advises and decides upon non-financial risk
policies and procedures. The most relevant non-financial risk policies are approved by the a.s.r. risk committee. The NFRC monitors a.s.r.’s overall non-financial
risk profile, in particular whether non-financial risks of a.s.r. and the business entities are managed adequately and whether the risk Financial statements Introduction Consolidated financial statements
Accounting policies Group structure and segment information Notes to the consolidated balance sheet Notes to the consolidated income statement Other notes Risk management Capital management Operating result Company financial statements
7.8 Risk management Annual Report 2025 ASR Nederland N.V. 118 profile stays within the agreed risk limits. If
the risk profile exceeds the limits, the NFRC takes mitigating actions. The NFRC reports to the a.s.r. risk committee. The NFRC is chaired by a member of the EB. The NFRC discusses the most important risks from the underlying non-financial risk committees (Business Risk Committee (BRC)). Financial Risk Committee The Financial Risk Committee (FRC) discusses, advises and decides upon financial risk policies. The most relevant financial
risk policies are approved by the a.s.r. risk committee. The FRC monitors that financial risks of a.s.r. and the business entities are managed adequately and monitors that the risk profile stays within the agreed risk limits. If the risk profile
exceeds the limits, the NFR takes mitigating actions. The FRC reports to the a.s.r. risk committee. The Chairman of the FRC is the CFO. Credit and Participation Committee Distribution & Services In the Credit and Participation Committee
Distribution & Services (hereafter: CPC D&S), acquisition, credit, and combined participation and credit proposals (D&S proposals) within the scope of the Distribution and Services segment of a.s.r. (D&S segment) are assessed.
The CPC D&S is authorised to decide on proposals with a total investment between € 2 million and € 7.5 million. The management of D&S is independently authorised for decisions up to € 2 million.
Decisions on proposals above € 7.5 million are reserved for the EB, with advice from the CPC D&S. The chair of the CPC D&S is the CFO of a.s.r. Product Approval and Review Process Board The Product Approval & Review
Process Board (PARP Board) is responsible for the final decision-making process around the introduction of new products and adjustments in existing products. The committee evaluates a.o. if potential risks in newly developed and adjusted products
are sufficiently addressed. New products need to be developed in such a way that they are cost efficient, reliable, useful and secure for our clients. New products also need to have a strategic fit with a.s.r.’s mission to be a solid and
trustful insurer. In addition, the risks of existing products are evaluated, as requested by the PARP as a result of product reviews. The PARP Board is chaired by the managing Director of Services. The chair of the PARP reports to both COO’s
and yearly to the MB. Sustainability Committee The Sustainability Committee (hereafter: SC) aims to review and advise on central and decentralised draft policies related to sustainability before these policies are submitted for approval to the Board
of Directors or the competent committee. Additionally, dilemmas, complications, and conflicting interests in the field of sustainability (including ESG and CDD/KYC) that arise at a.s.r. and/or one of the (sub)committees are discussed. The chair of
the SC is the Director of Communications. Buy Out Committee In 2025, the Buy Out Committee was added to the Risk Committee Structure. The Buy Out Committee approves the pricing assumptions and methodology related to buyouts. In addition, it
determines the buyout strategy and sets risk appetite, which is approved by the MB. The Buy Out Committee also monitors completed buy outs and makes use of emerging experience to adjust assumptions and methodology where necessary. It follows
developments on the buy out market and a.s.r.’s position. It ensures that improvement plans are followed up. The Buy Out Cimmittee is chaired by the CFO. Central Investment Committee In addition to the risk committee structure, the Central
Investment Committee (CIC) monitors tactical decisions and the execution of the investment policy. It takes investment decisions within the boundaries of the strategic asset allocation as agreed upon in the FRC. The CIC bears particular
responsibility for investment decisions exceeding the mandate of the investment department. The CIC is chaired by the CFO. Distribution & Services The a.s.r. subsidiaries D&S Holding, Corins and Robidus operate their own risk management
system. On a quarterly basis, they report to a.s.r. amongst others on the key (developments in) non- financial risks. These outcomes are discussed with a.s.r. GRM and Compliance and are subsequently discussed with either the SB or the EB of a.s.r.
7.8.1.1.3 Systems and data GRC tooling is implemented to support the RM process by giving guidance and insight into the key risk indicators, risk tolerance levels, boundaries and actions and remediation plans to mitigate risks. The availability,
adequacy and quality of data and IT systems is important in order to ensure that correct figures are reported and risk mitigating measures can be taken in time. It is important to establish under which conditions the management information that is
submitted to the risk committees has been prepared and which quality safeguards were applied in the process of creating this information. This allows the risk committees to ascertain whether the information is sufficient to base further decisions
upon. a.s.r. has a Data Quality policy in place to support the availability of correct management information. This policy is evaluated on an annual basis and revised at least every three years to keep the standards in line with the latest
developments on information and data management. The quality of the information is reviewed based on the following aspects, based on Solvency II: completeness (including documentation of accuracy of results) adequacy reliability timeliness Adherence
to this policy is ensured by the three lines model. With a Central Data Office, additional measures are taken to increase maturity in data management practices. The data risk governance and committee structure in place ensures that ownership and
decision making regarding assumptions and the plausibility of the results is effectively organised. The information involved tends to be sensitive. To prevent unauthorised persons from accessing it, it is disseminated using a secure channel or
protected files. a.s.r.’s information security policy contains guidelines in this respect. Financial statements Introduction Consolidated financial statements Accounting policies Group structure and segment information Notes to the
consolidated balance sheet Notes to the consolidated income statement Other notes Risk management Capital management Operating result Company financial statements
7.8 Risk management Annual Report 2025 ASR Nederland N.V. 119 a.s.r.’s information security policy is
based on relevant laws and market standards, like ISO 2700x, COBIT 2019, NIST Cybersecurity framework, SOC2 principles, PCI DSS, COSO, BS 25999, ISO 31000 and ITIL. These standards describes best practices for the implementation of information
security. For the Digital Operational Resilience Act (hereafter: DORA), important changes in 2025 per DORA pillar are: ICT Risk Management: a strengthened, centralised, and top-down approach has been adopted
through an IT Risk Framework for ICT governance and risk management. Best practice controls are now mandatory and implemented via comply-or-explain principles. Incident
Management: IT incident monitoring has been intensified with a new process to promptly notify and report major DORA incidents to regulators. There is now more focus on business continuity rather than solely IT continuity. Digital Resilience: focus
on the critical and important business functions, with controls formalised or adjusted as necessary to comply with DORA. Management of Third-Party Risk: concentration risks and critical suppliers have been identified. Reporting has been improved,
and a processing register along with mandatory reporting templates have been implemented. Where necessary, contracts with third-party suppliers have been revised. ICT Information Sharing: information exchange between a.s.r., other financial
institutions, and regulators has been improved, with active contributions to collaborations. As of 2025, a.s.r. substantially complies with the DORA regulations, which have been integrated into a.s.r.’s information security policy. The
requirements for design and implementation have been met, and our current focus is on demonstrating the operational effectiveness. There are technical solutions for accomplishing this, by enforcing a layered approach
(defence-in-depth) of technical measures to avoid unauthorised persons to compromise a.s.r. data and systems. In this perspective, one may think of methods of logical
access management, intrusion detection techniques, in combination with firewalls are aimed at preventing hackers and other unauthorised persons from accessing information stored on a.s.r. systems. Nevertheless, confidential information can also have
been committed to paper. On top of technical measures a.s.r. implemented physical measures and measures that help create the desired level of awareness of personnel as part of the information security environment. The resilience of these measures is
actively tested. When user defined models (e.g. spreadsheets) are used for supporting the RM framework, the ‘a.s.r. Standard for End user computing’ defines and describes a.s.r. practices in order to guard the reliability and
confidentiality of these tools and models. a.s.r. recognises the importance of sound data quality and information management systems. The management of IT and data risks of the implemented tools, models and systems (including data) is part of
Operational (IT) Risk Management. 7.8.1.1.4 Risk policies and procedures a.s.r. has established guidelines, including policies that cover all main risk categories (market, counterparty default, liquidity, underwriting, strategic and operational).
These policies address the accountabilities and responsibilities regarding management of the different risk types. Furthermore, the methodology for risk measurement is included in the policies. The content of the policies is aligned to create a
consistent and complete set. GRM maintains the risk policies, Compliance maintains the compliance policies and both GRM and Compliance monitor the proper implementation in the business. New risk policies or updates of existing risk policies are
approved by the risk committees as mentioned previously. a.s.r. has established an overall policyhouse (formally managed by the Compliance Function), including an integrated policy calendar which includes all risk related documents. This guarantees
that policies are drawn up and reassessed in a timely manner where ownership and responsibilities are clear. a.s.r. employees gain risk management knowledge and skills through the implementation of risk management policies, procedures and practices
and the execution and testing of controls within business processes for sound and controlled business operations. Training courses that cover the main risk-related topics, presentations, workshops, gamification and the use of governance, risk &
compliance tooling also contribute to this. In addition, risk management employees keep their knowledge and skills up to date through training courses—including in the context of permanent education—that cover specific risk-related
topics. 7.8.1.1.5 Risk culture Risk awareness is a vital component of building a sound risk culture within a.s.r. that emphasises the human aspect in the management of risks. In addition to gaining sufficient knowledge, skills, capabilities and
experience in RM, it is essential that an organisation enables objective and transparent risk reporting in order to manage them more effectively. The MB clearly recognises the importance of RM and is therefore represented in all of the major group
level risk committees. Risk Management is involved in the strategic decision-making process, where the company’s risk appetite is always considered. The awareness of risks during decision-making is continually addressed when making business
decisions, for example by discussing and reviewing risk scenarios and the positive and / or negative impact of risks before finalising decisions. It is very important that this risk awareness trickles down to all parts of the organisation, and
therefore management actively encourages personnel to be aware of risks during their tasks and projects, in order to avoid risks or mitigate them when required. The execution of risk analyses is embedded in daily business in, for example, projects,
product design and outsourcing. In doing so, a.s.r. aims to create a solid risk culture in which ethical values, desired behaviours and understanding of risk in the entity are fully embedded. Integrity is of the utmost importance at a.s.r.: this is
translated into a code of conduct and strict application policies for new and existing personnel, such as taking an oath or solemn affirmation when entering the company, and the ‘fit and proper’ aspect of the Solvency II regulation,
ensuring that a.s.r. is overseen and managed in a professional manner. Furthermore, a.s.r. believes it is important that a culture is created in which risks can be discussed openly and where risks are not merely perceived to be negative and
highlight that risks can also present a.s.r. with opportunities. Risk Management (both centralised and decentralised) and Compliance are positioned as such, that they can communicate and report on risks independently and transparently, which also
contributes to creating a proper risk culture. Financial statements Introduction Consolidated financial statements Accounting policies Group structure and segment information Notes to the consolidated balance sheet Notes to the consolidated income
statement Other notes Risk management Capital management Operating result Company financial statements
7.8 Risk management Annual Report 2025 ASR Nederland N.V. 120 7.8.1.1.6 Risk management process The RM process
typically comprises of five important steps: 1) identifying; 2) measuring; 3) managing; 4) monitoring and reporting; and 5) evaluating. a.s.r. has defined a procedure for performing risk analyses and standards for specific assessments. The five
different steps are explained in this chapter. Identifying Management should endeavour to identify all possible risks that may impact the strategic, tactical and operational objectives of a.s.r., ranging from the larger and / or more significant
risks posed on the overall business, down to the smaller risks associated with individual projects or smaller business lines. Risk identification comprises of the process of identifying and describing risk sources, events, and the causes and effects
of those events. Measuring After risks have been identified, quantitative or qualitative assessments of these risks take place to estimate the likelihood and impact associated with them. Methods applicable to the assessment of risks are: Sensitivity
analysis Stress testing Scenario analysis Expert judgments (regarding likelihood and impact) Portfolio analysis Managing Typically, there are four strategies to managing risk: Accept: risk acceptance means accepting that a risk might have
consequences, without taking any further mitigating measures. Avoid: risk avoidance is the elimination of activities that cause the risk. Transfer: risk transference is transferring the impact of the risk to a third party. Mitigate: risk mitigation
involves the mitigation of the risk likelihood and / or impact. RM strategies are chosen in a way that ensures that a.s.r. remains within the risk appetite tolerance levels and limits. Monitoring and reporting The risk identification process is not
a continuous exercise. Therefore, risk monitoring and reporting are required to capture changes in environments and conditions. This also means that RM strategies could, or perhaps should, be adapted in accordance with risk appetite tolerance levels
and limits. Evaluating The evaluation step is twofold. On the one hand, evaluation means risk exposures are evaluated against risk appetite tolerance levels and limits, taking (the effectiveness of) existing mitigation measures into account. The
outcome of the evaluation could lead to a decision regarding further mitigating measures or changes in RM strategies. On the other hand, the RM framework (including the risk management processes) is evaluated by the RM function, in order to
continuously improve the effectiveness of the RM framework as a whole. 7.8.1.1.7 Assessment of the RM and Internal Control system As part of the Statement on RM (hereafter: VOR, ‘Verklaring omtrent Risicobeheersing’), and Internal
Control system, a.s.r. applies a structured process to assess the design and effectiveness of its RM and control system. This process is aligned with the Dutch Corporate Governance Code and regulatory requirements and includes: Framework and
Governance: based on internationally recognised standards (COSO ERM, ISO 31000) and operating within the three lines model, with clear allocation of responsibilities and escalation paths to the EB and A&RC. Assessment Approach: combines
self-assessments by the first line, second-line reviews by Risk Management and Compliance, and independent audits by Internal Audit to provide a comprehensive view of system effectiveness. Assurance Mapping: assurance mapping is used to document the
level of assurance for each critical risk category. This mapping identifies responsibilities, testing activities, and any gaps across the assurance chain, which includes first- and second-line functions. The mapping is updated annually and discussed
in relevant risk committees. Effectiveness Assessment: key elements of the RM process are supported by defined effectiveness criteria, monitored against thresholds to confirm proper functioning and provide confidence to the EB. GRC Technology: GRC
software supports risk registration, control tracking, incident management, and reporting through dashboards and risk reports. Monitoring and Reporting: continuous second-line monitoring and consolidated reporting ensure oversight and
accountability, with improvement actions implemented where necessary. Assessment of Control System maturity a.s.r. identified several areas for further improvement within its risk management and internal control system. To enhance the overall
maturity and effectiveness of the framework, a.s.r. is implementing improvement measures across the following topics: Risk Governance: a.s.r. evaluates whether risk categories are sufficiently embedded across the risk chain based on assurance
mapping. Systems and Data: improved data quality in GRC tooling and dashboarding ensures accuracy, relevance, and alignment with user needs. Processes: a.s.r. aims to improve the execution of risk analyses by strengthening structural planning and
ensuring timely, high-quality delivery Risk Frameworks: enhancing frameworks to the desired maturity level, ensuring consistency, adequate control mix, and integration into ORM policies and procedures. Monitoring: strengthen second-line monitoring
by further developing the monitoring plan. These initiatives aim to increase maturity of the RM and internal control system ensuring stronger governance and improved transparency. Key Developments In 2025, a.s.r. continued to further develop its RM
and internal control system following the successful integration of Aegon activities in 2024. The focus was on creating efficient, data-driven processes, standardising methodologies, and reducing complexity through centralisation. These measures aim
Financial statements Introduction Consolidated financial statements Accounting policies Group structure and segment information Notes to the consolidated balance sheet Notes to the consolidated income statement Other notes Risk management Capital
management Operating result Company financial statements
7.8 Risk management Annual Report 2025 ASR Nederland N.V. 121 to improve transparency, ensure consistent
practices across the organisation, and maintain cost efficiency. Key initiatives included the optimisation of risk management policies and procedures, refinement of risk appetite, development of control frameworks and reporting standards, and the
redesign and standardisation of Governance, Risk and Compliance (GRC) tooling. Additional improvements focused on reducing control burden, accelerating reporting cycles, and leveraging innovative solutions such as AI to support the risk management
process. As part of the PIM, which combines internal model components with standard formula capital charges to determine the SCR, a.s.r. continued to monitor and adjust internal models to ensure alignment with its risk profile and governance
requirements. The Model Risk Management (MRM) policy was revised to introduce stricter compliance requirements while allowing greater flexibility for tailored control measures. These developments provide a solid foundation for a future-proof risk
management system aligned with a.s.r.’s strategic objectives. Efforts will continue in 2026 to further embed these enhancements within the organisation. 7.8.1.2 a.s.r.’s risk categories A clear and consistent risk taxonomy is fundamental
to translating the risk strategy into well-defined risk appetite statements. It provides a structured framework of risk categories relevant to the organisation, serving as a common basis for identifying, assessing, reporting, and monitoring risks.
This structure enables strategic objectives to be aligned with specific risk categories, allowing risk appetite to be explicitly determined for each category. a.s.r. introduced a new, two-tier taxonomy for non-financial risk (NFR) in 2024. This taxonomy became fully operational in 2025 and now constitutes the standard framework for NFR reporting. The classifications at both Level 1 and Level 2 have been
preserved, with risk indicators assigned at both levels in each risk report. Within a.s.r. the following two non-financial risk categories are distinguished: Operational risk Strategic risk a.s.r. also revised
the taxonomy for the financial risks in 2024. Where the risks used to be categorised based on the Standard Formula taxonomy, separate categories are now defined for risks types with a comparable degree of appetite. This results in the following four
categories of financial risks: Underwriting risk Investment & counterparty default risk Mismatch risk Liquidity risk The Partial Internal Model (PIM) is used the manage the exposure of the different risk types within the appetite of the
corresponding category. a.s.r. life, Aegon life, and Aegon Spaarkas have implemented a PIM, which combines internal model components with Standard Formula capital charges to determine the Solvency Capital Requirement (SCR). Following the Use Test
requirements of Solvency II, the PIM is also used in the risk management system of a.s.r. In addition, a.s.r. recognises sustainability risks arising from environmental, social or governance (ESG) events or conditions. These risks can be financial
and non-financial and can be both strategic and operational. This means that all six main risk categories that a.s.r. recognises can be affected by sustainability risks. Underwriting risk Underwriting risk is
the risk that premium and / or investment income or outstanding reserves will not be sufficient to cover current or future payment obligations, due to the application of inaccurate technical or other assumptions and principles when developing and
pricing products. a.s.r. recognises the following insurance risks: Life underwriting risk Health underwriting risk Non-life underwriting risk Investment & counterparty risk The risk of changes in
values caused by market prices or volatility of market prices differing from their expected values, or losses due to the unexpected failure to pay or credit rating downgrade of counterparties and debtors. The following types of risks are
distinguished: Fixed income risk Mortgage prepayment risk Equity level risk Equity volatility risk Property risk Currency risk Concentration risk / market concentration risk Counterparty default risk Mismatch risk The risk of losses caused by market
movements that impact the assets and liabilities side of the balance sheet differently. The following risk types are distinguished: Interest rate risk Interest rate volatility risk Inflation risk Liquidity risk Liquidity risk is the risk that a.s.r.
is not able to meet its financial obligations to policyholders and other creditors when they become due and payable, at a reasonable cost and in a timely manner. Financial statements Introduction Consolidated financial statements Accounting policies
Group structure and segment information Notes to the consolidated balance sheet Notes to the consolidated income statement Other notes Risk management Capital management Operating result Company financial statements
7.8 Risk management Annual Report 2025 ASR Nederland N.V. 122 Operational risk Operational risk is the risk of
losses caused by weak or failing internal procedures, weaknesses in the action taken by personnel, weaknesses in systems or because of external events. The following subcategories of operational risk are used, among others: Process Information
technology Project Reporting & Model Integrity Strategic risk Strategic risk is the risk of a.s.r. or its business lines failing to achieve the objectives due to incorrect decision-making, incorrect implementation and / or an inadequate
response to changes in the environment. Such changes may arise in the following areas: Macro-economic Geopolitical instability Climate change and energy transition Cyber and information security Artificial intelligence Regulation Biodiversity Social
tensions Pandemics Strategic risk may arise due to a mismatch between two or more of the following components: the objectives (resulting from the strategy), the resources used to achieve the objectives, the quality of implementation, the economic
climate and / or the market in which a.s.r. and / or its business lines operate. Financial statements Introduction Consolidated financial statements Accounting policies Group structure and segment information Notes to the consolidated balance sheet
Notes to the consolidated income statement Other notes Risk management Capital management Operating result Company financial statements
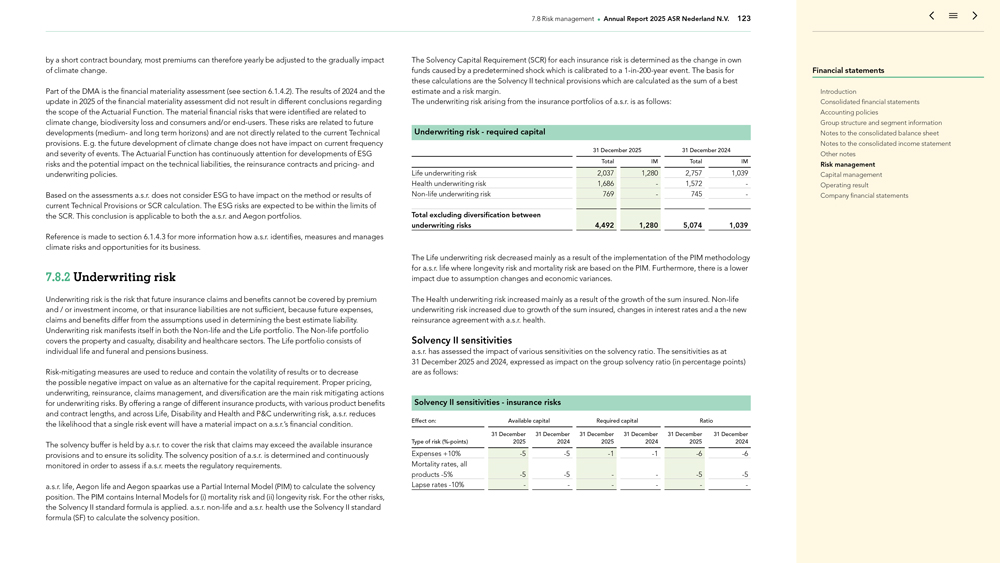
7.8 Risk management Annual Report 2025 ASR Nederland N.V. 123 by a short contract boundary, most premiums can
therefore yearly be adjusted to the gradually impact of climate change. Part of the DMA is the financial materiality assessment (see section 6.1.4.2) . The results of 2024 and the update in 2025 of the financial materiality assessment did not result
in different conclusions regarding the scope of the Actuarial Function. The material financial risks that were identified are related to climate change, biodiversity loss and consumers and/or end-users. These
risks are related to future developments (medium- and long term horizons) and are not directly related to the current Technical provisions. E.g. the future development of climate change does not have impact on current frequency and severity of
events. The Actuarial Function has continuously attention for developments of ESG risks and the potential impact on the technical liabilities, the reinsurance contracts and pricing- and underwriting policies. Based on the assessments a.s.r. does not
consider ESG to have impact on the method or results of current Technical Provisions or SCR calculation. The ESG risks are expected to be within the limits of the SCR. This conclusion is applicable to both the a.s.r. and Aegon portfolios. Reference
is made to section 6.1.4.3 for more information how a.s.r. identifies, measures and manages climate risks and opportunities for its business. 7.8.2 Underwriting risk Underwriting risk is the risk that future insurance claims and benefits cannot be
covered by premium and / or investment income, or that insurance liabilities are not sufficient, because future expenses, claims and benefits differ from the assumptions used in determining the best estimate liability. Underwriting risk manifests
itself in both the Non-life and the Life portfolio. The Non-life portfolio covers the property and casualty, disability and healthcare sectors. The Life portfolio
consists of individual life and funeral and pensions business. Risk-mitigating measures are used to reduce and contain the volatility of results or to decrease the possible negative impact on value as an alternative for the capital requirement.
Proper pricing, underwriting, reinsurance, claims management, and diversification are the main risk mitigating actions for underwriting risks. By offering a range of different insurance products, with various product benefits and contract lengths,
and across Life, Disability and Health and P&C underwriting risk, a.s.r. reduces the likelihood that a single risk event will have a material impact on a.s.r.’s financial condition. The solvency buffer is held by a.s.r. to cover the risk
that claims may exceed the available insurance provisions and to ensure its solidity. The solvency position of a.s.r. is determined and continuously monitored in order to assess if a.s.r. meets the regulatory requirements. a.s.r. life, Aegon life
and Aegon spaarkas use a Partial Internal Model (PIM) to calculate the solvency position. The PIM contains Internal Models for (i) mortality risk and (ii) longevity risk. For the other risks, the Solvency II standard formula is applied.
a.s.r. non-life and a.s.r. health use the Solvency II standard formula (SF) to calculate the solvency position. The Solvency Capital Requirement (SCR) for each insurance risk is determined as the change in own
funds caused by a predetermined shock which is calibrated to a 1-in-200-year event. The basis for these calculations are the
Solvency II technical provisions which are calculated as the sum of a best estimate and a risk margin. The underwriting risk arising from the insurance portfolios of a.s.r. is as follows: Underwriting risk—required capital 31 December
2025 31 December 2024 Total IM Total IM Life underwriting risk 2,037 1,280 2,757 1,039 Health underwriting risk 1,686—1,572 -Non-life underwriting risk
769—745— Total excluding diversification between underwriting risks 4,492 1,280 5,074 1,039 The Life underwriting risk decreased mainly as a result of the implementation of the PIM methodology for a.s.r. life where longevity risk and
mortality risk are based on the PIM. Furthermore, there is a lower impact due to assumption changes and economic variances. The Health underwriting risk increased mainly as a result of the growth of the sum insured.
Non-life underwriting risk increased due to growth of the sum insured, changes in interest rates and a the new reinsurance agreement with a.s.r. health. Solvency II sensitivities a.s.r. has assessed the impact
of various sensitivities on the solvency ratio. The sensitivities as at 31 December 2025 and 2024, expressed as impact on the group solvency ratio (in percentage points) are as follows: Solvency II sensitivities—insurance risks Effect on:
Available capital Required capital Ratio 31 December 31 December 31 December 31 December 31 December 31 December Type of risk (%-points) 2025 2024 2025 2024 2025 2024 Expenses +10%
-5 -5 -1 -1 -6
-6 Mortality rates, all products -5% -5 -5 —
-5 -5 Lapse rates -10% — — — Financial statements Introduction Consolidated financial statements Accounting
policies Group structure and segment information Notes to the consolidated balance sheet Notes to the consolidated income statement Other notes Risk management Capital management Operating result Company financial statements
7.8 Risk management Annual Report 2025 ASR Nederland N.V. 124 Solvency II sensitivities—explanation Risk
Scenario Expense risk Measured as the impact of a 10% increase in expense levels. Mortality risk Measured as the impact of a 5% decrease in all mortality rates. Lapse risk Measured as the risk of a 10% decrease in lapse rates. The table shows that
the SCR sensitivities in 2025 are similar to the sensitivities of 2024. The impact on the ratio is the opposite if a reversed scenario is taken into account. 7.8.2.1 Life Underwriting risk The Life portfolio can be divided into Individual life and
Funeral and Pensions. The insurance contracts are sold primarily to retail and wholesale clients through intermediaries. The products are sold as insurance products in cash or unit-linked contracts. With respect to products in cash, the investment
risk is fully borne by the insurer whereas, in the case of unit-linked products, the majority of the investment risk is for the policyholder’s account. The solvency capital requirement (SCR) for Life underwriting risks is determined per policy
for the Funeral and Individual Life portfolio and per participant for the Pension portfolio. All shocks are applied to each policy/participant and an SCR value is only determined if applying the shock leads to a higher best estimate. The following
Life underwriting risks are involved: Mortality risk Mortality risk is associated with (re)insurance obligations, such as endowment or term assurance policies, where a payment or payments are made in case of the policyholder’s death during the
contract term. The required capital for this risk under SF is calculated as the change in own funds of a permanent increase of mortality rates by 15% for all ages and each policy. The SF calculation applies to the 2024 figures of a.s.r. life. As of
2025, a.s.r life is also based on an Internal Model to calculate the mortality risk factor, al long with Aegon life and Aegon spaarkas. This risk factor contains shocks on both the level (experience) and the trend (population) of the mortality
table. It projects mortality rates by age and gender. Longevity risk Longevity risk is associated with (re)insurance obligations where payments are made until the death of the policyholder and where a decrease in mortality rates results in higher
technical provisions. The required capital for this risk under SF is calculated as the change in own funds of a permanent decrease of mortality rates by 20%. The SF calculation applies to the 2024 figures of a.s.r. life. As of 2025, a.s.r life is
also based on an Internal Model to calculate the longevity risk factor, al long with Aegon life and Aegon spaarkas. This risk factor contains shocks on both the level (experience) and the trend (population) of the mortality table. It projects
mortality rates by age and gender. Disability-morbidity risk Morbidity or disability risk is associated with all types of insurance compensating or reimbursing losses (e.g. loss of income, adverse changes in the best estimate of the liabilities)
caused by changes in the morbidity or disability rates. Solvency II prescribes a 35% increase in disability rates for the first year, 25% for subsequent years, combined with a decrease in recovery rates of 20%. The disability-morbidity risk is
calculated on policy level by increasing the experience percentage with 35% for the first year and 25% in the second. For the IBNR reserve the shock is simplified to an average of 30% for the 2-year IBNR
cashflow. Because revalidation risk is very small, no shock is modelled for this risk. Lapse risk Lapse risk is the risk of losses (or adverse changes in the best estimate of the liabilities) due to an unanticipated (higher or lower) rate of policy
lapses, terminations, changes to paid-up status (cessation of premium payment) and surrenders. Lapse risk arises from economic losses due to policyholder behaviour deviating from expectations. Insurance
contracts typically provide policyholders with a variety of options that they may or may not exercise. Lapse risk is the risk that actual policyholder behaviour deviates from the assumptions built into the reserve calculations. This includes
assumptions about lapses, withdrawals, premium payment levels, allocation of funds, and the utilisation of possible options in the products. In general, a lapse shock is only applied if a Solvency II lapse event is actually considered possible under
the conditions of the insurance contract. For instance a paid-up policy that cannot be surrendered is not taken into account. The effect of the lapse risk is equal to the highest result of a permanent increase
in lapse rates of 50%, a permanent decrease in lapse rates of 50% or a mass lapse event (an instant lapse event of 40% of all policies). For the mass lapse event, the lapse risk is calculated as the maximum on policy level of a mass surrender or a
mass paid-up event. Within the Individual life portfolio there is a group of policies directly linked to a mortgage loan (‘Spaarhypotheken’). In case the mortgage loan is not provided by a.s.r.,
but by another party, which is the case for most of these policies, the interest that a.s.r. reimburses to the policyholder is transfered from the party that has provided the mortgage loan. This cashflow of interests from the provider of the
mortgage loan to a.s.r. represents an asset. The cashflow and value of this asset depends on the cashflow of the linked savings policy. Therefore, the change in this asset value due to mortality or lapse is taken into account when determining the
SCR for Life insurance risks. Expense risk A calculation is made of the effect on own funds of a permanent increase in costs used for determining the best estimate. It consists of an increase in the costs of 10% and an increase in the cost inflation
of 1 percentage point per year. For investment costs only an increase of 10% applies, since it has been substantiated that increases due to inflation including a shock can be absorbed by the Best Estimate itself and asset management for external
parties. Financial statements Introduction Consolidated financial statements Accounting policies Group structure and segment information Notes to the consolidated balance sheet Notes to the consolidated income statement Other notes Risk management
Capital management Operating result Company financial statements
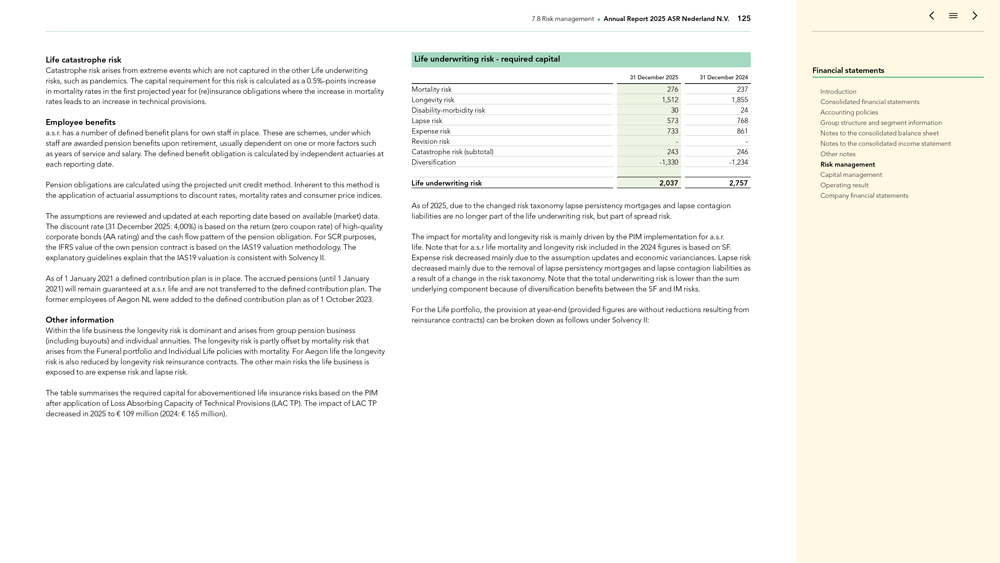
7.8 Risk management Annual Report 2025 ASR Nederland N.V. 125 Life catastrophe risk Catastrophe risk arises
from extreme events which are not captured in the other Life underwriting risks, such as pandemics. The capital requirement for this risk is calculated as a 0.5% -points increase in mortality rates in the first projected year for (re)insurance
obligations where the increase in mortality rates leads to an increase in technical provisions. Employee benefits a.s.r. has a number of defined benefit plans for own staff in place. These are schemes, under which staff are awarded pension benefits
upon retirement, usually dependent on one or more factors such as years of service and salary. The defined benefit obligation is calculated by independent actuaries at each reporting date. Pension obligations are calculated using the projected unit
credit method. Inherent to this method is the application of actuarial assumptions to discount rates, mortality rates and consumer price indices. The assumptions are reviewed and updated at each reporting date based on available (market) data. The
discount rate (31 December 2025: 4,00%) is based on the return (zero coupon rate) of high-quality corporate bonds (AA rating) and the cash flow pattern of the pension obligation. For SCR purposes, the IFRS value of the own pension contract is
based on the IAS19 valuation methodology. The explanatory guidelines explain that the IAS19 valuation is consistent with Solvency II. As of 1 January 2021 a defined contribution plan is in place. The accrued pensions (until 1 January 2021)
will remain guaranteed at a.s.r. life and are not transferred to the defined contribution plan. The former employees of Aegon NL were added to the defined contribution plan as of 1 October 2023. Other information Within the life business the
longevity risk is dominant and arises from group pension business (including buyouts) and individual annuities. The longevity risk is partly offset by mortality risk that arises from the Funeral portfolio and Individual Life policies with mortality.
For Aegon life the longevity risk is also reduced by longevity risk reinsurance contracts. The other main risks the life business is exposed to are expense risk and lapse risk. The table summarises the required capital for abovementioned life
insurance risks based on the PIM after application of Loss Absorbing Capacity of Technical Provisions (LAC TP). The impact of LAC TP decreased in 2025 to € 109 million (2024: € 165 million). Life underwriting
risk—required capital 31 December 2025 31 December 2024 Mortality risk 276 237 Longevity risk 1,512 1,855 Disability-morbidity risk 30 24 Lapse risk 573 768 Expense risk 733 861 Revision risk —Catastrophe risk (subtotal) 243
246 Diversification -1,330 -1,234 Life underwriting risk 2,037 2,757 As of 2025, due to the changed risk taxonomy lapse persistency mortgages and lapse contagion
liabilities are no longer part of the life underwriting risk, but part of spread risk. The impact for mortality and longevity risk is mainly driven by the PIM implementation for a.s.r. life. Note that for a.s.r life mortality and longevity risk
included in the 2024 figures is based on SF. Expense risk decreased mainly due to the assumption updates and economic varianciances. Lapse risk decreased mainly due to the removal of lapse persistency mortgages and lapse contagion liabilities as a
result of a change in the risk taxonomy. Note that the total underwriting risk is lower than the sum underlying component because of diversification benefits between the SF and IM risks. For the Life portfolio, the provision at year-end (provided figures are without reductions resulting from reinsurance contracts) can be broken down as follows under Solvency II: Financial statements Introduction Consolidated financial statements Accounting
policies Group structure and segment information Notes to the consolidated balance sheet Notes to the consolidated income statement Other notes Risk management Capital management Operating result Company financial statements
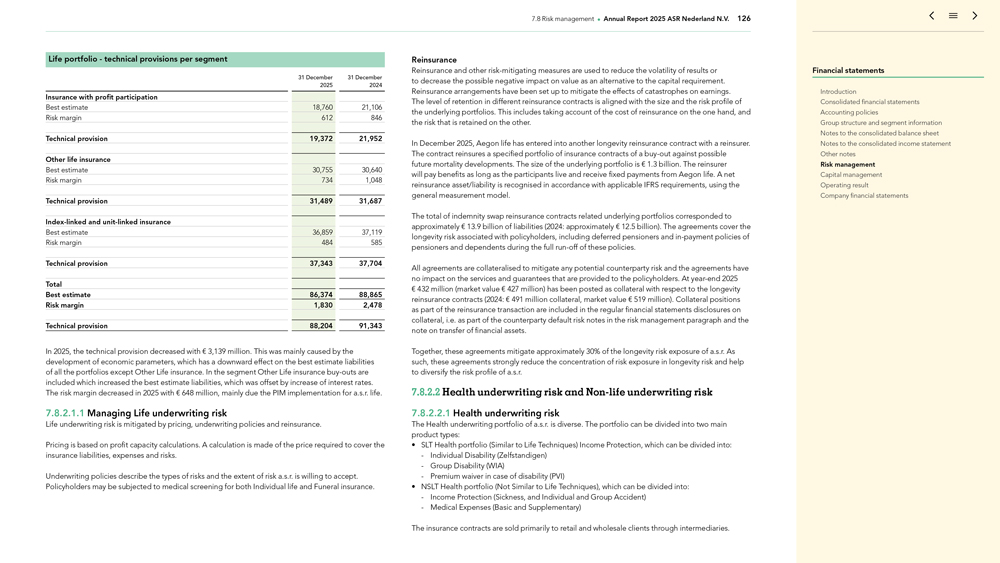
7.8 Risk management Annual Report 2025 ASR Nederland N.V. 126 Life portfolio—technical provisions per
segment 31 December 31 December 2025 2024 Insurance with profit participation Best estimate 18,760 21,106 Risk margin 612 846 Technical provision 19,372 21,952 Other life insurance Best estimate 30,755 30,640 Risk margin 734 1,048
Technical provision 31,489 31,687 Index-linked and unit-linked insurance Best estimate 36,859 37,119 Risk margin 484 585 Technical provision 37,343 37,704 Total Best estimate 86,374 88,865 Risk margin 1,830 2,478 Technical provision 88,204 91,343 In
2025, the technical provision decreased with € 3,139 million. This was mainly caused by the development of economic parameters, which has a downward effect on the best estimate liabilities of all the portfolios except Other Life
insurance. In the segment Other Life insurance buy-outs are included which increased the best estimate liabilities, which was offset by increase of interest rates. The risk margin decreased in 2025 with
€ 648 million, mainly due the PIM implementation for a.s.r. life. 7.8.2.1.1 Managing Life underwriting risk Life underwriting risk is mitigated by pricing, underwriting policies and reinsurance. Pricing is based on profit capacity
calculations. A calculation is made of the price required to cover the insurance liabilities, expenses and risks. Underwriting policies describe the types of risks and the extent of risk a.s.r. is willing to accept. Policyholders may be subjected to
medical screening for both Individual life and Funeral insurance. Reinsurance Reinsurance and other risk-mitigating measures are used to reduce the volatility of results or to decrease the possible negative impact on value as an alternative to the
capital requirement. Reinsurance arrangements have been set up to mitigate the effects of catastrophes on earnings. The level of retention in different reinsurance contracts is aligned with the size and the risk profile of the underlying portfolios.
This includes taking account of the cost of reinsurance on the one hand, and the risk that is retained on the other. In December 2025, Aegon life has entered into another longevity reinsurance contract with a reinsurer. The contract reinsures a
specified portfolio of insurance contracts of a buy-out against possible future mortality developments. The size of the underlying portfolio is € 1.3 billion. The reinsurer will pay benefits as
long as the participants live and receive fixed payments from Aegon life. A net reinsurance asset/liability is recognised in accordance with applicable IFRS requirements, using the general measurement model. The total of indemnity swap reinsurance
contracts related underlying portfolios corresponded to approximately € 13.9 billion of liabilities (2024: approximately € 12.5 billion). The agreements cover the longevity risk associated with policyholders, including
deferred pensioners and in-payment policies of pensioners and dependents during the full run-off of these policies. All agreements are collateralised to mitigate any
potential counterparty risk and the agreements have no impact on the services and guarantees that are provided to the policyholders. At year-end 2025 € 432 million (market value € 427
million) has been posted as collateral with respect to the longevity reinsurance contracts (2024: € 491 million collateral, market value € 519 million). Collateral positions as part of the reinsurance transaction are
included in the regular financial statements disclosures on collateral, i.e. as part of the counterparty default risk notes in the risk management paragraph and the note on transfer of financial assets. Together, these agreements mitigate
approximately 30% of the longevity risk exposure of a.s.r. As such, these agreements strongly reduce the concentration of risk exposure in longevity risk and help to diversify the risk profile of a.s.r. 7.8.2.2 Health underwriting risk and Non-life underwriting risk 7.8.2.2.1 Health underwriting risk The Health underwriting portfolio of a.s.r. is diverse. The portfolio can be divided into two main product types: SLT Health portfolio (Similar to Life
Techniques) Income Protection, which can be divided into: —Individual Disability (Zelfstandigen) —Group Disability (WIA) —Premium waiver in case of disability (PVI) NSLT Health portfolio (Not Similar to Life Techniques), which can
be divided into: —Income Protection (Sickness, and Individual and Group Accident) —Medical Expenses (Basic and Supplementary) The insurance contracts are sold primarily to retail and wholesale clients through intermediaries. Financial
statements Introduction Consolidated financial statements Accounting policies Group structure and segment information Notes to the consolidated balance sheet Notes to the consolidated income statement Other notes Risk management Capital management
Operating result Company financial statements
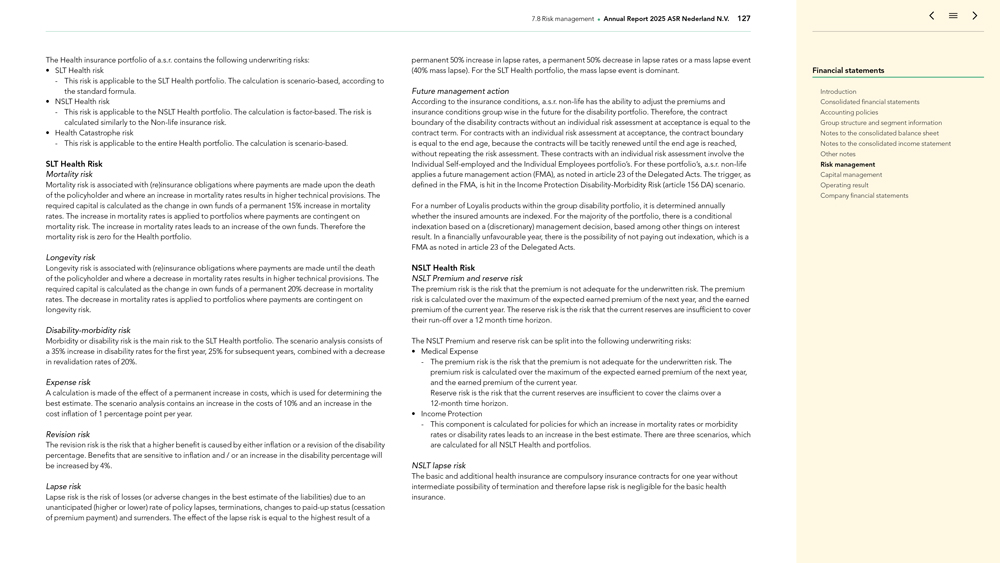
7.8 Risk management Annual Report 2025 ASR Nederland N.V. 127 The Health insurance portfolio of a.s.r. contains
the following underwriting risks: SLT Health risk —This risk is applicable to the SLT Health portfolio. The calculation is scenario-based, according to the standard formula. NSLT Health risk —This risk is applicable to the NSLT Health
portfolio. The calculation is factor-based. The risk is calculated similarly to the Non-life insurance risk. Health Catastrophe risk —This risk is applicable to the entire Health portfolio. The
calculation is scenario-based. SLT Health Risk Mortality risk Mortality risk is associated with (re)insurance obligations where payments are made upon the death of the policyholder and where an increase in mortality rates results in higher technical
provisions. The required capital is calculated as the change in own funds of a permanent 15% increase in mortality rates. The increase in mortality rates is applied to portfolios where payments are contingent on mortality risk. The increase in
mortality rates leads to an increase of the own funds. Therefore the mortality risk is zero for the Health portfolio. Longevity risk Longevity risk is associated with (re)insurance obligations where payments are made until the death of the
policyholder and where a decrease in mortality rates results in higher technical provisions. The required capital is calculated as the change in own funds of a permanent 20% decrease in mortality rates. The decrease in mortality rates is applied to
portfolios where payments are contingent on longevity risk. Disability-morbidity risk Morbidity or disability risk is the main risk to the SLT Health portfolio. The scenario analysis consists of a 35% increase in disability rates for the first year,
25% for subsequent years, combined with a decrease in revalidation rates of 20%. Expense risk A calculation is made of the effect of a permanent increase in costs, which is used for determining the best estimate. The scenario analysis contains an
increase in the costs of 10% and an increase in the cost inflation of 1 percentage point per year. Revision risk The revision risk is the risk that a higher benefit is caused by either inflation or a revision of the disability percentage. Benefits
that are sensitive to inflation and / or an increase in the disability percentage will be increased by 4%. Lapse risk Lapse risk is the risk of losses (or adverse changes in the best estimate of the liabilities) due to an unanticipated (higher or
lower) rate of policy lapses, terminations, changes to paid-up status (cessation of premium payment) and surrenders. The effect of the lapse risk is equal to the highest result of a permanent 50% increase in
lapse rates, a permanent 50% decrease in lapse rates or a mass lapse event (40% mass lapse). For the SLT Health portfolio, the mass lapse event is dominant. Future management action According to the insurance conditions, a.s.r. non-life has the ability to adjust the premiums and insurance conditions group wise in the future for the disability portfolio. Therefore, the contract boundary of the disability contracts without an individual risk
assessment at acceptance is equal to the contract term. For contracts with an individual risk assessment at acceptance, the contract boundary is equal to the end age, because the contracts will be tacitly renewed until the end age is reached,
without repeating the risk assessment. These contracts with an individual risk assessment involve the Individual Self-employed and the Individual Employees portfolio’s. For these portfolio’s, a.s.r.
non-life applies a future management action (FMA), as noted in article 23 of the Delegated Acts. The trigger, as defined in the FMA, is hit in the Income Protection Disability-Morbidity Risk (article 156 DA)
scenario. For a number of Loyalis products within the group disability portfolio, it is determined annually whether the insured amounts are indexed. For the majority of the portfolio, there is a conditional indexation based on a (discretionary)
management decision, based among other things on interest result. In a financially unfavourable year, there is the possibility of not paying out indexation, which is a FMA as noted in article 23 of the Delegated Acts. NSLT Health Risk NSLT Premium
and reserve risk The premium risk is the risk that the premium is not adequate for the underwritten risk. The premium risk is calculated over the maximum of the expected earned premium of the next year, and the earned premium of the current year.
The reserve risk is the risk that the current reserves are insufficient to cover their run-off over a 12 month time horizon. The NSLT Premium and reserve risk can be split into the following underwriting
risks: Medical Expense —The premium risk is the risk that the premium is not adequate for the underwritten risk. The premium risk is calculated over the maximum of the expected earned premium of the next year, and the earned premium of the
current year. Reserve risk is the risk that the current reserves are insufficient to cover the claims over a 12-month time horizon. Income Protection —This component is calculated for policies for which
an increase in mortality rates or morbidity rates or disability rates leads to an increase in the best estimate. There are three scenarios, which are calculated for all NSLT Health and portfolios. NSLT lapse risk The basic and additional health
insurance are compulsory insurance contracts for one year without intermediate possibility of termination and therefore lapse risk is negligible for the basic health insurance. Financial statements Introduction Consolidated financial statements
Accounting policies Group structure and segment information Notes to the consolidated balance sheet Notes to the consolidated income statement Other notes Risk management Capital management Operating result Company financial statements
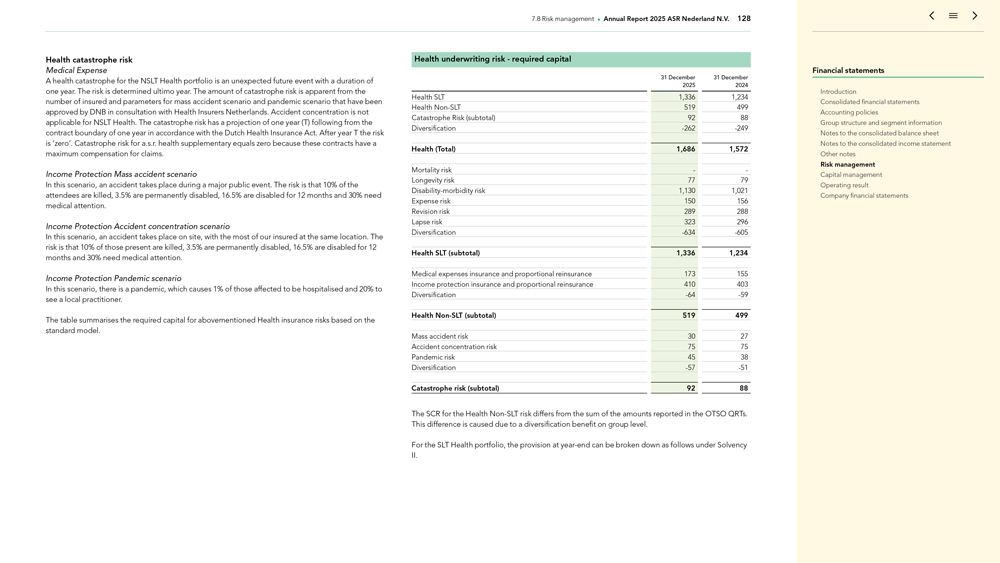
7.8 Risk management Annual Report 2025 ASR Nederland N.V. 128 Health catastrophe risk Medical Expense A health
catastrophe for the NSLT Health portfolio is an unexpected future event with a duration of one year. The risk is determined ultimo year. The amount of catastrophe risk is apparent from the number of insured and parameters for mass accident scenario
and pandemic scenario that have been approved by DNB in consultation with Health Insurers Netherlands. Accident concentration is not applicable for NSLT Health. The catastrophe risk has a projection of one year (T) following from the contract
boundary of one year in accordance with the Dutch Health Insurance Act. After year T the risk is ‘zero’. Catastrophe risk for a.s.r. health supplementary equals zero because these contracts have a maximum compensation for claims. Income
Protection Mass accident scenario In this scenario, an accident takes place during a major public event. The risk is that 10% of the attendees are killed, 3.5% are permanently disabled, 16.5% are disabled for 12 months and 30% need medical
attention. Income Protection Accident concentration scenario In this scenario, an accident takes place on site, with the most of our insured at the same location. The risk is that 10% of those present are killed, 3.5% are permanently disabled, 16.5%
are disabled for 12 months and 30% need medical attention. Income Protection Pandemic scenario In this scenario, there is a pandemic, which causes 1% of those affected to be hospitalised and 20% to see a local practitioner. The table summarises the
required capital for abovementioned Health insurance risks based on the standard model. Health underwriting risk—required capital 31 December 31 December 2025 2024 Health SLT 1,336 1,234 Health
Non-SLT 519 499 Catastrophe Risk (subtotal) 92 88 Diversification -262 -249 Health (Total) 1,686 1,572 Mortality risk
—Longevity risk 77 79 Disability-morbidity risk 1,130 1,021 Expense risk 150 156 Revision risk 289 288 Lapse risk 323 296 Diversification -634 -605 Health SLT
(subtotal) 1,336 1,234 Medical expenses insurance and proportional reinsurance 173 155 Income protection insurance and proportional reinsurance 410 403 Diversification -64
-59 Health Non-SLT (subtotal) 519 499 Mass accident risk 30 27 Accident concentration risk 75 75 Pandemic risk 45 38 Diversification
-57 -51 Catastrophe risk (subtotal) 92 88 The SCR for the Health Non-SLT risk differs from the sum of the amounts reported in the
OTSO QRTs. This difference is caused due to a diversification benefit on group level. For the SLT Health portfolio, the provision at year-end can be broken down as follows under Solvency II. Financial
statements Introduction Consolidated financial statements Accounting policies Group structure and segment information Notes to the consolidated balance sheet Notes to the consolidated income statement Other notes Risk management Capital management
Operating result Company financial statements
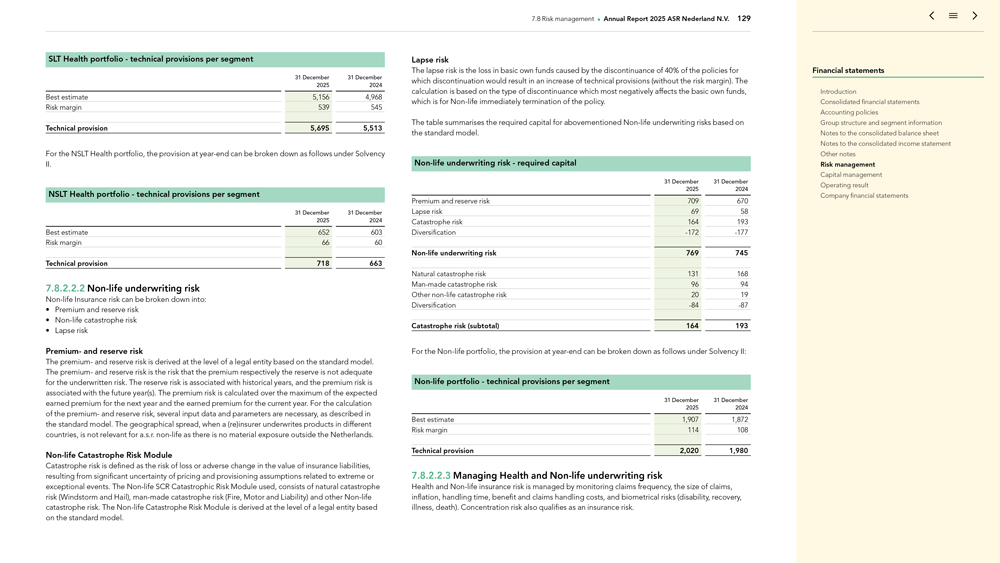
7.8 Risk management Annual Report 2025 ASR Nederland N.V. 129 SLT Health portfolio—technical provisions
per segment 31 December 31 December 2025 2024 Best estimate 5,156 4,968 Risk margin 539 545 Technical provision 5,695 5,513 For the NSLT Health portfolio, the provision at year-end can be broken down
as follows under Solvency II. NSLT Health portfolio—technical provisions per segment 31 December 31 December 2025 2024 Best estimate 652 603 Risk margin 66 60 Technical provision 718 663 7.8.2.2.2
Non-life underwriting risk Non-life Insurance risk can be broken down into: Premium and reserve risk Non-life catastrophe risk
Lapse risk Premium- and reserve risk The premium- and reserve risk is derived at the level of a legal entity based on the standard model. The premium- and reserve risk is the risk that the premium respectively the reserve is not adequate for the
underwritten risk. The reserve risk is associated with historical years, and the premium risk is associated with the future year(s). The premium risk is calculated over the maximum of the expected earned premium for the next year and the earned
premium for the current year. For the calculation of the premium- and reserve risk, several input data and parameters are necessary, as described in the standard model. The geographical spread, when a (re)insurer underwrites products in different
countries, is not relevant for a.s.r. non-life as there is no material exposure outside the Netherlands. Non-life Catastrophe Risk Module Catastrophe risk is defined as
the risk of loss or adverse change in the value of insurance liabilities, resulting from significant uncertainty of pricing and provisioning assumptions related to extreme or exceptional events. The Non-life
SCR Catastrophic Risk Module used, consists of natural catastrophe risk (Windstorm and Hail), man-made catastrophe risk (Fire, Motor and Liability) and other Non-life
catastrophe risk. The Non-life Catastrophe Risk Module is derived at the level of a legal entity based on the standard model. Lapse risk The lapse risk is the loss in basic own funds caused by the
discontinuance of 40% of the policies for which discontinuation would result in an increase of technical provisions (without the risk margin). The calculation is based on the type of discontinuance which most negatively affects the basic own funds,
which is for Non-life immediately termination of the policy. The table summarises the required capital for abovementioned Non-life underwriting risks based on the
standard model. Non-life underwriting risk—required capital 31 December 31 December 2025 2024 Premium and reserve risk 709 670 Lapse risk 69 58 Catastrophe risk 164 193 Diversification -172 -177 Non-life underwriting risk 769 745 Natural catastrophe risk 131 168 Man-made
catastrophe risk 96 94 Other non-life catastrophe risk 20 19 Diversification -84 -87 Catastrophe risk (subtotal) 164 193 For the Non-life portfolio, the provision at year-end can be broken down as follows under Solvency II: Non-life portfolio—technical
provisions per segment 31 December 31 December 2025 2024 Best estimate 1,907 1,872 Risk margin 114 108 Technical provision 2,020 1,980 7.8.2.2.3 Managing Health and Non-life underwriting risk Health
and Non-life insurance risk is managed by monitoring claims frequency, the size of claims, inflation, handling time, benefit and claims handling costs, and biometrical risks (disability, recovery, illness,
death). Concentration risk also qualifies as an insurance risk. Financial statements Introduction Consolidated financial statements Accounting policies Group structure and segment information Notes to the consolidated balance sheet Notes to the
consolidated income statement Other notes Risk management Capital management Operating result Company financial statements
7.8 Risk management Annual Report 2025 ASR Nederland N.V. 130 In recent years, measures have been taken to
improve profitability and reduce risk. Examples are: premium increases, stricter acceptance criteria, shorter claims filing terms and making use of the claims reassessment arrangement between the Dutch Association of insurers and social security
institute UWV. Effects are being monitored closely and assessed to be effective. Claims frequency, size of claim and inflation To mitigate the risk of claims, a.s.r. bases its underwriting policy on claims history and risk models. The policy is
applied to each client segment and to each type of activity. In order to limit claims and / or ensure that prices are adjusted correctly, the acceptance policy is continually refined using a number of indicators and statistical analyses. The product
lines also use knowledge or expectations with respect to future trends to estimate the frequency, size and inflation of claims. The risk of unexpected major damage claims is contained by policy limits, the concentration of risk management and
specific risk transfer contracts (e.g. reinsurance). Handling time The time required for handling and settling claims is an important factor. The settlement of claims that have a long handling time, such as liability claims, can take many years.
Analyses are performed regularly and based on a.s.r.’s experience in similar cases, historical trends – such as the pattern of liabilities – increases in risk exposure, payment of damages, the scale of current and not yet settled
damage claims, court rulings and economic conditions. Benefit and claims handling costs Taking estimated future inflation into account, benefit and claims handling costs are managed based on regular reviews and related actions. Disability risk
Disability risk is controlled by means of regular evaluation of historical claims patterns, expected future developments and price adjustments. Disability risk is mitigated by a.s.r. through underwriting criteria and a proactive reintegration
policy. a.s.r. non-life ended the mitigation of its disability risk through reinsurance in 2023. The Individual Health SLT portfolio and a small part (Aegon) of the Group Health SLT portfolio is reinsured by a
reinsurance contract. For the a.s.r. part of the portfolio this consists of inactive contracts only, for the Aegon part there is one remaining contract active until 1 January 2026. The reinsuring cash flows concern existing claims and are
calculated separately in the cash flows models. Concentration risk Geographically, the risk exposure of a.s.r. on its health and Non-life portfolio is almost entirely concentrated in the Netherlands.
Concentration of insurance risks is particularly prevalent in the fire risk portfolio (i.e. home and content, with storm and flood risk forming the most important factor). Storm and flood risk is managed by means of suitable reinsurance (see also
‘Reinsurance’). There is also a concentration of risk in group disability schemes. Group disability contracts are underwritten within the scope of disability cover for employees in the Netherlands (WIA). Reinsurance When deemed effective
in terms of capital relief versus costs incurred, a.s.r. enters into reinsurance agreements to mitigate Non-life and Health insurance risks. Reinsurance can be taken out for each separate claim (per risk), for
the accumulation of claims due to natural disasters or to human actions (per event), or for both these risks. The level of retention in the various reinsurance contracts is aligned with the size and the risk profile of the underlying portfolios,
taking into account of the cost of reinsurance on the one hand, and the risk that is retained on the other. To limit risk concentration, reinsurance contracts are placed with various reinsurance companies. a.s.r. requires the counterparties to be
rated at least single A-. The structure of the reinsurance program has remained largely the same as in previous years in terms of cover and limits. In 2025 a.s.r. purchased excess of loss reinsurance for
accident year 2026 for Windstorm. The limit of the reinsurance contract is increased with € 100 million to € 900 million. The Individual Health SLT portfolio and a small part of the Group Health SLT portfolio is
reinsured by a reinsurance contract. The reinsuring cash flows concern existing claims and are calculated separately in the cash flows models. The total share of the reinsurances for a.s.r. amounted to € 119 million per
31 December 2025. In 2025, part of the health portfolio of a.s.r. health basic and a.s.r. health supplementary has been reinsured at a.s.r. non-life via a quota share agreement. The internal reinsurance
aims to better diversify the health risks within the a.s.r. group. The internal reinsurance has no effect on the a.s.r. results and has a limited effect on the required capital of a.s.r. 7.8.3 Market risk Market risk is the risk of potential losses
due to adverse movements in financial market variables. Exposure to market risk is measured by the impact of movements in financial variables such as equity prices, interest rates and property prices. The various types of market risk which are
discussed in this section, are: mismatch risk equity risk (including equity volatility risk) property risk currency risk spread risk concentration risk In December 2025, a.s.r. life received approval to use a PIM for determing the required capital.
This extends the use of the PIM from Aegon life and Aegon spaarkas to the a.s.r. life entity. This change is applied prospectively. The PIM contains separate modules for (i) interest rate risk, (ii) equity risk, (iii) property risk
and (iv) spread risk. For the other risks, the Solvency II standard formula is applied. a.s.r. Financial statements Introduction Consolidated financial statements Accounting policies Group structure and segment information Notes to the
consolidated balance sheet Notes to the consolidated income statement Other notes Risk management Capital management Operating result Company financial statements
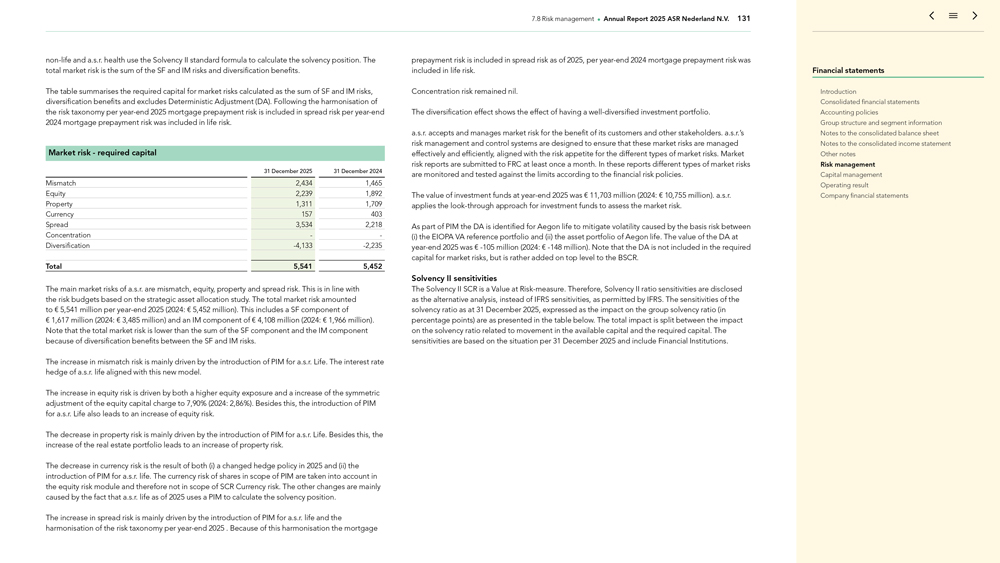
7.8 Risk management Annual Report 2025 ASR Nederland N.V. 131 non-life
and a.s.r. health use the Solvency II standard formula to calculate the solvency position. The total market risk is the sum of the SF and IM risks and diversification benefits. The table summarises the required capital for market risks calculated as
the sum of SF and IM risks, diversification benefits and excludes Deterministic Adjustment (DA). Following the harmonisation of the risk taxonomy per year-end 2025 mortgage prepayment risk is included in
spread risk per year-end 2024 mortgage prepayment risk was included in life risk. Market risk—required capital 31 December 2025 31 December 2024 Mismatch 2,434 1,465 Equity 2,239 1,892 Property
1,311 1,709 Currency 157 403 Spread 3,534 2,218 Concentration —Diversification -4,133 -2,235 Total 5,541 5,452 The main market risks of a.s.r. are mismatch,
equity, property and spread risk. This is in line with the risk budgets based on the strategic asset allocation study. The total market risk amounted to € 5,541 million per year-end 2025 (2024:
€ 5,452 million). This includes a SF component of € 1,617 million (2024: € 3,485 million) and an IM component of € 4,108 million (2024: € 1,966 million). Note that the total market risk is
lower than the sum of the SF component and the IM component because of diversification benefits between the SF and IM risks. The increase in mismatch risk is mainly driven by the introduction of PIM for a.s.r. Life. The interest rate hedge of a.s.r.
life aligned with this new model. The increase in equity risk is driven by both a higher equity exposure and a increase of the symmetric adjustment of the equity capital charge to 7,90% (2024: 2,86%). Besides this, the introduction of PIM for a.s.r.
Life also leads to an increase of equity risk. The decrease in property risk is mainly driven by the introduction of PIM for a.s.r. Life. Besides this, the increase of the real estate portfolio leads to an increase of property risk. The decrease in
currency risk is the result of both (i) a changed hedge policy in 2025 and (ii) the introduction of PIM for a.s.r. life. The currency risk of shares in scope of PIM are taken into account in the equity risk module and therefore not in
scope of SCR Currency risk. The other changes are mainly caused by the fact that a.s.r. life as of 2025 uses a PIM to calculate the solvency position. The increase in spread risk is mainly driven by the introduction of PIM for a.s.r. life and the
harmonisation of the risk taxonomy per year-end 2025 . Because of this harmonisation the mortgage prepayment risk is included in spread risk as of 2025, per year-end
2024 mortgage prepayment risk was included in life risk. Concentration risk remained nil. The diversification effect shows the effect of having a well-diversified investment portfolio. a.s.r. accepts and manages market risk for the benefit of its
customers and other stakeholders. a.s.r.’s risk management and control systems are designed to ensure that these market risks are managed effectively and efficiently, aligned with the risk appetite for the different types of market risks.
Market risk reports are submitted to FRC at least once a month. In these reports different types of market risks are monitored and tested against the limits according to the financial risk policies. The value of investment funds at year-end 2025 was € 11,703 million (2024: € 10,755 million). a.s.r. applies the look-through approach for investment funds to assess the market risk. As part of PIM the DA is identified for
Aegon life to mitigate volatility caused by the basis risk between (i) the EIOPA VA reference portfolio and (ii) the asset portfolio of Aegon life. The value of the DA at year-end 2025 was € -105 million (2024: € -148 million). Note that the DA is not included in the required capital for market risks, but is rather added on top level to
the BSCR. Solvency II sensitivities The Solvency II SCR is a Value at Risk-measure. Therefore, Solvency II ratio sensitivities are disclosed as the alternative analysis, instead of IFRS sensitivities, as permitted by IFRS. The sensitivities of the
solvency ratio as at 31 December 2025, expressed as the impact on the group solvency ratio (in percentage points) are as presented in the table below. The total impact is split between the impact on the solvency ratio related to movement in the
available capital and the required capital. The sensitivities are based on the situation per 31 December 2025 and include Financial Institutions. Financial statements Introduction Consolidated financial statements Accounting policies Group
structure and segment information Notes to the consolidated balance sheet Notes to the consolidated income statement Other notes Risk management Capital management Operating result Company financial statements
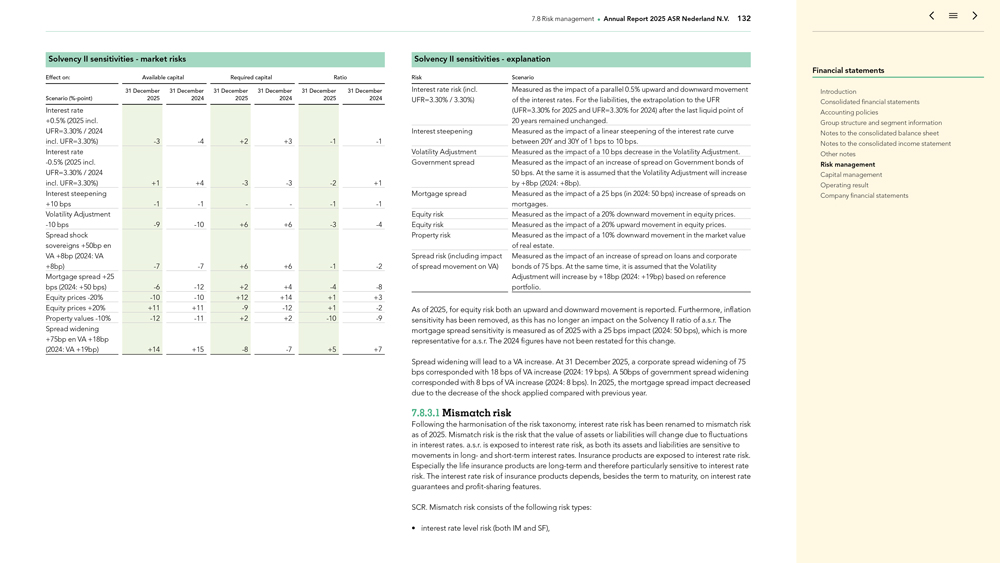
7.8 Risk management Annual Report 2025 ASR Nederland N.V. 132 Solvency II sensitivities—market risks
Effect on: Available capital Required capital Ratio 31 December 31 December 31 December 31 December 31 December 31 December Scenario (%-point) 2025 2024 2025 2024 2025 2024 Interest rate +0.5% (2025 incl. UFR=3.30% /
2024 incl. UFR=3.30%) -3 -4 +2 +3 -1 -1 Interest rate
-0.5% (2025 incl. UFR=3.30% / 2024 incl. UFR=3.30%) +1 +4 -3 -3 -2 +1 Interest steepening
+10 bps -1 -1 — -1 -1 Volatility Adjustment
-10 bps -9 -10 +6 +6 -3 -4 Spread shock
sovereigns +50bp en VA +8bp (2024: VA +8bp) -7 -7 +6 +6 -1 -2 Mortgage spread +25 bps
(2024: +50 bps) -6 -12 +2 +4 -4 -8 Equity prices
-20% -10 -10 +12 +14 +1 +3 Equity prices +20% +11 +11 -9
-12 +1 -2 Property values -10% -12 -11 +2 +2 -10 -9 Spread widening +75bp en VA +18bp (2024: VA +19bp) +14 +15 -8 -7 +5 +7 Solvency II
sensitivities—explanation Risk Scenario Interest rate risk (incl. Measured as the impact of a parallel 0.5% upward and downward movement UFR=3.30% / 3.30%) of the interest rates. For the liabilities, the extrapolation to the UFR (UFR=3.30% for
2025 and UFR=3.30% for 2024) after the last liquid point of 20 years remained unchanged. Interest steepening Measured as the impact of a linear steepening of the interest rate curve between 20Y and 30Y of 1 bps to 10 bps. Volatility Adjustment
Measured as the impact of a 10 bps decrease in the Volatility Adjustment. Government spread Measured as the impact of an increase of spread on Government bonds of 50 bps. At the same it is assumed that the Volatility Adjustment will increase by +8bp
(2024: +8bp). Mortgage spread Measured as the impact of a 25 bps (in 2024: 50 bps) increase of spreads on mortgages. Equity risk Measured as the impact of a 20% downward movement in equity prices. Equity risk Measured as the impact of a 20% upward
movement in equity prices. Property risk Measured as the impact of a 10% downward movement in the market value of real estate. Spread risk (including impact Measured as the impact of an increase of spread on loans and corporate of spread movement on
VA) bonds of 75 bps. At the same time, it is assumed that the Volatility Adjustment will increase by +18bp (2024: +19bp) based on reference portfolio. As of 2025, for equity risk both an upward and downward movement is reported. Furthermore,
inflation sensitivity has been removed, as this has no longer an impact on the Solvency II ratio of a.s.r. The mortgage spread sensitivity is measured as of 2025 with a 25 bps impact (2024: 50 bps), which is more representative for a.s.r. The 2024
figures have not been restated for this change. Spread widening will lead to a VA increase. At 31 December 2025, a corporate spread widening of 75 bps corresponded with 18 bps of VA increase (2024: 19 bps). A 50bps of government spread widening
corresponded with 8 bps of VA increase (2024: 8 bps). In 2025, the mortgage spread impact decreased due to the decrease of the shock applied compared with previous year. 7.8.3.1 Mismatch risk Following the harmonisation of the risk taxonomy,
interest rate risk has been renamed to mismatch risk as of 2025. Mismatch risk is the risk that the value of assets or liabilities will change due to fluctuations in interest rates. a.s.r. is exposed to interest rate risk, as both its assets and
liabilities are sensitive to movements in long- and short-term interest rates. Insurance products are exposed to interest rate risk. Especially the life insurance products are long-term and therefore particularly sensitive to interest rate risk. The
interest rate risk of insurance products depends, besides the term to maturity, on interest rate guarantees and profit-sharing features. SCR. Mismatch risk consists of the following risk types: interest rate level risk (both IM and SF), Financial
statements Introduction Consolidated financial statements Accounting policies Group structure and segment information Notes to the consolidated balance sheet Notes to the consolidated income statement Other notes Risk management Capital management
Operating result Company financial statements
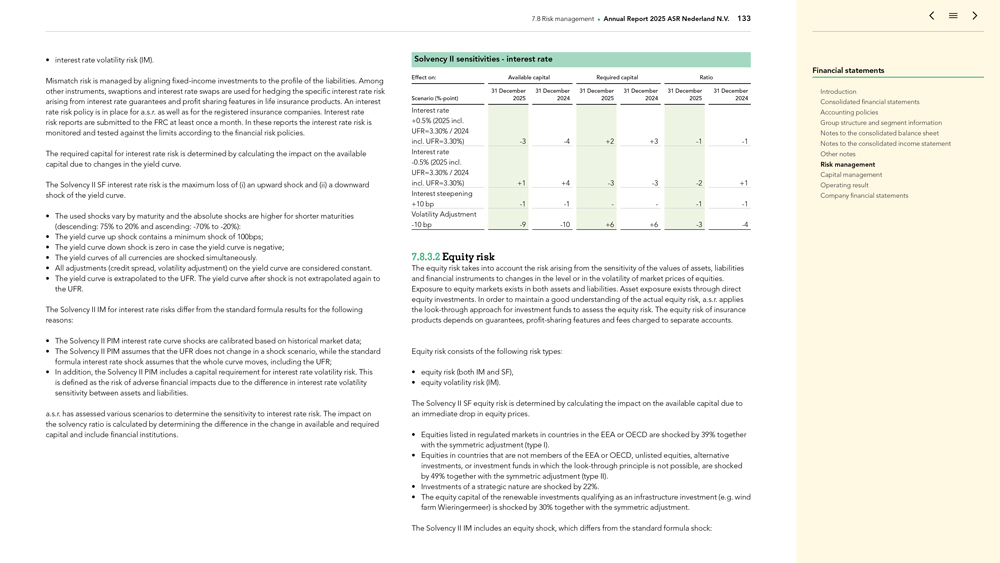
7.8 Risk management Annual Report 2025 ASR Nederland N.V. 133 interest rate volatility risk (IM). Mismatch risk
is managed by aligning fixed-income investments to the profile of the liabilities. Among other instruments, swaptions and interest rate swaps are used for hedging the specific interest rate risk arising from interest rate guarantees and profit
sharing features in life insurance products. An interest rate risk policy is in place for a.s.r. as well as for the registered insurance companies. Interest rate risk reports are submitted to the FRC at least once a month. In these reports the
interest rate risk is monitored and tested against the limits according to the financial risk policies. The required capital for interest rate risk is determined by calculating the impact on the available capital due to changes in the yield curve.
The Solvency II SF interest rate risk is the maximum loss of (i) an upward shock and (ii) a downward shock of the yield curve. The used shocks vary by maturity and the absolute shocks are higher for shorter maturities (descending: 75% to
20% and ascending: -70% to -20%): The yield curve up shock contains a minimum shock of 100bps; The yield curve down shock is zero in case the yield curve is negative;
The yield curves of all currencies are shocked simultaneously. All adjustments (credit spread, volatility adjustment) on the yield curve are considered constant. The yield curve is extrapolated to the UFR. The yield curve after shock is not
extrapolated again to the UFR. The Solvency II IM for interest rate risks differ from the standard formula results for the following reasons: The Solvency II PIM interest rate curve shocks are calibrated based on historical market data; The Solvency
II PIM assumes that the UFR does not change in a shock scenario, while the standard formula interest rate shock assumes that the whole curve moves, including the UFR; In addition, the Solvency II PIM includes a capital requirement for interest rate
volatility risk. This is defined as the risk of adverse financial impacts due to the difference in interest rate volatility sensitivity between assets and liabilities. a.s.r. has assessed various scenarios to determine the sensitivity to interest
rate risk. The impact on the solvency ratio is calculated by determining the difference in the change in available and required capital and include financial institutions. Solvency II sensitivities—interest rate Effect on: Available capital
Required capital Ratio 31 December 31 December 31 December 31 December 31 December 31 December Scenario (%-point) 2025 2024 2025 2024 2025 2024 Interest rate +0.5% (2025 incl. UFR=3.30% / 2024 incl. UFR=3.30%) -3 -4 +2 +3 -1 -1 Interest rate -0.5% (2025 incl.
UFR=3.30% / 2024 incl. UFR=3.30%) +1 +4 -3 -3 -2 +1 Interest steepening +10 bp -1 -1 — -1 -1 Volatility Adjustment -10 bp -9 -10 +6 +6 -3 -4 7.8.3.2 Equity risk The equity risk takes into account the risk arising from the sensitivity of the values of assets,
liabilities and financial instruments to changes in the level or in the volatility of market prices of equities. Exposure to equity markets exists in both assets and liabilities. Asset exposure exists through direct equity investments. In order to
maintain a good understanding of the actual equity risk, a.s.r. applies the look-through approach for investment funds to assess the equity risk. The equity risk of insurance products depends on guarantees, profit-sharing features and fees charged
to separate accounts. Equity risk consists of the following risk types: equity risk (both IM and SF), equity volatility risk (IM). The Solvency II SF equity risk is determined by calculating the impact on the available capital due to an immediate
drop in equity prices. Equities listed in regulated markets in countries in the EEA or OECD are shocked by 39% together with the symmetric adjustment (type I). Equities in countries that are not members of the EEA or OECD, unlisted equities,
alternative investments, or investment funds in which the look-through principle is not possible, are shocked by 49% together with the symmetric adjustment (type II). Investments of a strategic nature are shocked by 22%. The equity capital of the
renewable investments qualifying as an infrastructure investment (e.g. wind farm Wieringermeer) is shocked by 30% together with the symmetric adjustment. The Solvency II IM includes an equity shock, which differs from the standard formula shock:
Financial statements Introduction Consolidated financial statements Accounting policies Group structure and segment information Notes to the consolidated balance sheet Notes to the consolidated income statement Other notes Risk management Capital
management Operating result Company financial statements
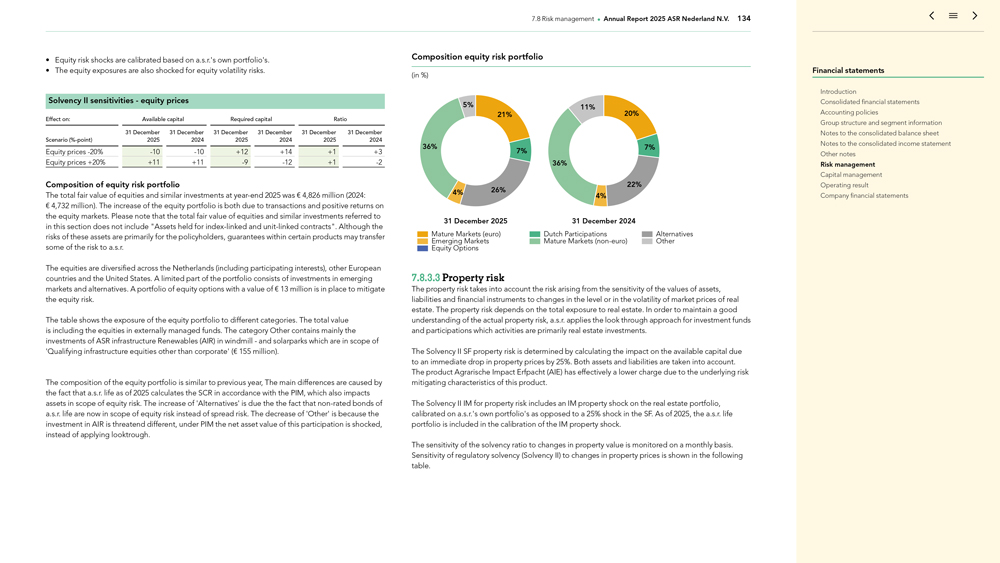
7.8 Risk management Annual Report 2025 ASR Nederland N.V. 134 Equity risk shocks are calibrated based on
a.s.r.’s own portfolio’s. The equity exposures are also shocked for equity volatility risks. Solvency II sensitivities—equity prices Effect on: Available capital Required capital Ratio 31 December 31 December 31
December 31 December 31 December 31 December Scenario (%-point) 2025 2024 2025 2024 2025 2024 Equity prices -20% -10
-10 +12 +14 +1 +3 Equity prices +20% +11 +11 -9 -12 +1 -2 Composition of equity risk
portfolio The total fair value of equities and similar investments at year-end 2025 was € 4,826 million (2024: € 4,732 million). The increase of the equity portfolio is both due to
transactions and positive returns on the equity markets. Please note that the total fair value of equities and similar investments referred to in this section does not include “Assets held for index-linked and unit-linked contracts”.
Although the risks of these assets are primarily for the policyholders, guarantees within certain products may transfer some of the risk to a.s.r. The equities are diversified across the Netherlands (including participating interests), other
European countries and the United States. A limited part of the portfolio consists of investments in emerging markets and alternatives. A portfolio of equity options with a value of € 13 million is in place to mitigate the equity
risk. The table shows the exposure of the equity portfolio to different categories. The total value is including the equities in externally managed funds. The category Other contains mainly the investments of ASR infrastructure Renewables (AIR) in
windmill—and solarparks which are in scope of ‘Qualifying infrastructure equities other than corporate’ (€ 155 million). The composition of the equity portfolio is similar to previous year, The main differences are caused
by the fact that a.s.r. life as of 2025 calculates the SCR in accordance with the PIM, which also impacts assets in scope of equity risk. The increase of ‘Alternatives’ is due the the fact that
non-rated bonds of a.s.r. life are now in scope of equity risk instead of spread risk. The decrease of ‘Other’ is because the investment in AIR is threatend different, under PIM the net asset value
of this participation is shocked, instead of applying looktrough. Composition equity risk portfolio (in %) 5% 11% 21% 20% 36% 7% 7% 36% 22% 4% 26% 4% 31 December 2025 31 December 2024 Mature Markets (euro) Dutch Participations Alternatives
Emerging Markets Mature Markets (non-euro) Other Equity Options 7.8.3.3 Property risk The property risk takes into account the risk arising from the sensitivity of the values of assets, liabilities and
financial instruments to changes in the level or in the volatility of market prices of real estate. The property risk depends on the total exposure to real estate. In order to maintain a good understanding of the actual property risk, a.s.r. applies
the look through approach for investment funds and participations which activities are primarily real estate investments. The Solvency II SF property risk is determined by calculating the impact on the available capital due to an immediate drop in
property prices by 25%. Both assets and liabilities are taken into account. The product Agrarische Impact Erfpacht (AIE) has effectively a lower charge due to the underlying risk mitigating characteristics of this product. The Solvency II IM for
property risk includes an IM property shock on the real estate portfolio, calibrated on a.s.r.’s own portfolio’s as opposed to a 25% shock in the SF. As of 2025, the a.s.r. life portfolio is included in the calibration of the IM property
shock. The sensitivity of the solvency ratio to changes in property value is monitored on a monthly basis. Sensitivity of regulatory solvency (Solvency II) to changes in property prices is shown in the following table. Financial statements
Introduction Consolidated financial statements Accounting policies Group structure and segment information Notes to the consolidated balance sheet Notes to the consolidated income statement Other notes Risk management Capital management Operating
result Company financial statements
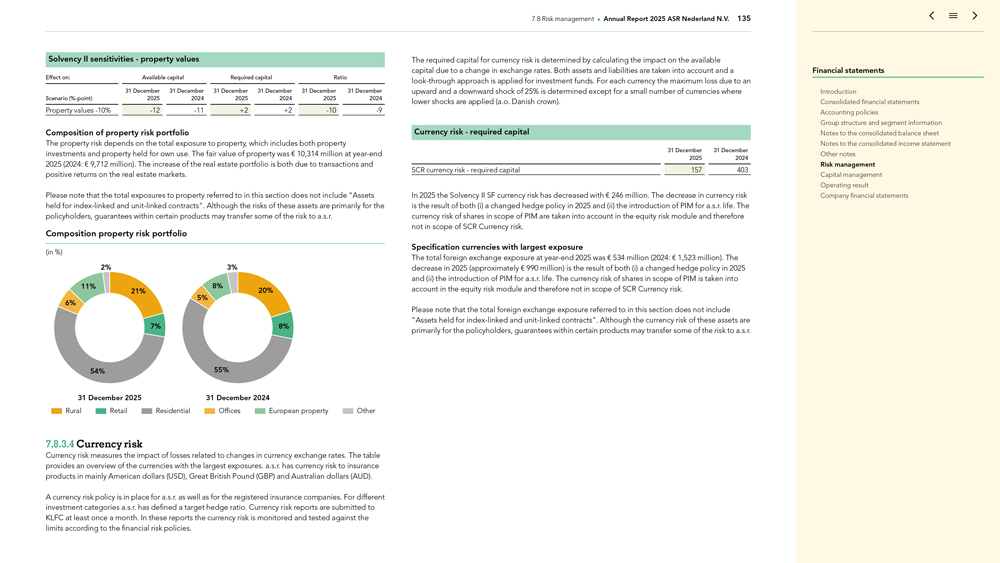
7.8 Risk management Annual Report 2025 ASR Nederland N.V. 135 Solvency II sensitivities—property values
Effect on: Available capital Required capital Ratio 31 December 31 December 31 December 31 December 31 December 31 December Scenario (%-point) 2025 2024 2025 2024 2025 2024 Property values
-10% -12 -11 +2 +2 -10 -9 Composition of property
risk portfolio The property risk depends on the total exposure to property, which includes both property investments and property held for own use. The fair value of property was € 10,314 million at
year-end 2025 (2024: € 9,712 million). The increase of the real estate portfolio is both due to transactions and positive returns on the real estate markets. Please note that the total exposures to
property referred to in this section does not include “Assets held for index-linked and unit-linked contracts”. Although the risks of these assets are primarily for the policyholders, guarantees within certain products may transfer some
of the risk to a.s.r. Composition property risk portfolio (in %) 2% 3% 11% 8% 21% 20% 5% 6% 7% 8% 54% 55% 31 December 2025 31 December 2024 Rural Retail Residential Offices European property Other 7.8.3.4 Currency risk Currency risk
measures the impact of losses related to changes in currency exchange rates. The table provides an overview of the currencies with the largest exposures. a.s.r. has currency risk to insurance products in mainly American dollars (USD), Great British
Pound (GBP) and Australian dollars (AUD). A currency risk policy is in place for a.s.r. as well as for the registered insurance companies. For different investment categories a.s.r. has defined a target hedge ratio. Currency risk reports are
submitted to KLFC at least once a month. In these reports the currency risk is monitored and tested against the limits according to the financial risk policies. The required capital for currency risk is determined by calculating the impact on the
available capital due to a change in exchange rates. Both assets and liabilities are taken into account and a look-through approach is applied for investment funds. For each currency the maximum loss due to an upward and a downward shock of 25% is
determined except for a small number of currencies where lower shocks are applied (a.o. Danish crown). Currency risk—required capital 31 December 31 December 2025 2024 SCR currency risk—required capital 157 403 In 2025 the
Solvency II SF currency risk has decreased with € 246 million. The decrease in currency risk is the result of both (i) a changed hedge policy in 2025 and (ii) the introduction of PIM for a.s.r. life. The currency risk of
shares in scope of PIM are taken into account in the equity risk module and therefore not in scope of SCR Currency risk. Specification currencies with largest exposure The total foreign exchange exposure at
year-end 2025 was € 534 million (2024: € 1,523 million). The decrease in 2025 (approximately € 990 million) is the result of both (i) a changed hedge policy in 2025 and
(ii) the introduction of PIM for a.s.r. life. The currency risk of shares in scope of PIM is taken into account in the equity risk module and therefore not in scope of SCR Currency risk. Please note that the total foreign exchange exposure
referred to in this section does not include “Assets held for index-linked and unit-linked contracts”. Although the currency risk of these assets are primarily for the policyholders, guarantees within certain products may transfer some
of the risk to a.s.r. Financial statements Introduction Consolidated financial statements Accounting policies Group structure and segment information Notes to the consolidated balance sheet Notes to the consolidated income statement Other notes Risk
management Capital management Operating result Company financial statements
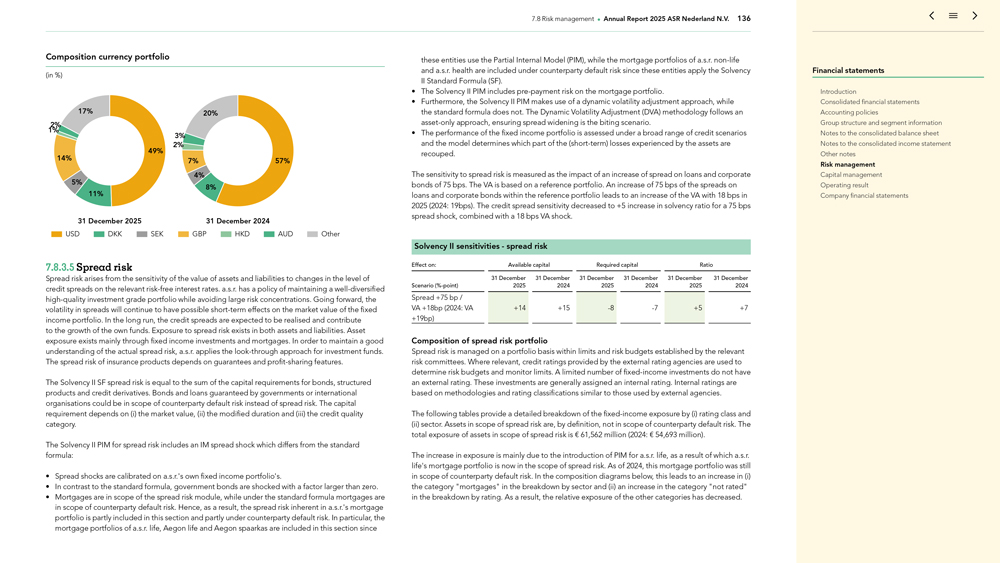
7.8 Risk management Annual Report 2025 ASR Nederland N.V. 136 Composition currency portfolio (in %) 17% 20% 2%
1% 3% 2% 49% 14% 7% 57% 5% 4% 11% 8% 31 December 2025 31 December 2024 USD DKK SEK GBP HKD AUD Other 7.8.3.5 Spread risk Spread risk arises from the sensitivity of the value of assets and liabilities to changes in the level of credit
spreads on the relevant risk-free interest rates. a.s.r. has a policy of maintaining a well-diversified high-quality investment grade portfolio while avoiding large risk concentrations. Going forward, the volatility in spreads will continue to have
possible short-term effects on the market value of the fixed income portfolio. In the long run, the credit spreads are expected to be realised and contribute to the growth of the own funds. Exposure to spread risk exists in both assets and
liabilities. Asset exposure exists mainly through fixed income investments and mortgages. In order to maintain a good understanding of the actual spread risk, a.s.r. applies the look-through approach for investment funds. The spread risk of
insurance products depends on guarantees and profit-sharing features. The Solvency II SF spread risk is equal to the sum of the capital requirements for bonds, structured products and credit derivatives. Bonds and loans guaranteed by governments or
international organisations could be in scope of counterparty default risk instead of spread risk. The capital requirement depends on (i) the market value, (ii) the modified duration and (iii) the credit quality category. The Solvency
II PIM for spread risk includes an IM spread shock which differs from the standard formula: Spread shocks are calibrated on a.s.r.’s own fixed income portfolio’s. In contrast to the standard formula, government bonds are shocked with a
factor larger than zero. Mortgages are in scope of the spread risk module, while under the standard formula mortgages are in scope of counterparty default risk. Hence, as a result, the spread risk inherent in a.s.r.’s mortgage portfolio is
partly included in this section and partly under counterparty default risk. In particular, the mortgage portfolios of a.s.r. life, Aegon life and Aegon spaarkas are included in this section since these entities use the Partial Internal Model (PIM),
while the mortgage portfolios of a.s.r. non-life and a.s.r. health are included under counterparty default risk since these entities apply the Solvency II Standard Formula (SF). The Solvency II PIM includes pre-payment risk on the mortgage portfolio. Furthermore, the Solvency II PIM makes use of a dynamic volatility adjustment approach, while the standard formula does not. The Dynamic Volatility Adjustment (DVA)
methodology follows an asset-only approach, ensuring spread widening is the biting scenario. The performance of the fixed income portfolio is assessed under a broad range of credit scenarios and the model determines which part of the (short-term)
losses experienced by the assets are recouped. The sensitivity to spread risk is measured as the impact of an increase of spread on loans and corporate bonds of 75 bps. The VA is based on a reference portfolio. An increase of 75 bps of the spreads
on loans and corporate bonds within the reference portfolio leads to an increase of the VA with 18 bps in 2025 (2024: 19bps). The credit spread sensitivity decreased to +5 increase in solvency ratio for a 75 bps spread shock, combined with a 18 bps
VA shock. Solvency II sensitivities—spread risk Effect on: Available capital Required capital Ratio 31 December 31 December 31 December 31 December 31 December 31 December Scenario (%-point) 2025 2024 2025 2024
2025 2024 Spread +75 bp / VA +18bp (2024: VA +14 +15 -8 -7 +5 +7 +19bp) Composition of spread risk portfolio Spread risk is managed on a portfolio basis within limits
and risk budgets established by the relevant risk committees. Where relevant, credit ratings provided by the external rating agencies are used to determine risk budgets and monitor limits. A limited number of fixed-income investments do not have an
external rating. These investments are generally assigned an internal rating. Internal ratings are based on methodologies and rating classifications similar to those used by external agencies. The following tables provide a detailed breakdown of the
fixed-income exposure by (i) rating class and (ii) sector. Assets in scope of spread risk are, by definition, not in scope of counterparty default risk. The total exposure of assets in scope of spread risk is
€ 61,562 million (2024: € 54,693 million). The increase in exposure is mainly due to the introduction of PIM for a.s.r. life, as a result of which a.s.r. life’s mortgage portfolio is now in the scope of spread risk. As
of 2024, this mortgage portfolio was still in scope of counterparty default risk. In the composition diagrams below, this leads to an increase in (i) the category “mortgages” in the breakdown by sector and (ii) an increase in
the category “not rated” in the breakdown by rating. As a result, the relative exposure of the other categories has decreased. Financial statements Introduction Consolidated financial statements Accounting policies Group structure and
segment information Notes to the consolidated balance sheet Notes to the consolidated income statement Other notes Risk management Capital management Operating result Company financial statements
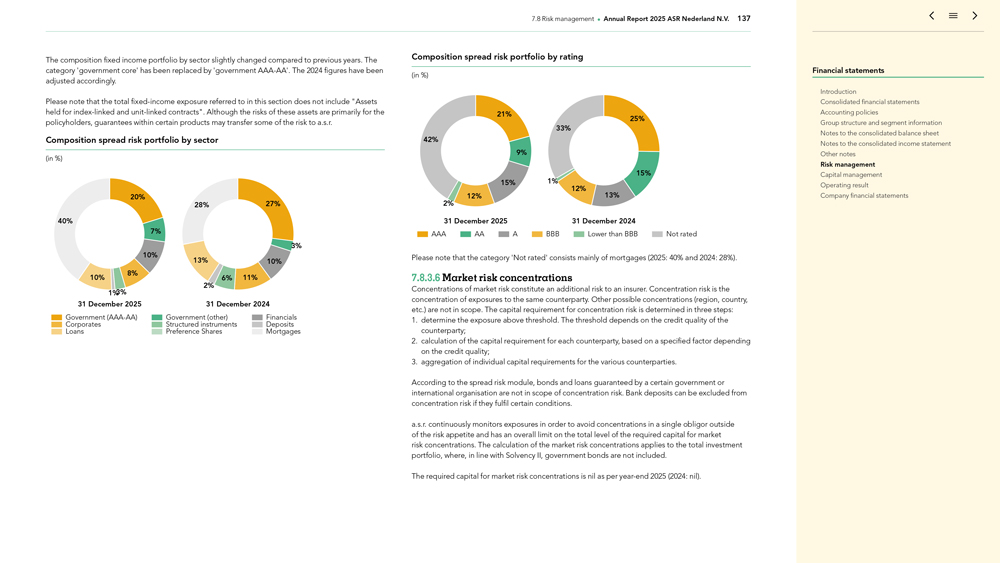
7.8 Risk management Annual Report 2025 ASR Nederland N.V. 137 The composition fixed income portfolio by sector
slightly changed compared to previous years. The category ‘government core’ has been replaced by ‘government AAA-AA’. The 2024 figures have been adjusted accordingly. Please note that
the total fixed-income exposure referred to in this section does not include “Assets held for index-linked and unit-linked contracts”. Although the risks of these assets are primarily for the policyholders, guarantees within certain
products may transfer some of the risk to a.s.r. Composition spread risk portfolio by sector (in %) 20% 27% 28% 40% 7% 3% 10% 13% 10% 8% 10% 6% 11% 3% 2% 1% 31 December 2025 31 December 2024 Government
(AAA-AA) Government (other) Financials Corporates Structured instruments Deposits Loans Preference Shares Mortgages Composition spread risk portfolio by rating (in %) 21% 25% 33% 42% 9% 15% 15% 1% 12% 13% 12%
2% 31 December 2025 31 December 2024 AAA AA A BBB Lower than BBB Not rated Please note that the category ‘Not rated’ consists mainly of mortgages (2025: 40% and 2024: 28%). 7.8.3.6 Market risk concentrations Concentrations of
market risk constitute an additional risk to an insurer. Concentration risk is the concentration of exposures to the same counterparty. Other possible concentrations (region, country, etc.) are not in scope. The capital requirement for concentration
risk is determined in three steps: 1. determine the exposure above threshold. The threshold depends on the credit quality of the counterparty; 2. calculation of the capital requirement for each counterparty, based on a specified factor depending on
the credit quality; 3. aggregation of individual capital requirements for the various counterparties. According to the spread risk module, bonds and loans guaranteed by a certain government or international organisation are not in scope of
concentration risk. Bank deposits can be excluded from concentration risk if they fulfil certain conditions. a.s.r. continuously monitors exposures in order to avoid concentrations in a single obligor outside of the risk appetite and has an overall
limit on the total level of the required capital for market risk concentrations. The calculation of the market risk concentrations applies to the total investment portfolio, where, in line with Solvency II, government bonds are not included. The
required capital for market risk concentrations is nil as per year-end 2025 (2024: nil). Financial statements Introduction Consolidated financial statements Accounting policies Group structure and segment
information Notes to the consolidated balance sheet Notes to the consolidated income statement Other notes Risk management Capital management Operating result Company financial statements
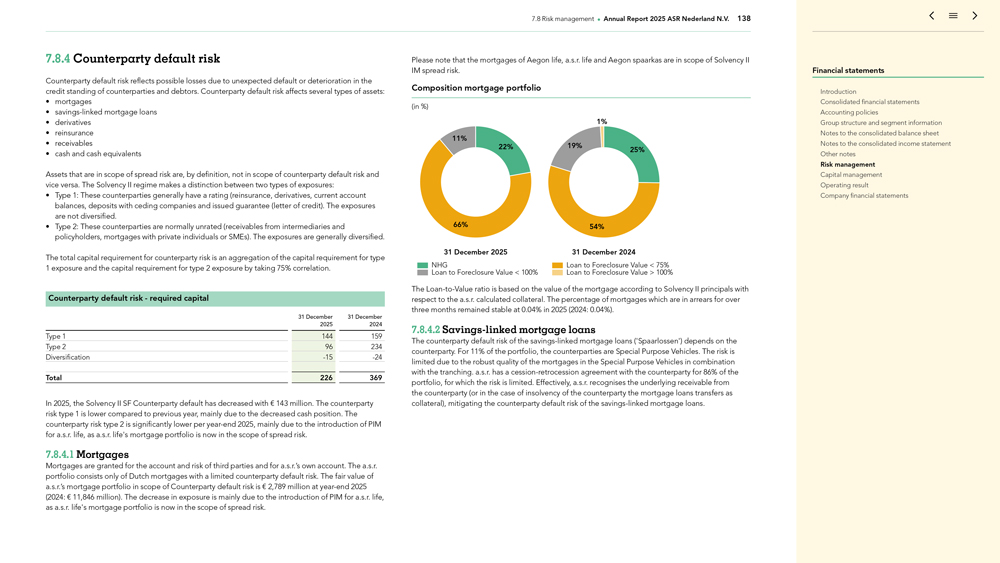
7.8 Risk management Annual Report 2025 ASR Nederland N.V. 138 7.8.4 Counterparty default risk Counterparty
default risk reflects possible losses due to unexpected default or deterioration in the credit standing of counterparties and debtors. Counterparty default risk affects several types of assets: mortgages savings-linked mortgage loans derivatives
reinsurance receivables cash and cash equivalents Assets that are in scope of spread risk are, by definition, not in scope of counterparty default risk and vice versa. The Solvency II regime makes a distinction between two types of exposures: Type
1: These counterparties generally have a rating (reinsurance, derivatives, current account balances, deposits with ceding companies and issued guarantee (letter of credit). The exposures are not diversified. Type 2: These counterparties are normally
unrated (receivables from intermediaries and policyholders, mortgages with private individuals or SMEs). The exposures are generally diversified. The total capital requirement for counterparty risk is an aggregation of the capital requirement for
type 1 exposure and the capital requirement for type 2 exposure by taking 75% correlation. Counterparty default risk—required capital 31 December 31 December 2025 2024 Type 1 144 159 Type 2 96 234 Diversification -15 -24 Total 226 369 In 2025, the Solvency II SF Counterparty default has decreased with € 143 million. The counterparty risk type 1 is lower compared to
previous year, mainly due to the decreased cash position. The counterparty risk type 2 is significantly lower per year-end 2025, mainly due to the introduction of PIM for a.s.r. life, as a.s.r. life’s
mortgage portfolio is now in the scope of spread risk. 7.8.4.1 Mortgages Mortgages are granted for the account and risk of third parties and for a.s.r.’s own account. The a.s.r. portfolio consists only of Dutch mortgages with a limited
counterparty default risk. The fair value of a.s.r.’s mortgage portfolio in scope of Counterparty default risk is € 2,789 million at year-end 2025 (2024: € 11,846 million). The
decrease in exposure is mainly due to the introduction of PIM for a.s.r. life, as a.s.r. life’s mortgage portfolio is now in the scope of spread risk. Please note that the mortgages of Aegon life, a.s.r. life and Aegon spaarkas are in scope of
Solvency II IM spread risk. Composition mortgage portfolio (in %) 1% 11% 22% 19% 25% 66% 54% 31 December 2025 31 December 2024 NHG Loan to Foreclosure Value < 75% Loan to Foreclosure Value < 100% Loan to Foreclosure Value > 100%
The Loan-to-Value ratio is based on the value of the mortgage according to Solvency II principals with respect to the a.s.r. calculated collateral. The percentage of
mortgages which are in arrears for over three months remained stable at 0.04% in 2025 (2024: 0.04%) . 7.8.4.2 Savings-linked mortgage loans The counterparty default risk of the savings-linked mortgage loans (‘Spaarlossen’) depends on the
counterparty. For 11% of the portfolio, the counterparties are Special Purpose Vehicles. The risk is limited due to the robust quality of the mortgages in the Special Purpose Vehicles in combination with the tranching. a.s.r. has a
cession-retrocession agreement with the counterparty for 86% of the portfolio, for which the risk is limited. Effectively, a.s.r. recognises the underlying receivable from the counterparty (or in the case of insolvency of the counterparty the
mortgage loans transfers as collateral), mitigating the counterparty default risk of the savings-linked mortgage loans. Financial statements Introduction Consolidated financial statements Accounting policies Group structure and segment information
Notes to the consolidated balance sheet Notes to the consolidated income statement Other notes Risk management Capital management Operating result Company financial statements
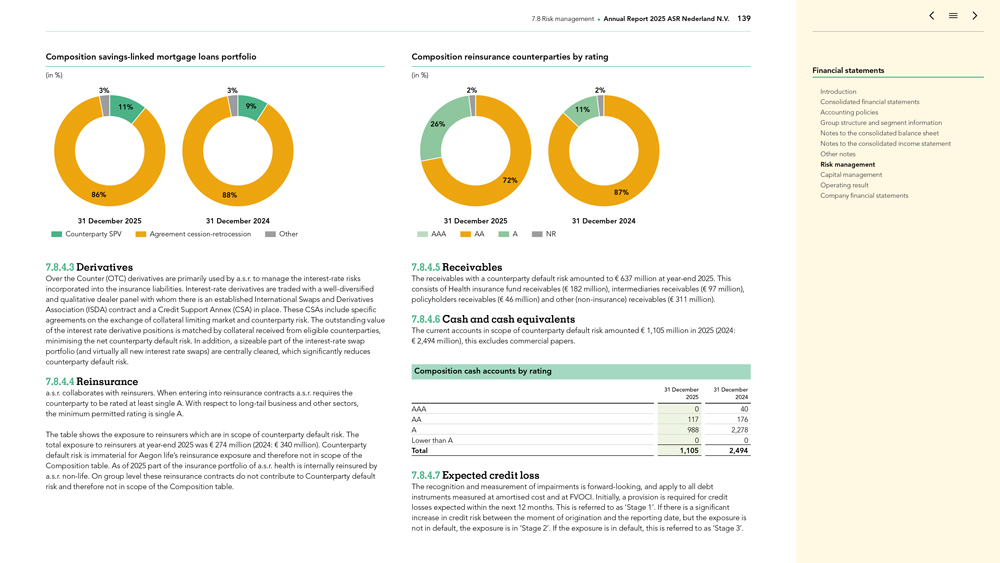
7.8 Risk management Annual Report 2025 ASR Nederland N.V. 139 Composition savings-linked mortgage loans
portfolio (in %) 3% 3% 11% 9% 86% 88% 31 December 2025 31 December 2024 Counterparty SPV Agreement cession-retrocession Other 7.8.4.3 Derivatives Over the Counter (OTC) derivatives are primarily used by a.s.r. to manage the interest-rate
risks incorporated into the insurance liabilities. Interest-rate derivatives are traded with a well-diversified and qualitative dealer panel with whom there is an established International Swaps and Derivatives Association (ISDA) contract and a
Credit Support Annex (CSA) in place. These CSAs include specific agreements on the exchange of collateral limiting market and counterparty risk. The outstanding value of the interest rate derivative positions is matched by collateral received from
eligible counterparties, minimising the net counterparty default risk. In addition, a sizeable part of the interest-rate swap portfolio (and virtually all new interest rate swaps) are centrally cleared, which significantly reduces counterparty
default risk. 7.8.4.4 Reinsurance a.s.r. collaborates with reinsurers. When entering into reinsurance contracts a.s.r. requires the counterparty to be rated at least single A. With respect to long-tail business and other sectors, the minimum
permitted rating is single A. The table shows the exposure to reinsurers which are in scope of counterparty default risk. The total exposure to reinsurers at year-end 2025 was € 274 million
(2024: € 340 million). Counterparty default risk is immaterial for Aegon life’s reinsurance exposure and therefore not in scope of the Composition table. As of 2025 part of the insurance portfolio of a.s.r. health is internally
reinsured by a.s.r. non-life. On group level these reinsurance contracts do not contribute to Counterparty default risk and therefore not in scope of the Composition table. Composition reinsurance
counterparties by rating (in %) 2% 2% 11% 26% 72% 87% 31 December 2025 31 December 2024 AAA AA A NR 7.8.4.5 Receivables The receivables with a counterparty default risk amounted to € 637 million at year-end 2025. This consists of Health insurance fund receivables (€ 182 million), intermediaries receivables (€ 97 million), policyholders receivables (€ 46 million) and other (non-insurance) receivables (€ 311 million). 7.8.4.6 Cash and cash equivalents The current accounts in scope of counterparty default risk amounted € 1,105 million in 2025 (2024:
€ 2,494 million), this excludes commercial papers. Composition cash accounts by rating 31 December 31 December 2025 2024 AAA 0 40 AA 117 176 A 988 2,278 Lower than A 0 0 Total 1,105 2,494 7.8.4.7 Expected credit loss The
recognition and measurement of impairments is forward-looking, and apply to all debt instruments measured at amortised cost and at FVOCI. Initially, a provision is required for credit losses expected within the next 12 months. This is referred to as
‘Stage 1’. If there is a significant increase in credit risk between the moment of origination and the reporting date, but the exposure is not in default, the exposure is in ‘Stage 2’. If the exposure is in default, this is
referred to as ‘Stage 3’. Financial statements Introduction Consolidated financial statements Accounting policies Group structure and segment information Notes to the consolidated balance sheet Notes to the consolidated income statement
Other notes Risk management Capital management Operating result Company financial statements
7.8 Risk management Annual Report 2025 ASR Nederland N.V. 140 For both ‘Stage 2’ and ‘Stage
3’, a provision is required for expected credit losses over the remaining lifetime of the financial asset. Expected credit loss measurement The impairment requirements outline a ‘three-stage’ model for impairment based on changes
in credit quality since initial recognition as summarised below: 1. A financial instrument that is not credit-impaired on initial recognition is classified into ‘Stage 1’ and has its credit risk continuously monitored by a.s.r.: a) If a
significant increase in credit risk (‘SICR’) since initial recognition is identified, the financial instrument is moved to ‘Stage 2’ but is not yet deemed to be credit impaired. b) If the financial instrument is
credit-impaired, the financial instrument is then moved to ‘Stage 3’. 2. Financial instruments in Stage 1 have their ECL measured at a 12-month expected credit losses that result from default
events possible within the next 12 months. 3. Financial instruments in Stages 2 or 3 have their ECL measured based on expected credit losses on a lifetime basis. ECL is measured on either a 12-month basis
(Stage 1) or lifetime basis (Stages 2/3) depending on whether a significant increase in credit risk has occurred since initial recognition or whether an asset is considered to be credit-impaired. Expected credit losses are the discounted product of
the Probability of Default (PD), Exposure at Default (EAD), and Loss Given Default (LGD), defined as follows: PD represents the likelihood of a borrower defaulting on its financial obligation, either over the next 12 months (12-month PD), or over the remaining lifetime (lifetime PD) of the obligation; EAD is based on the amounts a.s.r. expects to be owed at the time of default, over the next 12 months
(12-month EAD) or over the remaining lifetime (lifetime EAD); LGD represents a.s.r.’s expectation of the extent of the loss on a defaulted exposure. LGD varies by type of counterparty, type and seniority
of the claim, and availability of collateral or other credit support. LGD is expressed as a percentage loss per unit of exposure at the time of default (EAD). LGD is calculated on a 12-month or lifetime basis,
where the 12-month LGD is the percentage of loss expected to be made if the default occurs in the next 12 months, and the lifetime LGD is the percentage of loss expected to be made if the default occurs over
the remaining expected lifetime of the loan. A pervasive concept in measuring ECL is that it should consider forward-looking information. a.s.r. has performed historical analyses to identify the key economic variables impacting credit risk and
expected credit losses for each portfolio. Expert judgment was also applied in this process. a.s.r. employs a model to calculate ECL on the asset class mortgage loans at amortised cost. Asset classes not covered by the ECL calculations are
considered either to have immaterial credit risk or to be short-term in nature. Given the nature and credit quality of the mortgage loans measured at amortised cost, with only limited number of mortgages with payment arrears and in general
sufficient collateral, the total loss allowance of mortgages that is recognised per 31 December 2025 is less than € 1 million (31 December 2024: less than € 1 million), with no material transfers between Stage 1,
Stage 2 and Stage 3 for the reported period. The total of undiscounted ECL at initial recognition for purchased or originated credit-impaired financial assets recognised during 2025 amounts to € 0 million (2024: € 0
million), as no credit-impaired financial assets are originated or purchased by a.s.r. The following tables further specify the changes in gross carrying amounts of the mortgage loans measured at amortised cost. The gross carrying amounts in these
tables are the clean values, thus excluding the accrued interest. Changes in gross carrying amounts of mortgage loans measured at amortised cost Stage 1 Stage 2 Stage 3 2025 (12-month ECL) (Lifetime ECL)
(Lifetime ECL) Total At 1 January 2,566 55 4 2,624 Stage transfers -28 28 —Purchases and originations 173 — 173 Repayments -198 -2 -1 -200 Other changes -69 — -69 Gross carrying
amount at 31 December 2,444 81 3 2,529 Stage 1 Stage 2 Stage 3 2024 (12-month ECL) (Lifetime ECL) (Lifetime ECL) Total At 1 January 14,121 414 18 14,552 Stage transfers 34 -34 —Purchases and originations 408 2—410 Repayments -322 -7 -1 -330 Changes in the composition of the group -11,730 -320 -13
-12,063 Other changes 55 — 55 Gross carrying amount at 31 December 2,566 55 4 2,624 Per 31 December 2025, private loans measured at amortised cost are in Stage 1 for an amount of
€ 8 million, and nil in Stage 2 and Stage 3 (31 December 2024: € 9 million in Stage 1, nil in Stage 2 and Stage 3). Financial statements Introduction Consolidated financial statements Accounting policies Group
structure and segment information Notes to the consolidated balance sheet Notes to the consolidated income statement Other notes Risk management Capital management Operating result Company financial statements
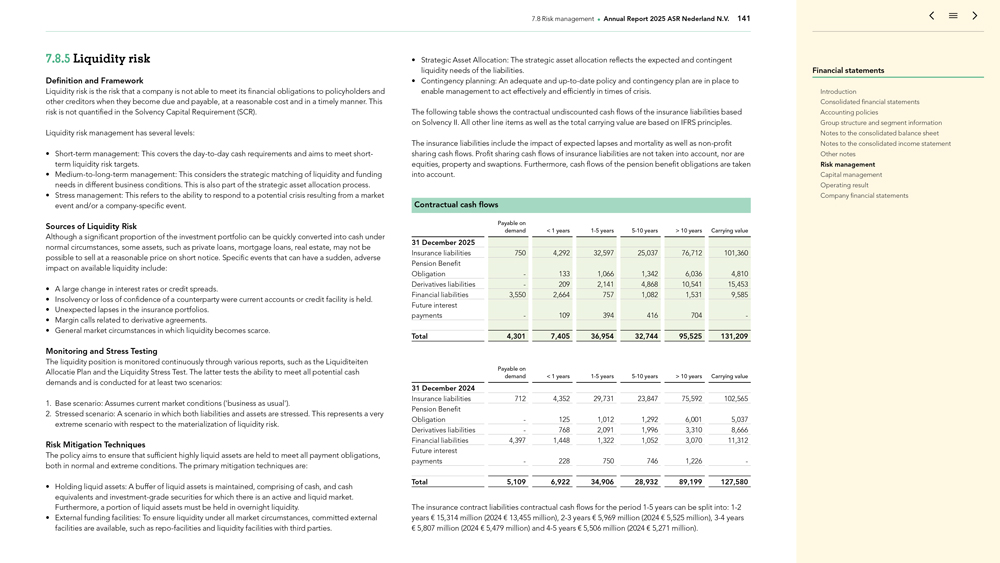
7.8.5 Liquidity risk Definition and Framework Liquidity risk is the risk that a company is not able to meet its
financial obligations to policyholders and other creditors when they become due and payable, at a reasonable cost and in a timely manner. This risk is not quantified in the Solvency Capital Requirement (SCR). Liquidity risk management has several
levels: Short-term management: This covers the day-to-day cash requirements and aims to meet short-term liquidity risk targets. Medium-to-long-term management: This considers the strategic matching of liquidity and funding needs in different business conditions. This is also part of the strategic asset allocation process. Stress
management: This refers to the ability to respond to a potential crisis resulting from a market event and/or a company-specific event. Sources of Liquidity Risk Although a significant proportion of the investment portfolio can be quickly converted
into cash under normal circumstances, some assets, such as private loans, mortgage loans, real estate, may not be possible to sell at a reasonable price on short notice. Specific events that can have a sudden, adverse impact on available liquidity
include: A large change in interest rates or credit spreads. Insolvency or loss of confidence of a counterparty were current accounts or credit facility is held. Unexpected lapses in the insurance portfolios. Margin calls related to derivative
agreements. General market circumstances in which liquidity becomes scarce. Monitoring and Stress Testing The liquidity position is monitored continuously through various reports, such as the Liquiditeiten Allocatie Plan and the Liquidity Stress
Test. The latter tests the ability to meet all potential cash demands and is conducted for at least two scenarios: 1. Base scenario: Assumes current market conditions (‘business as usual’). 2. Stressed scenario: A scenario in which both
liabilities and assets are stressed. This represents a very extreme scenario with respect to the materialization of liquidity risk. Risk Mitigation Techniques The policy aims to ensure that sufficient highly liquid assets are held to meet all
payment obligations, both in normal and extreme conditions. The primary mitigation techniques are: Holding liquid assets: A buffer of liquid assets is maintained, comprising of cash, and cash equivalents and investment-grade securities for which
there is an active and liquid market. Furthermore, a portion of liquid assets must be held in overnight liquidity. External funding facilities: To ensure liquidity under all market circumstances, committed external facilities are available, such as
repo-facilities and liquidity facilities with third parties. Strategic Asset Allocation: The strategic asset allocation reflects the expected and contingent liquidity needs of the liabilities. Contingency planning: An adequate and up-to-date policy and contingency plan are in place to enable management to act effectively and efficiently in times of crisis. The following table shows the contractual
undiscounted cash flows of the insurance liabilities based on Solvency II. All other line items as well as the total carrying value are based on IFRS principles. The insurance liabilities include the impact of expected lapses and mortality as well
as non-profit sharing cash flows. Profit sharing cash flows of insurance liabilities are not taken into account, nor are equities, property and swaptions. Furthermore, cash flows of the pension benefit
obligations are taken into account. Contractual cash flows Payable on demand < 1 years 1-5 years 5-10 years > 10 years Carrying value 31 December 2025
Insurance liabilities 750 4,292 32,597 25,037 76,712 101,360 Pension Benefit Obligation—133 1,066 1,342 6,036 4,810 Derivatives liabilities—209 2,141 4,868 10,541 15,453 Financial liabilities 3,550 2,664 757 1,082 1,531 9,585 Future
interest payments—109 394 416 704— Total 4,301 7,405 36,954 32,744 95,525 131,209 Payable on demand < 1 years 1-5 years 5-10 years > 10 years Carrying
value 31 December 2024 Insurance liabilities 712 4,352 29,731 23,847 75,592 102,565 Pension Benefit Obligation—125 1,012 1,292 6,001 5,037 Derivatives liabilities—768 2,091 1,996 3,310 8,666 Financial liabilities 4,397 1,448 1,322
1,052 3,070 11,312 Future interest payments—228 750 746 1,226— Total 5,109 6,922 34,906 28,932 89,199 127,580 The insurance contract liabilities contractual cash flows for the period 1-5 years can
be split into: 1-2 years € 15,314 million (2024 € 13,455 million), 2-3 years € 5,969 million (2024 € 5,525 million), 3-4 years € 5,807 million (2024 € 5,479 million) and 4-5 years € 5,506 million (2024 € 5,271 million). Financial statements
Introduction Consolidated financial statements Accounting policies Group structure and segment information Notes to the consolidated balance sheet Notes to the consolidated income statement Other notes Risk management Capital management Operating
result Company financial statements
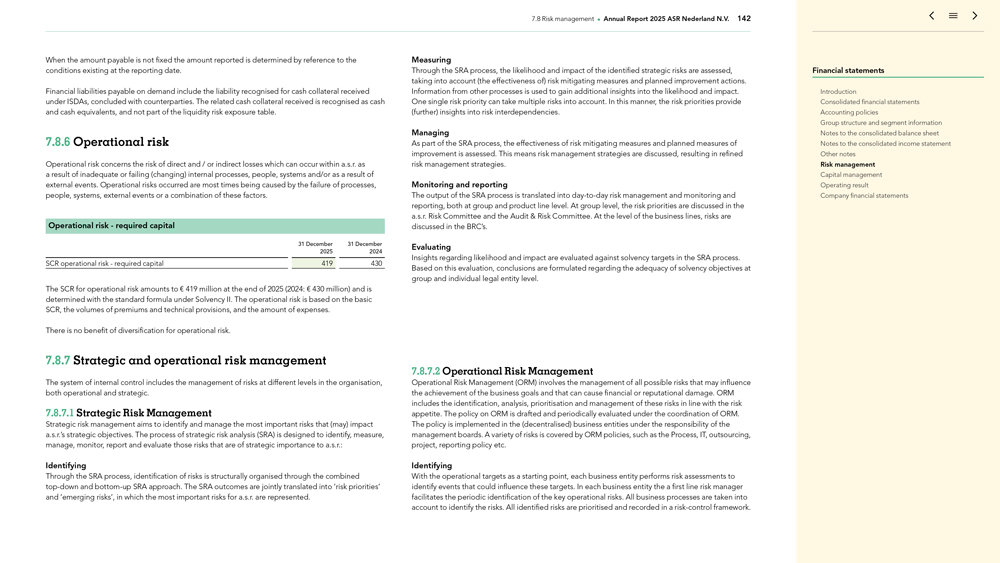
7.8 Risk management Annual Report 2025 ASR Nederland N.V. 142 When the amount payable is not fixed the amount
reported is determined by reference to the conditions existing at the reporting date. Financial liabilities payable on demand include the liability recognised for cash collateral received under ISDAs, concluded with counterparties. The related cash
collateral received is recognised as cash and cash equivalents, and not part of the liquidity risk exposure table. 7.8.6 Operational risk Operational risk concerns the risk of direct and / or indirect losses which can occur within a.s.r. as a result
of inadequate or failing (changing) internal processes, people, systems and/or as a result of external events. Operational risks occurred are most times being caused by the failure of processes, people, systems, external events or a combination of
these factors. Operational risk—required capital 31 December 31 December 2025 2024 SCR operational risk—required capital 419 430 The SCR for operational risk amounts to € 419 million at the end of 2025 (2024:
€ 430 million) and is determined with the standard formula under Solvency II. The operational risk is based on the basic SCR, the volumes of premiums and technical provisions, and the amount of expenses. There is no benefit of
diversification for operational risk. 7.8.7 Strategic and operational risk management The system of internal control includes the management of risks at different levels in the organisation, both operational and strategic. 7.8.7.1 Strategic Risk
Management Strategic risk management aims to identify and manage the most important risks that (may) impact a.s.r.’s strategic objectives. The process of strategic risk analysis (SRA) is designed to identify, measure, manage, monitor, report
and evaluate those risks that are of strategic importance to a.s.r.: Identifying Through the SRA process, identification of risks is structurally organised through the combined top-down and bottom-up SRA approach. The SRA outcomes are jointly translated into ‘risk priorities’ and ‘emerging risks’, in which the most important risks for a.s.r. are represented. Measuring Through
the SRA process, the likelihood and impact of the identified strategic risks are assessed, taking into account (the effectiveness of) risk mitigating measures and planned improvement actions. Information from other processes is used to gain
additional insights into the likelihood and impact. One single risk priority can take multiple risks into account. In this manner, the risk priorities provide (further) insights into risk interdependencies. Managing As part of the SRA process, the
effectiveness of risk mitigating measures and planned measures of improvement is assessed. This means risk management strategies are discussed, resulting in refined risk management strategies. Monitoring and reporting The output of the SRA process
is translated into day-to-day risk management and monitoring and reporting, both at group and product line level. At group level, the risk priorities are discussed in
the a.s.r. Risk Committee and the Audit & Risk Committee. At the level of the business lines, risks are discussed in the BRC’s. Evaluating Insights regarding likelihood and impact are evaluated against solvency targets in the SRA
process. Based on this evaluation, conclusions are formulated regarding the adequacy of solvency objectives at group and individual legal entity level. 7.8.7.2 Operational Risk Management Operational Risk Management (ORM) involves the management of
all possible risks that may influence the achievement of the business goals and that can cause financial or reputational damage. ORM includes the identification, analysis, prioritisation and management of these risks in line with the risk appetite.
The policy on ORM is drafted and periodically evaluated under the coordination of ORM. The policy is implemented in the (decentralised) business entities under the responsibility of the management boards. A variety of risks is covered by ORM
policies, such as the Process, IT, outsourcing, project, reporting policy etc. Identifying With the operational targets as a starting point, each business entity performs risk assessments to identify events that could influence these targets. In
each business entity the a first line risk manager facilitates the periodic identification of the key operational risks. All business processes are taken into account to identify the risks. All identified risks are prioritised and recorded in a
risk-control framework. Financial statements Introduction Consolidated financial statements Accounting policies Group structure and segment information Notes to the consolidated balance sheet Notes to the consolidated income statement Other notes
Risk management Capital management Operating result Company financial statements
7.8 Risk management Annual Report 2025 ASR Nederland N.V. 143 The risk policies prescribe specific risk
analyses to be performed to identify and analyse the risks. For IT systems, Information Security Analyses (DIVA—Dienstverlening en Informatie Veiligheids Analyse) have to be performed and for large outsourcing projects a specific risk analysis
is required. Measuring All risks in the risk-control frameworks are assessed on likelihood and impact. Where applicable, the variables are quantified, but often judgments of subject matter experts are required. Based on the estimation of the
variables, each risk is labelled with a specific level of concern (1 to 4). Gross risks with a level of concern 3 or 4 are considered ‘key’. Managing For each risk, identified controls are implemented into the processes to keep the level
of risk within the agreed risk appetite (level of concern 1 or 2). In general, risks can be accepted, mitigated, avoided or transferred. A large range of options is available to mitigate operational risks, depending on the type. An estimation is
made of the net risk, after implementing the control(s). A more effective and efficient approach to managing risks is required driven by increased complexity of processes, data processing and the need for a timely and accurate view on the risk
profile. a.s.r. is therefore in the process of shifting towards a more automated approach to manage risks, for example automated controls, data analysis and the use of AI for reporting purposes. Monitoring and reporting The effectiveness of ORM is
periodically monitored by the first line risk manager at each business line or legal entity. For each key control in the risk-control framework a testing calendar is established based on auditing standards. Each key control is tested regularly and
the outcomes of the effectiveness of the management of key risks are reported to the (local) management. Outcomes are also reported to the NFRC and a.s.r. risk committee. Evaluating Periodically, yet at least annually, the risk-control frameworks
and ORM policies are evaluated to see if revisions are necessary. The risk management function also challenges the business segments and legal entities regarding their risk-control frameworks. Effectiveness criteria of the RM process As part of the
Statement on RM (VOR), the EB is required to provide annual assurance on the effectiveness of the internal RM and control system with respect to operational, compliance, and reporting risks for the past financial year. The effectiveness criteria
focus on the RM process, which is a key component of a.s.r.’s RM system. The following indicators have been defined: Risk Analysis (ORA): percentage of Operational Risk Assessments completed Risk Analysis (SIRA): percentage of
Strategic/Compliance Risk Assessments completed Testing: percentage of controls found to be ineffective (regardless of materiality) Action Tracking: percentage of overdue actions originating from control testing ORM/Compliance Reporting: percentage
of Level 2 operational and compliance risk categories outside risk appetite Together, the set of effectiveness criteria provides a comprehensive view of the RM process. The effectiveness criteria are applied to assess the level of assurance the
EB can provide regarding the functioning of the RM and control system for operational and compliance risks. Operational incidents Operational incidents are reported to GRM, in accordance with the operational risk policy. Root cause analyses are
performed to evaluate the causes of losses in order to learn from these experiences. An overview of the largest operational incidents and the level of operational losses is reported to the NFRC. Actions are defined and implemented to avoid
repetition of operational incidents. ICT Through IT risk management, a.s.r. devotes attention to the confidentiality, integrity and availability of ICT, including End User Computations. The logical access control for key systems used in the
financial reporting process remains a high priority in order to enhance the integrity of applications and data. The logical access control procedures also prevents fraud by improving segregation of duties and by offsetting current and desired access
levels within the systems and applications. Proper understanding of information, security and cyber risks is essential and the reason for which continuous actions are carried out to create awareness among employees. All of a.s.r.’s security
measures are tested periodically. To increase cyber resilience, a.s.r. is participating in de DNB Threat Intel Based Ethical Red Teaming exercise. Business Continuity Management Operations and the execution of critical processes can be disrupted
significantly by unforeseen circumstances or calamities. Preparation and practice enable a.s.r. to resume its most important business activities with limited interruptions and to react quickly and effectively during such situations. Critical
processes and the people, assets and technology needed to run them are identified during the Business Impact Analysis. The factors and calamities that can threaten the availability these processes are identified in the Threat Analysis. If the impact
of certain events can be unacceptable large, mitigating actions are taken. In response to the large dependence of a.s.r. of automated systems, cyber threats are always addressed during these analyses. a.s.r. defines a crisis as: one or more business
lines are (in danger of being) disrupted due to a calamity or potentially suffering reputational damage beyond the acceptable. In order to manage the crisis, and to be able to react timely, efficiently and effectively, a.s.r. has set up a crisis
organisation. There is a central crisis team led by a member of the board. Additionally each business line has its own team to deal with smaller crises. The measures to ensure continuity of critical processes are tested regularly and all crisis
teams are trained annually to be able to act effectively during such situations. The plans to deal with the various scenarios, including cyber threats, are also practiced periodically. Recovery and Resolution a.s.r. has to comply with Dutch
legislation that addresses the recovery and settlement of insurance companies (‘Wet herstel en afwikkeling van verzekeraars’ in Dutch). The objective of this legislation is that insurance companies are well-prepared to recover from
financial difficulties they may face and that insurance companies can be resolved by the resolution authority (in the case of a.s.r. this is DNB) in an Financial statements Introduction Consolidated financial statements Accounting policies Group
structure and segment information Notes to the consolidated balance sheet Notes to the consolidated income statement Other notes Risk management Capital management Operating result Company financial statements
7.8 Risk management Annual Report 2025 ASR Nederland N.V. 144 orderly manner, when they are not able to recover
and have failed or are likely to fail. To ensure the orderly resolution of critical functions that an insurance company may perform, DNB prepares an ex ante resolution plan in which it identifies, ex ante, such functions and plans the resolution
strategy for such functions. In exceptional cases, DNB may identify material impediments that need to be resolved by the insurance company in order to ensure the resolvability of these functions. The Wet herstel en afwikkeling verzekeraars, which
currently is not based on European legislation, will be amended for the implementation of the European Insurance Recovery and Resolution Directive (IRRD). These changes will take effect as per 30 January 2027. As part of the legislation a.s.r.
is obliged to draw up a Preparatory Crisis Plan (‘Voorbereidend Crisisplan’ in Dutch) every three years, that has been approved by DNB. In 2024, a.s.r.’s Preparatory Crisis Plan is updated and helps to be prepared and supports the
organisation in various scenarios of extreme financial stress. The Preparatory Crisis Plan describes and quantifies the measures that can be applied to handle a crisis situation and to resume business. These measures are tested in the scenario
analysis, in which the effects of each recovery measure on a.s.r.’s financial position (solvency and liquidity) are quantified. The required preparations for implementing the measures, their implementation time and effectiveness, potential
obstacles, impact on clients and operational effects are also assessed. The main purpose of the Preparatory Crisis Plan is to increase the chances of early intervention in the event of a financial crisis situation and to further guarantee that the
interest of clients and other stakeholders are protected. Reasonable assurance and model validation a.s.r. aims to obtain reasonable assurance regarding the adequacy and accuracy of the outcomes of models that are used to provide best estimate
values and solvency capital requirements. To this end, multiple instruments are applied, including model validation. Two times a year a model inventory is performed by the product lines to determine if and when a model (re)validation is required.
Triggers for model (re)validation are diverse, e.g. regulation, conversions, analysis of change. Materiality is determined by means of an assessment of impact and complexity. Impact and complexity is expressed in terms of High (H), Medium (M), or
Low (L). The model inventories are discussed in the Model Committee. In the pursuit of reasonable assurance, model risk is mitigated and unacceptable deviations are avoided, against acceptable costs. Financial statements Introduction Consolidated
financial statements Accounting policies Group structure and segment information Notes to the consolidated balance sheet Notes to the consolidated income statement Other notes Risk management Capital management Operating result Company financial
statements
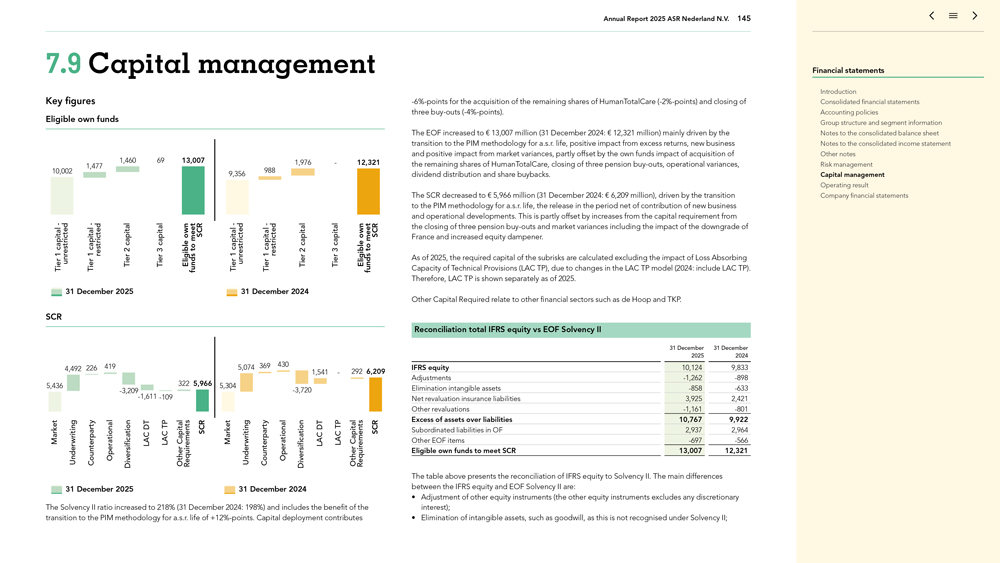
Annual Report 2025 ASR Nederland N.V. 145 7.9 Capital management Key figures Eligible own funds 1,460 69 13,007
1,976—12,321 1,477 10,002 988 9,356 — own SCR — own SCR meet meet capital capital capital capital capital capital 2 3 to capital capital23 to 1 1restricted 1 1restricted Tierunrestricted Tier Tier Tier
EligiblefundsTierunrestrictedTier Tier Tier Eligiblefunds 31 December 2025 31 December 2024 SCR 419 5,074 369 430 4,492 226 1,541—292 6,209 5,436 322 5,966 5,304 -3,720 -3,209-1,611 -109 DT TP DTTP Market LAC Capital SCR Market LAC Capital SCR Underwriting Counterparty Operational Diversification LAC
Other Requirements Underwriting Counterparty Operational Diversification LACOtherRequirements 31 December 2025 31 December 2024 The Solvency II ratio increased to 218% (31 December 2024: 198%) and includes the benefit of the
transition to the PIM methodology for a.s.r. life of +12%-points. Capital deployment contributes -6%-points for the acquisition of the remaining shares of HumanTotalCare
(-2%-points) and closing of three buy-outs (-4%-points). The EOF increased to € 13,007 million (31 December
2024: € 12,321 million) mainly driven by the transition to the PIM methodology for a.s.r. life, positive impact from excess returns, new business and positive impact from market variances, partly offset by the own funds impact of
acquisition of the remaining shares of HumanTotalCare, closing of three pension buy-outs, operational variances, dividend distribution and share buybacks. The SCR decreased to € 5,966 million
(31 December 2024: € 6,209 million), driven by the transition to the PIM methodology for a.s.r. life, the release in the period net of contribution of new business and operational developments. This is partly offset by increases from
the capital requirement from the closing of three pension buy-outs and market variances including the impact of the downgrade of France and increased equity dampener. As of 2025, the required capital of the
subrisks are calculated excluding the impact of Loss Absorbing Capacity of Technical Provisions (LAC TP), due to changes in the LAC TP model (2024: include LAC TP). Therefore, LAC TP is shown separately as of 2025. Other Capital Required relate to
other financial sectors such as de Hoop and TKP. Reconciliation total IFRS equity vs EOF Solvency II 31 December 31 December 2025 2024 IFRS equity 10,124 9,833 Adjustments -1,262 -898 Elimination intangible assets -858 -633 Net revaluation insurance liabilities 3,925 2,421 Other revaluations -1,161 -801 Excess of assets over liabilities 10,767 9,922 Subordinated liabilities in OF 2,937 2,964 Other EOF items -697 -566 Eligible own funds to meet SCR 13,007 12,321 The table above presents the reconciliation of IFRS equity to Solvency II. The main differences between the IFRS equity and EOF Solvency II are: Adjustment of other
equity instruments (the other equity instruments excludes any discretionary interest); Elimination of intangible assets, such as goodwill, as this is not recognised under Solvency II; Financial statements Introduction Consolidated financial
statements Accounting policies Group structure and segment information Notes to the consolidated balance sheet Notes to the consolidated income statement Other notes Risk management Capital management Operating result Company financial statements
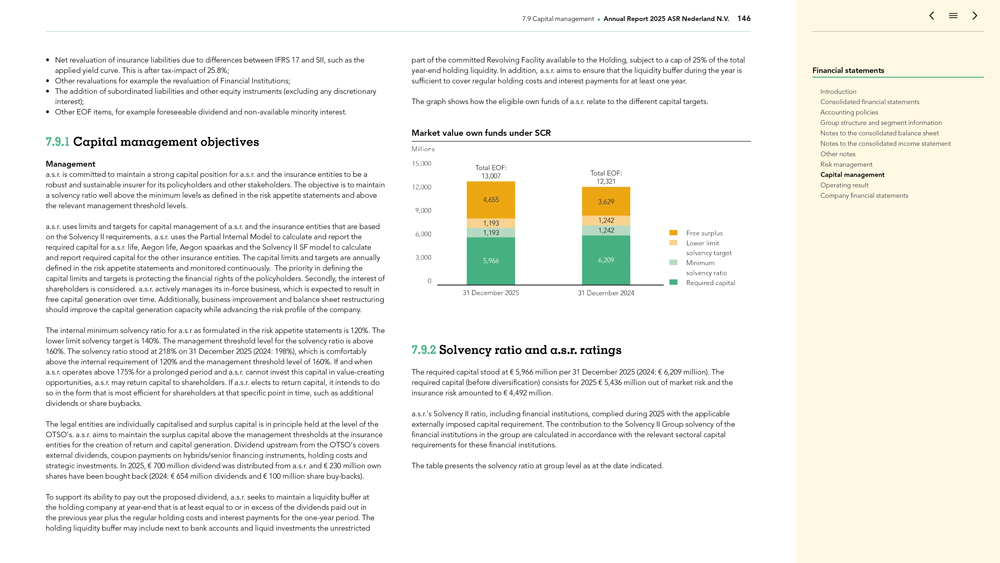
7.9 Capital management Annual Report 2025 ASR Nederland N.V. 146 Net revaluation of insurance liabilities due
to differences between IFRS 17 and SII, such as the applied yield curve. This is after tax-impact of 25.8%; Other revaluations for example the revaluation of Financial Institutions; The addition of
subordinated liabilities and other equity instruments (excluding any discretionary interest); Other EOF items, for example foreseeable dividend and non-available minority interest. 7.9.1 Capital management
objectives Management a.s.r. is committed to maintain a strong capital position for a.s.r. and the insurance entities to be a robust and sustainable insurer for its policyholders and other stakeholders. The objective is to maintain a solvency ratio
well above the minimum levels as defined in the risk appetite statements and above the relevant management threshold levels. a.s.r. uses limits and targets for capital management of a.s.r. and the insurance entities that are based on the Solvency II
requirements. a.s.r. uses the Partial Internal Model to calculate and report the required capital for a.s.r. life, Aegon life, Aegon spaarkas and the Solvency II SF model to calculate and report required capital for the other insurance entities. The
capital limits and targets are annually defined in the risk appetite statements and monitored continuously. The priority in defining the capital limits and targets is protecting the financial rights of the policyholders. Secondly, the interest of
shareholders is considered. a.s.r. actively manages its in-force business, which is expected to result in free capital generation over time. Additionally, business improvement and balance sheet restructuring
should improve the capital generation capacity while advancing the risk profile of the company. The internal minimum solvency ratio for a.s.r as formulated in the risk appetite statements is 120%. The lower limit solvency target is 140%. The
management threshold level for the solvency ratio is above 160%. The solvency ratio stood at 218% on 31 December 2025 (2024: 198%), which is comfortably above the internal requirement of 120% and the management threshold level of 160%. If and
when a.s.r. operates above 175% for a prolonged period and a.s.r. cannot invest this capital in value-creating opportunities, a.s.r. may return capital to shareholders. If a.s.r. elects to return capital, it intends to do so in the form that is most
efficient for shareholders at that specific point in time, such as additional dividends or share buybacks. The legal entities are individually capitalised and surplus capital is in principle held at the level of the OTSO’s. a.s.r. aims to
maintain the surplus capital above the management thresholds at the insurance entities for the creation of return and capital generation. Dividend upstream from the OTSO’s covers external dividends, coupon payments on hybrids/senior financing
instruments, holding costs and strategic investments. In 2025, € 700 million dividend was distributed from a.s.r. and € 230 million own shares have been bought back (2024: € 654 million dividends and
€ 100 million share buy-backs). To support its ability to pay out the proposed dividend, a.s.r. seeks to maintain a liquidity buffer at the holding company at
year-end that is at least equal to or in excess of the dividends paid out in the previous year plus the regular holding costs and interest payments for the one-year
period. The holding liquidity buffer may include next to bank accounts and liquid investments the unrestricted part of the committed Revolving Facility available to the Holding, subject to a cap of 25% of the total
year-end holding liquidity. In addition, a.s.r. aims to ensure that the liquidity buffer during the year is sufficient to cover regular holding costs and interest payments for at least one year. The graph
shows how the eligible own funds of a.s.r. relate to the different capital targets. Market value own funds under SCR 7.9.2 Solvency ratio and a.s.r. ratings The required capital stood at € 5,966 million per 31 December 2025
(2024: € 6,209 million). The required capital (before diversification) consists for 2025 € 5,436 million out of market risk and the insurance risk amounted to € 4,492 million. a.s.r.’s Solvency II ratio,
including financial institutions, complied during 2025 with the applicable externally imposed capital requirement. The contribution to the Solvency II Group solvency of the financial institutions in the group are calculated in accordance with the
relevant sectoral capital requirements for these financial institutions. The table presents the solvency ratio at group level as at the date indicated. Financial statements Introduction Consolidated financial statements Accounting policies Group
structure and segment information Notes to the consolidated balance sheet Notes to the consolidated income statement Other notes Risk management Capital management Operating result Company financial statements
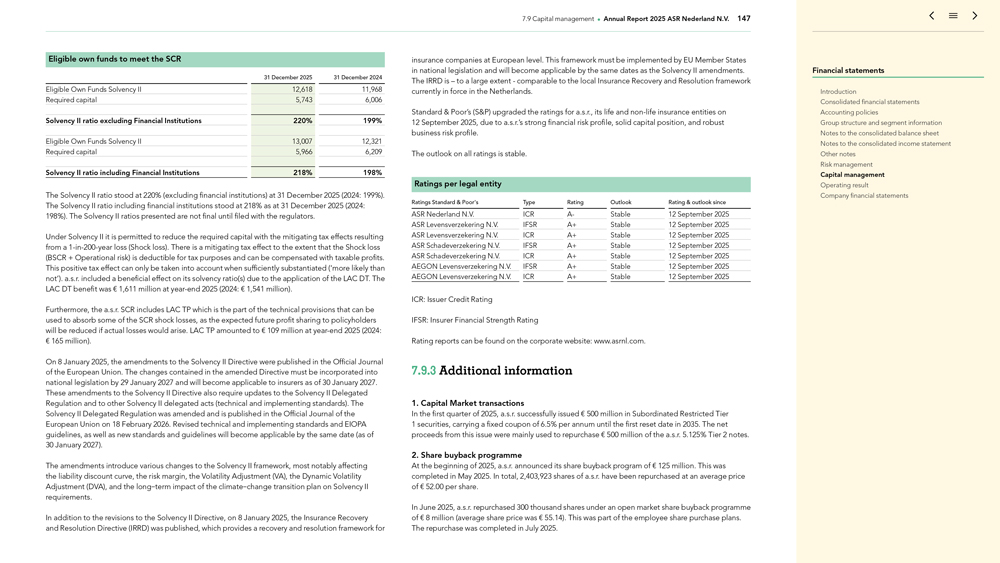
7.9 Capital management Annual Report 2025 ASR Nederland N.V. 147 Eligible own funds to meet the SCR
31 December 2025 31 December 2024 Eligible Own Funds Solvency II 12,618 11,968 Required capital 5,743 6,006 Solvency II ratio excluding Financial Institutions 220% 199% Eligible Own Funds Solvency II 13,007 12,321 Required capital 5,966
6,209 Solvency II ratio including Financial Institutions 218% 198% The Solvency II ratio stood at 220% (excluding financial institutions) at 31 December 2025 (2024: 199%). The Solvency II ratio including financial institutions stood at 218% as
at 31 December 2025 (2024: 198%). The Solvency II ratios presented are not final until filed with the regulators. Under Solvency II it is permitted to reduce the required capital with the mitigating tax effects resulting from a 1-in-200-year loss (Shock loss). There is a mitigating tax effect to the extent that the Shock loss (BSCR + Operational risk) is
deductible for tax purposes and can be compensated with taxable profits. This positive tax effect can only be taken into account when sufficiently substantiated (‘more likely than not’). a.s.r. included a beneficial effect on its
solvency ratio(s) due to the application of the LAC DT. The LAC DT benefit was € 1,611 million at year-end 2025 (2024: € 1,541 million). Furthermore, the a.s.r. SCR includes LAC TP
which is the part of the technical provisions that can be used to absorb some of the SCR shock losses, as the expected future profit sharing to policyholders will be reduced if actual losses would arise. LAC TP amounted to
€ 109 million at year-end 2025 (2024: € 165 million). On 8 January 2025, the amendments to the Solvency II Directive were published in the Official Journal of the European Union.
The changes contained in the amended Directive must be incorporated into national legislation by 29 January 2027 and will become applicable to insurers as of 30 January 2027. These amendments to the Solvency II Directive also require
updates to the Solvency II Delegated Regulation and to other Solvency II delegated acts (technical and implementing standards). The Solvency II Delegated Regulation was amended and is published in the Official Journal of the European Union on
18 February 2026. Revised technical and implementing standards and EIOPA guidelines, as well as new standards and guidelines will become applicable by the same date (as of 30 January 2027). The amendments introduce various changes to the
Solvency II framework, most notably affecting the liability discount curve, the risk margin, the Volatility Adjustment (VA), the Dynamic Volatility Adjustment (DVA), and the long-term impact of the climate-change transition plan on Solvency II
requirements. In addition to the revisions to the Solvency II Directive, on 8 January 2025, the Insurance Recovery and Resolution Directive (IRRD) was published, which provides a recovery and resolution framework for insurance companies at
European level. This framework must be implemented by EU Member States in national legislation and will become applicable by the same dates as the Solvency II amendments. The IRRD is – to a large extent—comparable to the local Insurance
Recovery and Resolution framework currently in force in the Netherlands. Standard & Poor’s (S&P) upgraded the ratings for a.s.r., its life and non-life insurance entities on
12 September 2025, due to a.s.r.’s strong financial risk profile, solid capital position, and robust business risk profile. The outlook on all ratings is stable. Ratings per legal entity Ratings Standard & Poor’s Type
Rating Outlook Rating & outlook since ASR Nederland N.V. ICR A- Stable 12 September 2025 ASR Levensverzekering N.V. IFSR A+ Stable 12 September 2025 ASR Levensverzekering N.V. ICR A+ Stable
12 September 2025 ASR Schadeverzekering N.V. IFSR A+ Stable 12 September 2025 ASR Schadeverzekering N.V. ICR A+ Stable 12 September 2025 AEGON Levensverzekering N.V. IFSR A+ Stable 12 September 2025 AEGON Levensverzekering N.V.
ICR A+ Stable 12 September 2025 ICR: Issuer Credit Rating IFSR: Insurer Financial Strength Rating Rating reports can be found on the corporate website: www.asrnl.com. 7.9.3 Additional information 1. Capital Market transactions In the first
quarter of 2025, a.s.r. successfully issued € 500 million in Subordinated Restricted Tier 1 securities, carrying a fixed coupon of 6.5% per annum until the first reset date in 2035. The net proceeds from this issue were mainly used to
repurchase € 500 million of the a.s.r. 5.125% Tier 2 notes. 2. Share buyback programme At the beginning of 2025, a.s.r. announced its share buyback program of € 125 million. This was completed in May 2025. In total,
2,403,923 shares of a.s.r. have been repurchased at an average price of € 52.00 per share. In June 2025, a.s.r. repurchased 300 thousand shares under an open market share buyback programme of € 8 million (average share
price was € 55.14) . This was part of the employee share purchase plans. The repurchase was completed in July 2025. Financial statements Introduction Consolidated financial statements Accounting policies Group structure and segment
information Notes to the consolidated balance sheet Notes to the consolidated income statement Other notes Risk management Capital management Operating result Company financial statements
7.9 Capital management Annual Report 2025 ASR Nederland N.V. 148 In the third quarter of 2025, a.s.r.
repurchased 1,875,000 shares in the accelerated bookbuild by Aegon Ltd. (Aegon) that took place on 2 September 2025. This represents 15% of the offering. At the offer price of € 56.00 per share the repurchase amounted to a total
amount of € 105 million. a.s.r. intends to propose cancelation of the repurchased shares at the next Annual General Meeting (AGM). 3. Dividend a.s.r. has proposed a total dividend of € 3.41 per share over the full year 2025
(2024: € 3.12 per share). Taking into account the interim dividend of € 1.27 per share, the final dividend amounts to € 2.14 per share. The final dividend amounts to € 438 million based on the number of
shares per 31 December 2025. a.s.r. maintains a progressive dividend policy which increases dividend by mid to high single digit annual growth until (and including) 2026. Financial statements Introduction Consolidated financial statements
Accounting policies Group structure and segment information Notes to the consolidated balance sheet Notes to the consolidated income statement Other notes Risk management Capital management Operating result Company financial statements
Annual Report 2025 ASR Nederland N.V. 149 7.10 Operating result Definition of operating result Operating result
is calculated by using the result before tax from continuing operations reported in accordance with IFRS, adjusted for the following: 1. Adjustments to the insurance service result: The impact of changes to future services on onerous contracts; The
impact of changes of inflation on the liability for incurred claims; The amortisation of pre recognition interest rate hedged developments prior to initial CSM recognition. When a.s.r. explicitly hedges
pre-recognition interest movements to protect the profitability of new business Level of Aggregation (LoA), the valuation of this interest rate hedge as per date of initial recognition CSM will be added to CSM
of this new business LoA. Consequently, the interest hedge will be amortised over the remaining period of the LoA, equal to the period of release of the CSM of the respective LoA. 2. Adjustments to the investment and finance result: investment and
finance result, excluding general investment operating expenses, is replaced by an Operating Investment and Finance Result (which is part of the Operating Result) and is defined as the expected return on the investments in excess of the expected
interest accrual on the insurance liabilities, the directly attributable investment operating expenses, all hybrid expenses (including hybrid expenses through OCI) and the UFR drag for each reporting period. The operating result should reflect the
operational performance of a.s.r. and should exclude revaluation effects on the assets and (insurance related) liabilities as a result of interest and spread movements and/or equity and real estate market movements. If a.s.r. is to value the present
value of future cash flows, it is common market practice to make use of a forward curve (based on the current discount curve) plus a certain premium reflecting the risk of invested assets. This premium is defined as the implied spread at the
beginning of the period over which the result is calculated. The expected return is calculated as: For the fixed income investments: the market value of the fixed income assets at the beginning of the period multiplied by the total of the one-year forward swap rate and the implied spread at the beginning of the period; For equities and real estate investments: the market value of the equity and real estate assets at the beginning of the period
multiplied by a total return assumption; For Insurance related liabilities: the market value of the insurance related liabilities at the beginning of the period multiplied by the one-year forward rate of the
IFRS17 curve (i.e. including the Liability Illiquidity Premium and Credit Risk Adjustment); The other assets / liabilities at the beginning of the period multiplied by the one-year forward curve. The implied
spread per fixed income asset category is defined as the required increase above the swap curve to determine the current market value. The implied spreads are calculated quarterly. a.s.r. has defined five fixed income asset categories that each have
an implied spread. The balance sheet at the beginning of the period is based on a.s.r.’s look-through principle, i.e. all assets in the same asset category have a similar risk-profile (e.g. fixed income funds are classified as fixed income and
not as equities, real estate funds are classified as real estate, etc.). For real estate and equity investments, a.s.r. applies a total return assumption of 5.5% and 6.6% (pre-tax) respectively. This
assumption is evaluated each year. Financial statements Introduction Consolidated financial statements Accounting policies Group structure and segment information Notes to the consolidated balance sheet Notes to the consolidated income statement
Other notes Risk management Capital management Operating result Company financial statements
7.10 Operating result Annual Report 2025 ASR Nederland N.V. 150 3. Other adjustments and incidental items:
Model- and methodological changes of a fundamental nature, in the measurement of the insurance liabilities; Results of non-core operations; Non-recurring or one-off items related to the ongoing business; Non-recurring or one-off items not related to the ongoing business, such as (non-exhaustive) restructuring costs, regulatory costs not related to business activities, changes in own pension arrangements and expenses related to mergers and acquisitions (M&A) activities and start-ups. The treatment of intercompany transactions and eliminations between group companies has been split into continued and discontinued operations. In cases where the a.s.r. group continues to provide services
to a discontinued operation subsequent to the disposal, the elimination of intragroup transactions between the continuing operations and the discontinued operation before the disposal will be treated in a way that reflects the continuance of these
transactions, and as such impacts the operating result. This could have an impact on insurance service result, investment and finance result and other adjustments and incidental items. The RoE, which is based on the operating result, is defined as:
i. The operating result adjusted for the applicable tax divided by ii. The IFRS equity adjusted for the unrealised capital gains reserve that may be reclassified subsequently to profit or loss and equity components of discontinued operations and non-core activities. Financial statements Introduction Consolidated financial statements Accounting policies Group structure and segment information Notes to the consolidated balance sheet Notes to the consolidated
income statement Other notes Risk management Capital management Operating result Company financial statements

7.10 Operating result Annual Report 2025 ASR Nederland N.V. 151 Page intentionally left blank Financial
statements Introduction Consolidated financial statements Accounting policies Group structure and segment information Notes to the consolidated balance sheet Notes to the consolidated income statement Other notes Risk management Capital management
Operating result Company financial statements
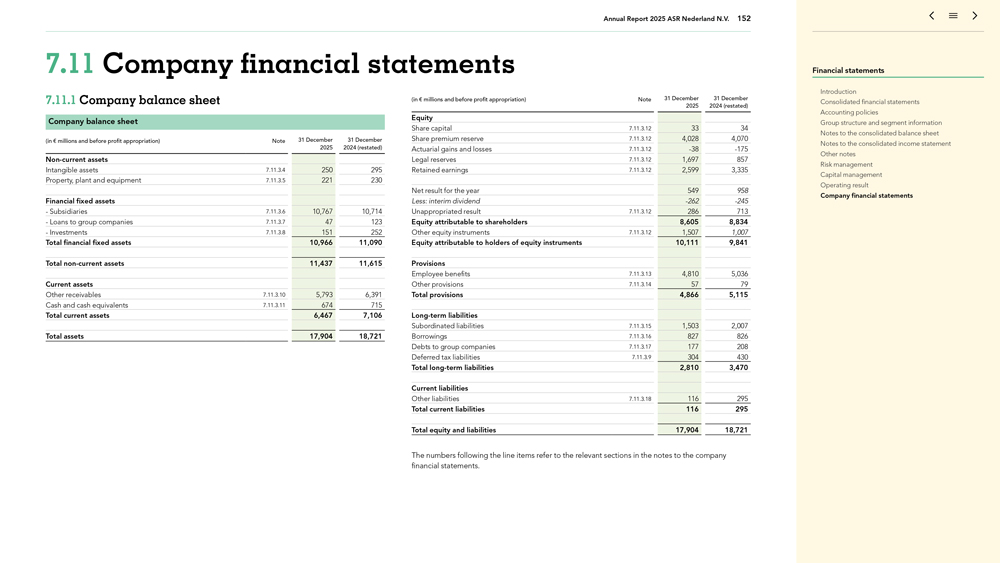
Annual Report 2025 ASR Nederland N.V. 152 7.11 Company financial statements 7.11.1 Company balance sheet
Company balance sheet (in € millions and before profit appropriation) Note 31 December 31 December 2025 2024 (restated) Non-current assets Intangible assets 7.11.3.4 250 295 Property, plant
and equipment 7.11.3.5 221 230 Financial fixed assets —Subsidiaries 7.11.3.6 10,767 10,714—Loans to group companies 7.11.3.7 47 123—Investments 7.11.3.8 151 252 Total financial fixed assets 10,966 11,090 Total non-current assets 11,437 11,615 Current assets Other receivables 7.11.3.10 5,793 6,391 Cash and cash equivalents 7.11.3.11 674 715 Total current assets 6,467 7,106 Total assets 17,904 18,721 (in
€ millions and before profit appropriation) Note 31 December 31 December 2025 2024 (restated) Equity Share capital 7.11.3.12 33 34 Share premium reserve 7.11.3.12 4,028 4,070 Actuarial gains and losses 7.11.3.12 -38 -175 Legal reserves 7.11.3.12 1,697 857 Retained earnings 7.11.3.12 2,599 3,335 Net result for the year 549 958 Less: interim dividend
-262 -245 Unappropriated result 7.11.3.12 286 713 Equity attributable to shareholders 8,605 8,834 Other equity instruments 7.11.3.12 1,507 1,007 Equity attributable to
holders of equity instruments 10,111 9,841 Provisions Employee benefits 7.11.3.13 4,810 5,036 Other provisions 7.11.3.14 57 79 Total provisions 4,866 5,115 Long-term liabilities Subordinated liabilities 7.11.3.15 1,503 2,007 Borrowings 7.11.3.16 827
826 Debts to group companies 7.11.3.17 177 208 Deferred tax liabilities 7.11.3.9 304 430 Total long-term liabilities 2,810 3,470 Current liabilities Other liabilities 7.11.3.18 116 295 Total current liabilities 116 295 Total equity and liabilities
17,904 18,721 The numbers following the line items refer to the relevant sections in the notes to the company financial statements. Financial statements Introduction Consolidated financial statements Accounting policies Group structure and segment
information Notes to the consolidated balance sheet Notes to the consolidated income statement Other notes Risk management Capital management Operating result Company financial statements
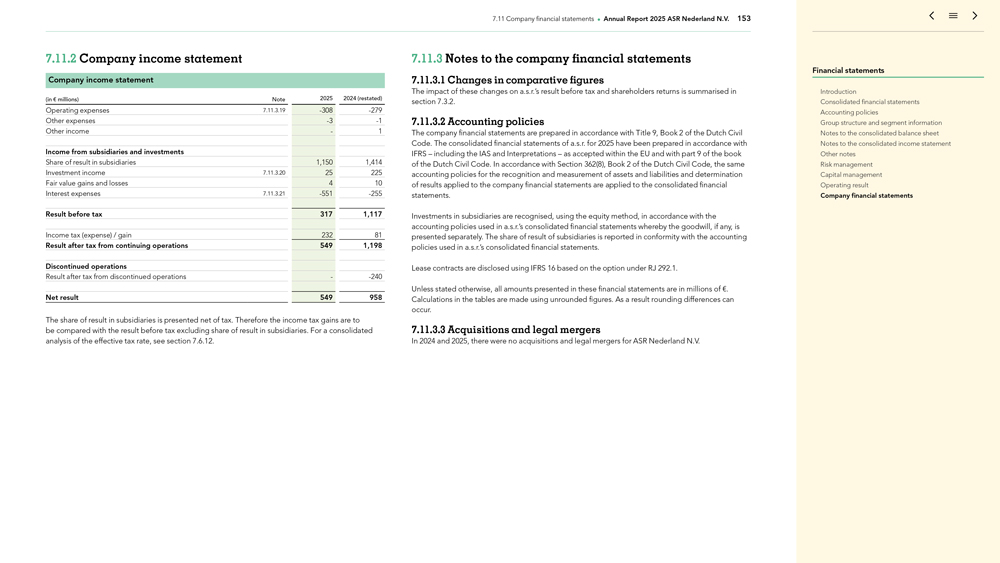
7.11 Company financial statements Annual Report 2025 ASR Nederland N.V. 153 7.11.2 Company income statement
Company income statement (in € millions) Note 2025 2024 (restated) Operating expenses 7.11.3.19 -308 -279 Other expenses
-3 -1 Other income—1 Income from subsidiaries and investments Share of result in subsidiaries 1,150 1,414 Investment income 7.11.3.20 25 225 Fair value gains and
losses 4 10 Interest expenses 7.11.3.21 -551 -255 Result before tax 317 1,117 Income tax (expense) / gain 232 81 Result after tax from continuing operations 549 1,198
Discontinued operations Result after tax from discontinued operations—-240 Net result 549 958 The share of result in subsidiaries is presented net of tax. Therefore the income tax gains are to be
compared with the result before tax excluding share of result in subsidiaries. For a consolidated analysis of the effective tax rate, see section 7.6.12. 7.11.3 Notes to the company financial statements 7.11.3.1 Changes in comparative figures The
impact of these changes on a.s.r.’s result before tax and shareholders returns is summarised in section 7.3.2. 7.11.3.2 Accounting policies The company financial statements are prepared in accordance with Title 9, Book 2 of the Dutch Civil
Code. The consolidated financial statements of a.s.r. for 2025 have been prepared in accordance with IFRS – including the IAS and Interpretations – as accepted within the EU and with part 9 of the book of the Dutch Civil Code. In
accordance with Section 362(8), Book 2 of the Dutch Civil Code, the same accounting policies for the recognition and measurement of assets and liabilities and determination of results applied to the company financial statements are applied to
the consolidated financial statements. Investments in subsidiaries are recognised, using the equity method, in accordance with the accounting policies used in a.s.r.’s consolidated financial statements whereby the goodwill, if any, is
presented separately. The share of result of subsidiaries is reported in conformity with the accounting policies used in a.s.r.’s consolidated financial statements. Lease contracts are disclosed using IFRS 16 based on the option under RJ
292.1. Unless stated otherwise, all amounts presented in these financial statements are in millions of €. Calculations in the tables are made using unrounded figures. As a result rounding differences can occur. 7.11.3.3 Acquisitions and legal
mergers In 2024 and 2025, there were no acquisitions and legal mergers for ASR Nederland N.V. Financial statements Introduction Consolidated financial statements Accounting policies Group structure and segment information Notes to the consolidated
balance sheet Notes to the consolidated income statement Other notes Risk management Capital management Operating result Company financial statements
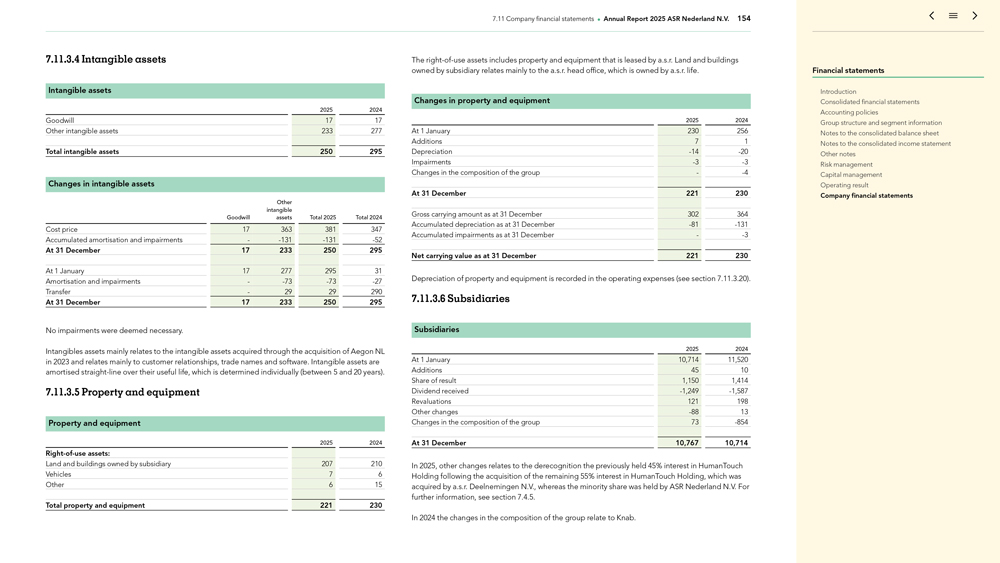
7.11 Company financial statements Annual Report 2025 ASR Nederland N.V. 154 7.11.3.4 Intangible assets
Intangible assets 2025 2024 Goodwill 17 17 Other intangible assets 233 277 Total intangible assets 250 295 Changes in intangible assets Other intangible Goodwill assets Total 2025 Total 2024 Cost price 17 363 381 347 Accumulated amortisation and impairments—-131 -131 -52 At 31 December 17 233 250 295 At 1 January 17 277 295 31 Amortisation and impairments—-73 -73 -27 Transfer—29 29 290 At 31 December 17 233 250 295 No impairments were deemed necessary.
Intangibles assets mainly relates to the intangible assets acquired through the acquisition of Aegon NL in 2023 and relates mainly to customer relationships, trade names and software. Intangible assets are amortised straight-line over their useful
life, which is determined individually (between 5 and 20 years). 7.11.3.5 Property and equipment Property and equipment 2025 2024 Right-of-use assets: Land and buildings
owned by subsidiary 207 210 Vehicles 7 6 Other 6 15 Total property and equipment 221 230 The right-of-use assets includes property and equipment that is leased by a.s.r.
Land and buildings owned by subsidiary relates mainly to the a.s.r. head office, which is owned by a.s.r. life. Changes in property and equipment 2025 2024 At 1 January 230 256 Additions 7 1 Depreciation
-14 -20 Impairments -3 -3 Changes in the composition of the group—-4 At 31 December 221 230 Gross carrying amount as at 31 December 302 364 Accumulated depreciation as at 31 December -81 -131 Accumulated impairments as at 31 December—-3 Net carrying value as at 31 December 221 230 Depreciation of property and equipment is recorded in the operating
expenses (see section 7.11.3.20) . 7.11.3.6 Subsidiaries Subsidiaries 2025 2024 At 1 January 10,714 11,520 Additions 45 10 Share of result 1,150 1,414 Dividend received -1,249 -1,587 Revaluations 121 198 Other changes -88 13 Changes in the composition of the group 73 -854 At 31 December 10,767 10,714 In
2025, other changes relates to the derecognition the previously held 45% interest in HumanTouch Holding following the acquisition of the remaining 55% interest in HumanTouch Holding, which was acquired by a.s.r. Deelnemingen N.V., whereas the
minority share was held by ASR Nederland N.V. For further information, see section 7.4.5. In 2024 the changes in the composition of the group relate to Knab. Financial statements Introduction Consolidated financial statements Accounting policies
Group structure and segment information Notes to the consolidated balance sheet Notes to the consolidated income statement Other notes Risk management Capital management Operating result Company financial statements
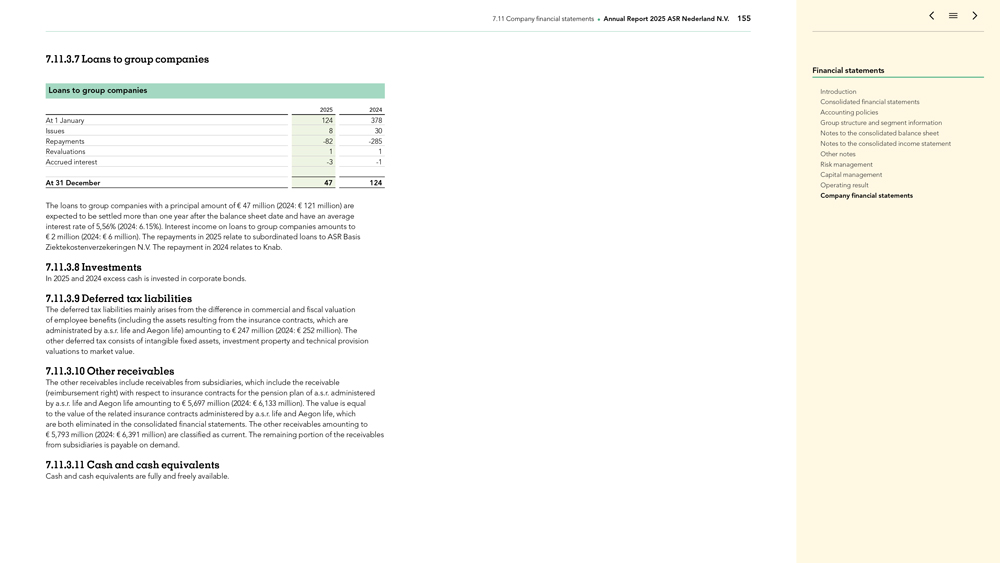
7.11 Company financial statements Annual Report 2025 ASR Nederland N.V. 155 7.11.3.7 Loans to group companies
Loans to group companies 2025 2024 At 1 January 124 378 Issues 8 30 Repayments -82 -285 Revaluations 1 1 Accrued interest -3
-1 At 31 December 47 124 The loans to group companies with a principal amount of € 47 million (2024: € 121 million) are expected to be settled more than one year after the balance
sheet date and have an average interest rate of 5,56% (2024: 6.15%) . Interest income on loans to group companies amounts to € 2 million (2024: € 6 million). The repayments in 2025 relate to subordinated loans to ASR Basis
Ziektekostenverzekeringen N.V. The repayment in 2024 relates to Knab. 7.11.3.8 Investments In 2025 and 2024 excess cash is invested in corporate bonds. 7.11.3.9 Deferred tax liabilities The deferred tax liabilities mainly arises from the difference
in commercial and fiscal valuation of employee benefits (including the assets resulting from the insurance contracts, which are administrated by a.s.r. life and Aegon life) amounting to € 247 million (2024: € 252 million).
The other deferred tax consists of intangible fixed assets, investment property and technical provision valuations to market value. 7.11.3.10 Other receivables The other receivables include receivables from subsidiaries, which include the receivable
(reimbursement right) with respect to insurance contracts for the pension plan of a.s.r. administered by a.s.r. life and Aegon life amounting to € 5,697 million (2024: € 6,133 million). The value is equal to the value of the
related insurance contracts administered by a.s.r. life and Aegon life, which are both eliminated in the consolidated financial statements. The other receivables amounting to € 5,793 million (2024: € 6,391 million) are
classified as current. The remaining portion of the receivables from subsidiaries is payable on demand. 7.11.3.11 Cash and cash equivalents Cash and cash equivalents are fully and freely available. Financial statements Introduction Consolidated
financial statements Accounting policies Group structure and segment information Notes to the consolidated balance sheet Notes to the consolidated income statement Other notes Risk management Capital management Operating result Company financial
statements
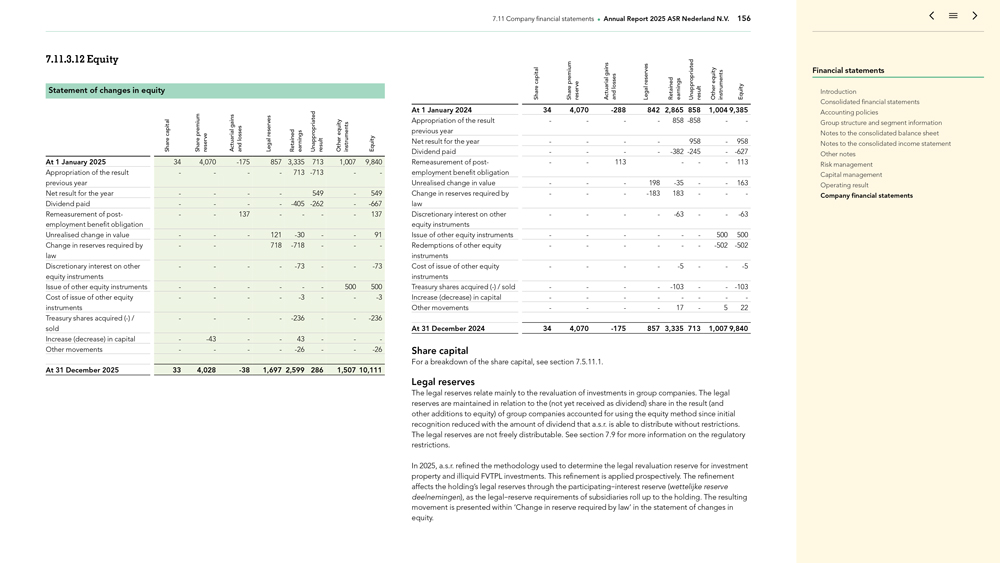
7.11 Company financial statements Annual Report 2025 ASR Nederland N.V. 156 7.11.3.12 Equity Statement of
changes in equity premium gains reserves capitalActuarial Retained equity instruments losses Share Share reserve and Legal earnings Unappropriated result Other Equity At 1 January 2025 34 4,070 -175 857
3,335 713 1,007 9,840 Appropriation of the result — — 713 -713 —previous year Net result for the year — — 549—549 Dividend paid — — -405 -262—-667 Remeasurement of post——137 — — 137 employment benefit obligation Unrealised change in
value ——121 -30 — 91 Change in reserves required by — 718 -718 — -law Discretionary interest on
other — — -73 — -73 equity instruments Issue of other equity instruments — — — 500 500 Cost of issue of other equity — — -3 — -3 instruments Treasury shares acquired (-) / — — -236 — -236 sold
Increase (decrease) in capital—-43 — 43 — -Other movements — — -26 — -26 At 31 December
2025 33 4,028 -38 1,697 2,599 286 1,507 10,111 capital premium gains reserves equity losses Share Share reserve Actuarial and Legal Retained earnings Unappropriated result Other instruments Equity At
1 January 2024 34 4,070 -288 842 2,865 858 1,0049,385 Appropriation of the result — — 858 -858 —previous year Net result for the year —
— 958—958 Dividend paid — — -382 -245—-627 Remeasurement of post——113 ——113
employment benefit obligation Unrealised change in value ——198 -35 — 163 Change in reserves required by ——-183 183 — -law Discretionary interest on other — — -63 — -63 equity instruments Issue of other equity instruments —
— — 500 500 Redemptions of other equity — — — -502 -502 instruments Cost of issue of other equity — — -5 — -5 instruments Treasury shares acquired (-) / sold — — -103 — -103
Increase (decrease) in capital — — — —Other movements — — 17—5 22 At 31 December 2024 34 4,070 -175 857 3,335 713 1,0079,840 Share capital For a breakdown of the
share capital, see section 7.5.11.1. Legal reserves The legal reserves relate mainly to the revaluation of investments in group companies. The legal reserves are maintained in relation to the (not yet received as dividend) share in the result (and
other additions to equity) of group companies accounted for using the equity method since initial recognition reduced with the amount of dividend that a.s.r. is able to distribute without restrictions. The legal reserves are not freely
distributable. See section 7.9 for more information on the regulatory restrictions. In 2025, a.s.r. refined the methodology used to determine the legal revaluation reserve for investment property and illiquid FVTPL investments. This refinement is
applied prospectively. The refinement affects the holding’s legal reserves through the participating-interest reserve (wettelijke reserve deelnemingen), as the legal-reserve requirements of subsidiaries roll up to the holding. The resulting
movement is presented within ‘Change in reserve required by law’ in the statement of changes in equity. Financial statements Introduction Consolidated financial statements Accounting policies Group structure and segment information Notes
to the consolidated balance sheet Notes to the consolidated income statement Other notes Risk management Capital management Operating result Company financial statements
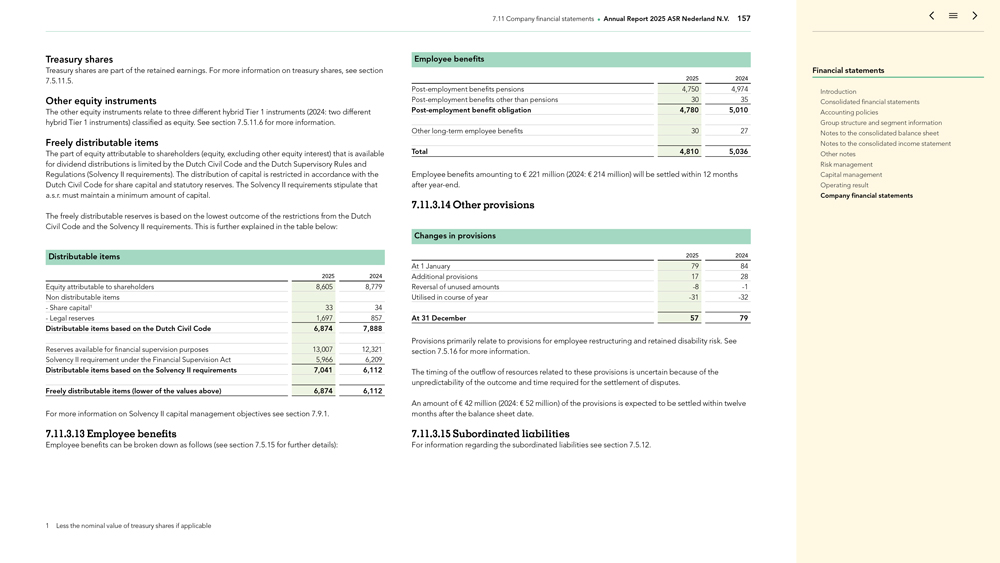
7.11 Company financial statements Annual Report 2025 ASR Nederland N.V. 157 Treasury shares Treasury shares are
part of the retained earnings. For more information on treasury shares, see section 7.5.11.5. Other equity instruments The other equity instruments relate to three different hybrid Tier 1 instruments (2024: two different hybrid Tier 1 instruments)
classified as equity. See section 7.5.11.6 for more information. Freely distributable items The part of equity attributable to shareholders (equity, excluding other equity interest) that is available for dividend distributions is limited by the
Dutch Civil Code and the Dutch Supervisory Rules and Regulations (Solvency II requirements). The distribution of capital is restricted in accordance with the Dutch Civil Code for share capital and statutory reserves. The Solvency II requirements
stipulate that a.s.r. must maintain a minimum amount of capital. The freely distributable reserves is based on the lowest outcome of the restrictions from the Dutch Civil Code and the Solvency II requirements. This is further explained in the table
below: Distributable items 2025 2024 Equity attributable to shareholders 8,605 8,779 Non distributable items—Share capital1 33 34—Legal reserves 1,697 857 Distributable items based on the Dutch Civil Code 6,874 7,888 Reserves available
for financial supervision purposes 13,007 12,321 Solvency II requirement under the Financial Supervision Act 5,966 6,209 Distributable items based on the Solvency II requirements 7,041 6,112 Freely distributable items (lower of the values above)
6,874 6,112 For more information on Solvency II capital management objectives see section 7.9.1. 7.11.3.13 Employee benefits Employee benefits can be broken down as follows (see section 7.5.15 for further details): 1 Less the nominal value of
treasury shares if applicable Employee benefits 2025 2024 Post-employment benefits pensions 4,750 4,974 Post-employment benefits other than pensions 30 35 Post-employment benefit obligation 4,780 5,010 Other long-term employee benefits 30 27 Total
4,810 5,036 Employee benefits amounting to € 221 million (2024: € 214 million) will be settled within 12 months after year-end. 7.11.3.14 Other provisions Changes in provisions 2025
2024 At 1 January 79 84 Additional provisions 17 28 Reversal of unused amounts -8 -1 Utilised in course of year -31 -32 At 31 December 57 79 Provisions primarily relate to provisions for employee restructuring and retained disability risk. See section 7.5.16 for more information. The timing of the outflow of resources
related to these provisions is uncertain because of the unpredictability of the outcome and time required for the settlement of disputes. An amount of € 42 million (2024: € 52 million) of the provisions is expected to be
settled within twelve months after the balance sheet date. 7.11.3.15 Subordinated liabilities For information regarding the subordinated liabilities see section 7.5.12. Financial statements Introduction Consolidated financial statements Accounting
policies Group structure and segment information Notes to the consolidated balance sheet Notes to the consolidated income statement Other notes Risk management Capital management Operating result Company financial statements
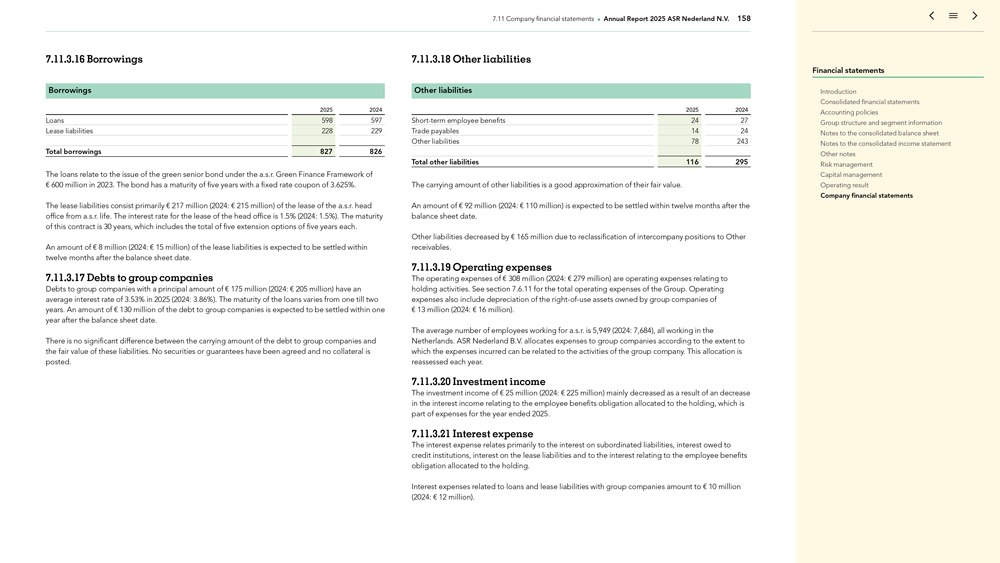
7.11 Company financial statements Annual Report 2025 ASR Nederland N.V. 158 7.11.3.16 Borrowings Borrowings
2025 2024 Loans 598 597 Lease liabilities 228 229 Total borrowings 827 826 The loans relate to the issue of the green senior bond under the a.s.r. Green Finance Framework of € 600 million in 2023. The bond has a maturity of five years
with a fixed rate coupon of 3.625% . The lease liabilities consist primarily € 217 million (2024: € 215 million) of the lease of the a.s.r. head office from a.s.r. life. The interest rate for the lease of the head office is
1.5% (2024: 1.5%) . The maturity of this contract is 30 years, which includes the total of five extension options of five years each. An amount of € 8 million (2024: € 15 million) of the lease liabilities is expected to be
settled within twelve months after the balance sheet date. 7.11.3.17 Debts to group companies Debts to group companies with a principal amount of € 175 million (2024: € 205 million) have an average interest rate of 3.53% in
2025 (2024: 3.86%) . The maturity of the loans varies from one till two years. An amount of € 130 million of the debt to group companies is expected to be settled within one year after the balance sheet date. There is no significant
difference between the carrying amount of the debt to group companies and the fair value of these liabilities. No securities or guarantees have been agreed and no collateral is posted. 7.11.3.18 Other liabilities Other liabilities 2025 2024
Short-term employee benefits 24 27 Trade payables 14 24 Other liabilities 78 243 Total other liabilities 116 295 The carrying amount of other liabilities is a good approximation of their fair value. An amount of € 92 million (2024:
€ 110 million) is expected to be settled within twelve months after the balance sheet date. Other liabilities decreased by € 165 million due to reclassification of intercompany positions to Other receivables. 7.11.3.19
Operating expenses The operating expenses of € 308 million (2024: € 279 million) are operating expenses relating to holding activities. See section 7.6.11 for the total operating expenses of the Group. Operating expenses
also include depreciation of the right-of-use assets owned by group companies of € 13 million (2024: € 16 million). The average number of
employees working for a.s.r. is 5,949 (2024: 7,684), all working in the Netherlands. ASR Nederland B.V. allocates expenses to group companies according to the extent to which the expenses incurred can be related to the activities of the group
company. This allocation is reassessed each year. 7.11.3.20 Investment income The investment income of € 25 million (2024: € 225 million) mainly decreased as a result of an decrease in the interest income relating to the
employee benefits obligation allocated to the holding, which is part of expenses for the year ended 2025. 7.11.3.21 Interest expense The interest expense relates primarily to the interest on subordinated liabilities, interest owed to credit
institutions, interest on the lease liabilities and to the interest relating to the employee benefits obligation allocated to the holding. Interest expenses related to loans and lease liabilities with group companies amount to
€ 10 million (2024: € 12 million). Financial statements Introduction Consolidated financial statements Accounting policies Group structure and segment information Notes to the consolidated balance sheet Notes to the
consolidated income statement Other notes Risk management Capital management Operating result Company financial statements
7.11 Company financial statements Annual Report 2025 ASR Nederland N.V. 159 7.11.3.22 Related party
transactions A related party is a person or entity that has significant influence over another entity, or has the ability to affect the financial and operating policies of the other party. Parties related to the company a.s.r. include subsidiaries,
members of the EB and MB, members of the SB, close family members of any person referred to above, entities controlled or significantly influenced by any person referred to above and any other affiliated entity. a.s.r. enters into transactions with
related parties during the conduct of its business. These transactions mainly involve loans, debts, deposits and commissions, and are conducted on terms equivalent to those that prevail in arm’s length transactions. Related party transactions
in relation to members of the EB, MB and SB are mentioned in section 7.7.4 of the consolidated financial statements. In this chapter are also the related party transactions in relation to Aegon Ltd. and its group companies (since Aegon Ltd. has
significant influence over a.s.r.) mentioned. The remuneration of the EB and SB members of a.s.r. is disclosed in section 7.7.5 of the consolidated financial statements. The loans (including interest income) and debts to group companies are
described in 7.11.3.7 respectively 7.11.3.17 of the company financial statements. The post-employment benefit plan of a.s.r. is administered by a.s.r. life and Aegon life. For information regarding to this plan reference is made to section 7.11.3.10
of this company financial statements. 7.11.3.23 Contingent liabilities Joint and several liability ASR Nederland N.V. forms a fiscal unity for corporate income tax and VAT with nearly all of its subsidiaries. The company and its subsidiaries that
form part of the fiscal unity are jointly and separately liable for taxation payable by the fiscal entity. A statement of joint and several liability under section 403, Book 2 of the Dutch Civil Code has been issued by a.s.r. for the companies
identified in section 7.7.9. Financial statements Introduction Consolidated financial statements Accounting policies Group structure and segment information Notes to the consolidated balance sheet Notes to the consolidated income statement Other
notes Risk management Capital management Operating result Company financial statements
7.11 Company financial statements Annual Report 2025 ASR Nederland N.V. 160 Utrecht, 24 March 2026
Executive Board Jos Baeten Ewout Hollegien Ingrid de Swart Supervisory Board Joop Wijn Bob Elfring Sonja Barendregt Gisella Eikelenboom Gerard van Olphen Daniëlle Jansen Heijtmajer Lard Friese Financial statements Introduction Consolidated
financial statements Accounting policies Group structure and segment information Notes to the consolidated balance sheet Notes to the consolidated income statement Other notes Risk management Capital management Operating result Company financial
statements
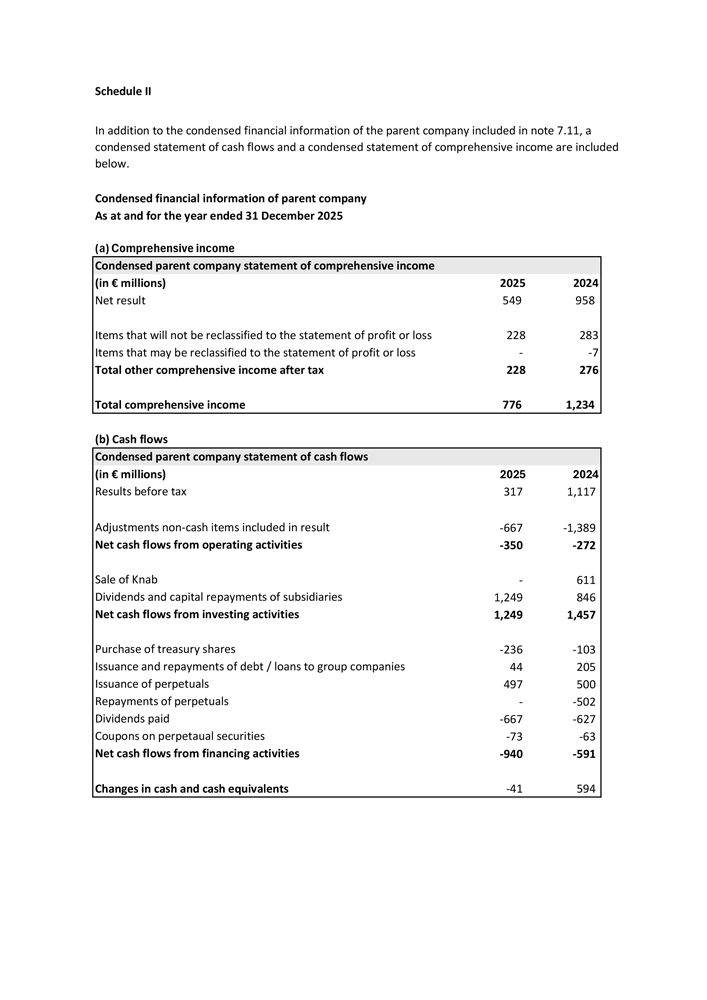
Schedule II In addition to the condensed financial information of the parent company included in note 7.11, a
condensed statement of cash flows and a condensed statement of comprehensive income are included below. Condensed financial information of parent company As at and for the year ended 31 December 2025 (a) Comprehensive income Condensed parent
company statement of comprehensive income (in € millions) 2025 2024 Net result 549 958 Items that will not be reclassified to the statement of profit or loss 228 283 Items that may be reclassified to the statement of profit or loss—-7 Total other comprehensive income after tax 228 276 Total comprehensive income 776 1,234 (b) Cash flows Condensed parent company statement of cash flows (in € millions) 2025 2024 Results
before tax 317 1,117 Adjustments non-cash items included in result -667 -1,389 Net cash flows from operating activities -350 -272 Sale of Knab—611 Dividends and capital repayments of subsidiaries 1,249 846 Net cash flows from investing activities 1,249 1,457 Purchase of treasury shares -236 -103 Issuance and repayments of debt / loans to group companies 44 205 Issuance of perpetuals 497 500 Repayments of
perpetuals—-502 Dividends paid -667 -627 Coupons on perpetaual securities -73 -63 Net cash flows from financing activities -940 -591 Changes in cash and cash equivalents -41
594
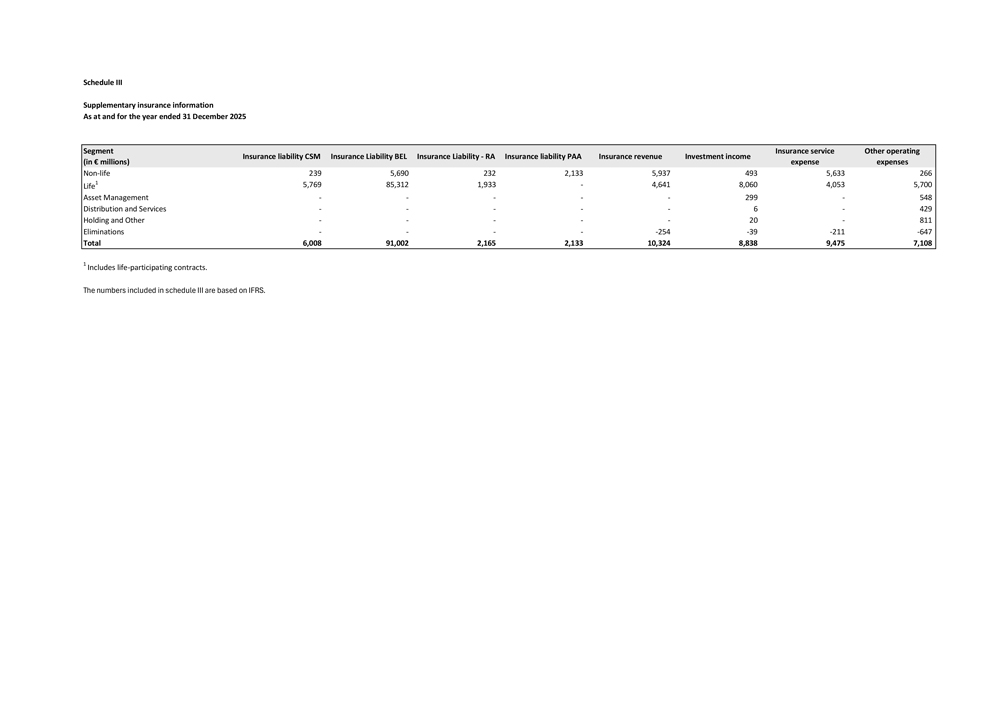
Schedule III Supplementary insurance information As at and for the year ended 31 December 2025 Segment
Insurance service Other operating Insurance liability CSM Insurance Liability BEL Insurance Liability—RA Insurance liability PAA Insurance revenue Investment income (in € millions) expense expenses
Non-life 239 5,690 232 2,133 5,937 493 5,633 266 Life1 5,769 85,312 1,933—4,641 8,060 4,053 5,700 Asset Management — ——299—548 Distribution and Services —
——6—429 Holding and Other — ——20—811 Eliminations — — -254 -39 -211 -647 Total 6,008 91,002 2,165 2,133 10,324 8,838 9,475 7,108 1 Includes life-participating contracts. The numbers included in schedule III are based on IFRS.
Independent Auditors’ Report To the Supervisory Board of ASR Nederland N.V. Opinion We have audited the
consolidated financial statements of ASR Nederland N.V. (and its subsidiaries) (the Company), which comprise the consolidated balance sheets as of 31 December 2025 and 2024, and the related consolidated income statements, consolidated
statements of comprehensive income, consolidated statements of changes in equity, and consolidated statements of cash flows for the years then ended, the related notes to the consolidated financial statements, and the financial statement schedules
(collectively, the consolidated financial statements). In our opinion, the accompanying consolidated financial statements present fairly, in all material respects, the financial position of the Company as of 31 December 2025 and 2024, and its
financial performance and its cash flows for the years then ended in accordance with International Financial Reporting Standards (IFRS) Accounting Standards as endorsed by the European Union (EU-IFRS). Basis
for Opinion We conducted our audit in accordance with auditing standards generally accepted in the United States of America (GAAS). Our responsibilities under those standards are further described in the Auditors’ Responsibilities for the
Audit of the Consolidated Financial Statements section of our report. We are required to be independent of the Company and to meet our other ethical responsibilities, in accordance with the relevant ethical requirements relating to our audit. We
believe that the audit evidence we have obtained is sufficient and appropriate to provide a basis for our audit opinion. Emphasis of Matter As discussed in note 7.1.2, the consolidated financial statements have been prepared in accordance with EU-IFRS, which differs from International Financial Reporting Standards (IFRS) Accounting Standards as issued by the International Accounting Standards Board (IASB). Our opinion is not modified with respect to this
matter. Responsibilities of the Executive Board and Those Charged With Governance for the Consolidated Financial Statements The Executive Board is responsible for the preparation and fair presentation of the consolidated financial statements in
accordance with EU-IFRS, and for the design, implementation, and maintenance of internal control relevant to the preparation and fair presentation of consolidated financial statements that are free from
material misstatement, whether due to fraud or error. In preparing the consolidated financial statements, the Executive Board is required to evaluate whether there are conditions or events, considered in the aggregate, that raise significant doubt
about the Company’s ability to continue as a going concern for one year after the date that the consolidated financial statements are authorised for issuance. Those charged with governance are responsible for overseeing the Company’s
financial reporting process. Auditors’ Responsibilities for the Audit of the Consolidated Financial Statements Our objectives are to obtain reasonable assurance about whether the consolidated financial statements as a whole are free from
material misstatement, whether due to fraud or error, and to issue an auditors’ report that includes our opinion. Reasonable assurance is a high level of assurance but is not absolute assurance and therefore is not a guarantee that an audit
conducted in accordance with GAAS will always detect a
material misstatement when it exists. The risk of not detecting a material misstatement resulting from fraud is
higher than for one resulting from error, as fraud may involve collusion, forgery, intentional omissions, misrepresentations, or the override of internal control. Misstatements are considered material if there is a substantial likelihood that,
individually or in the aggregate, they would influence the judgment made by a reasonable user based on the consolidated financial statements. In performing an audit in accordance with GAAS, we: Exercise professional judgment and maintain
professional skepticism throughout the audit. Identify and assess the risks of material misstatement of the consolidated financial statements, whether due to fraud or error, and design and perform audit procedures responsive to those risks. Such
procedures include examining, on a test basis, evidence regarding the amounts and disclosures in the consolidated financial statements. Obtain an understanding of internal control relevant to the audit in order to design audit procedures that are
appropriate in the circumstances, but not for the purpose of expressing an opinion on the effectiveness of the Company’s internal control. Accordingly, no such opinion is expressed. Evaluate the appropriateness of accounting policies used and
the reasonableness of significant accounting estimates made by the Executive Board, as well as evaluate the overall presentation of the consolidated financial statements. Conclude whether, in our judgment, there are conditions or events, considered
in the aggregate, that raise significant doubt about the Company’s ability to continue as a going concern for a reasonable period of time. We are required to communicate with those charged with governance regarding, among other matters, the
planned scope and timing of the audit, significant audit findings, and certain internal control related matters that we identified during the audit. /s/ KPMG Accountants N.V. Utrecht, The Netherlands 24 March 2026