v3.26.1
Pay vs Performance Disclosure - USD ($)
12 Months Ended
Dec. 31, 2025
Dec. 31, 2024
Dec. 31, 2023
Dec. 31, 2022
Dec. 31, 2021
Pay vs Performance Disclosure          
Pay vs Performance Disclosure, Table

PAY VERSUS PERFORMANCE

As required by Item 402(v) of Regulation S-K, we are providing the following information on the relationship between Compensation Actually Paid (CAP) and PPL’s performance for our NEOs, including our principal executive officer. CAP is defined by the SEC and is not used by the People and Compensation Committee in its pay-for-performance assessments. See the Compensation Discussion and Analysis (CD&A) section for a discussion of PPL’s compensation philosophy, practices and programs.

PPL’s executive compensation programs are structured to promote a strong pay for performance culture. As noted in the CD&A, 88% of the CEO’s 2025 target compensation was “at-risk” and 73% was performance based.

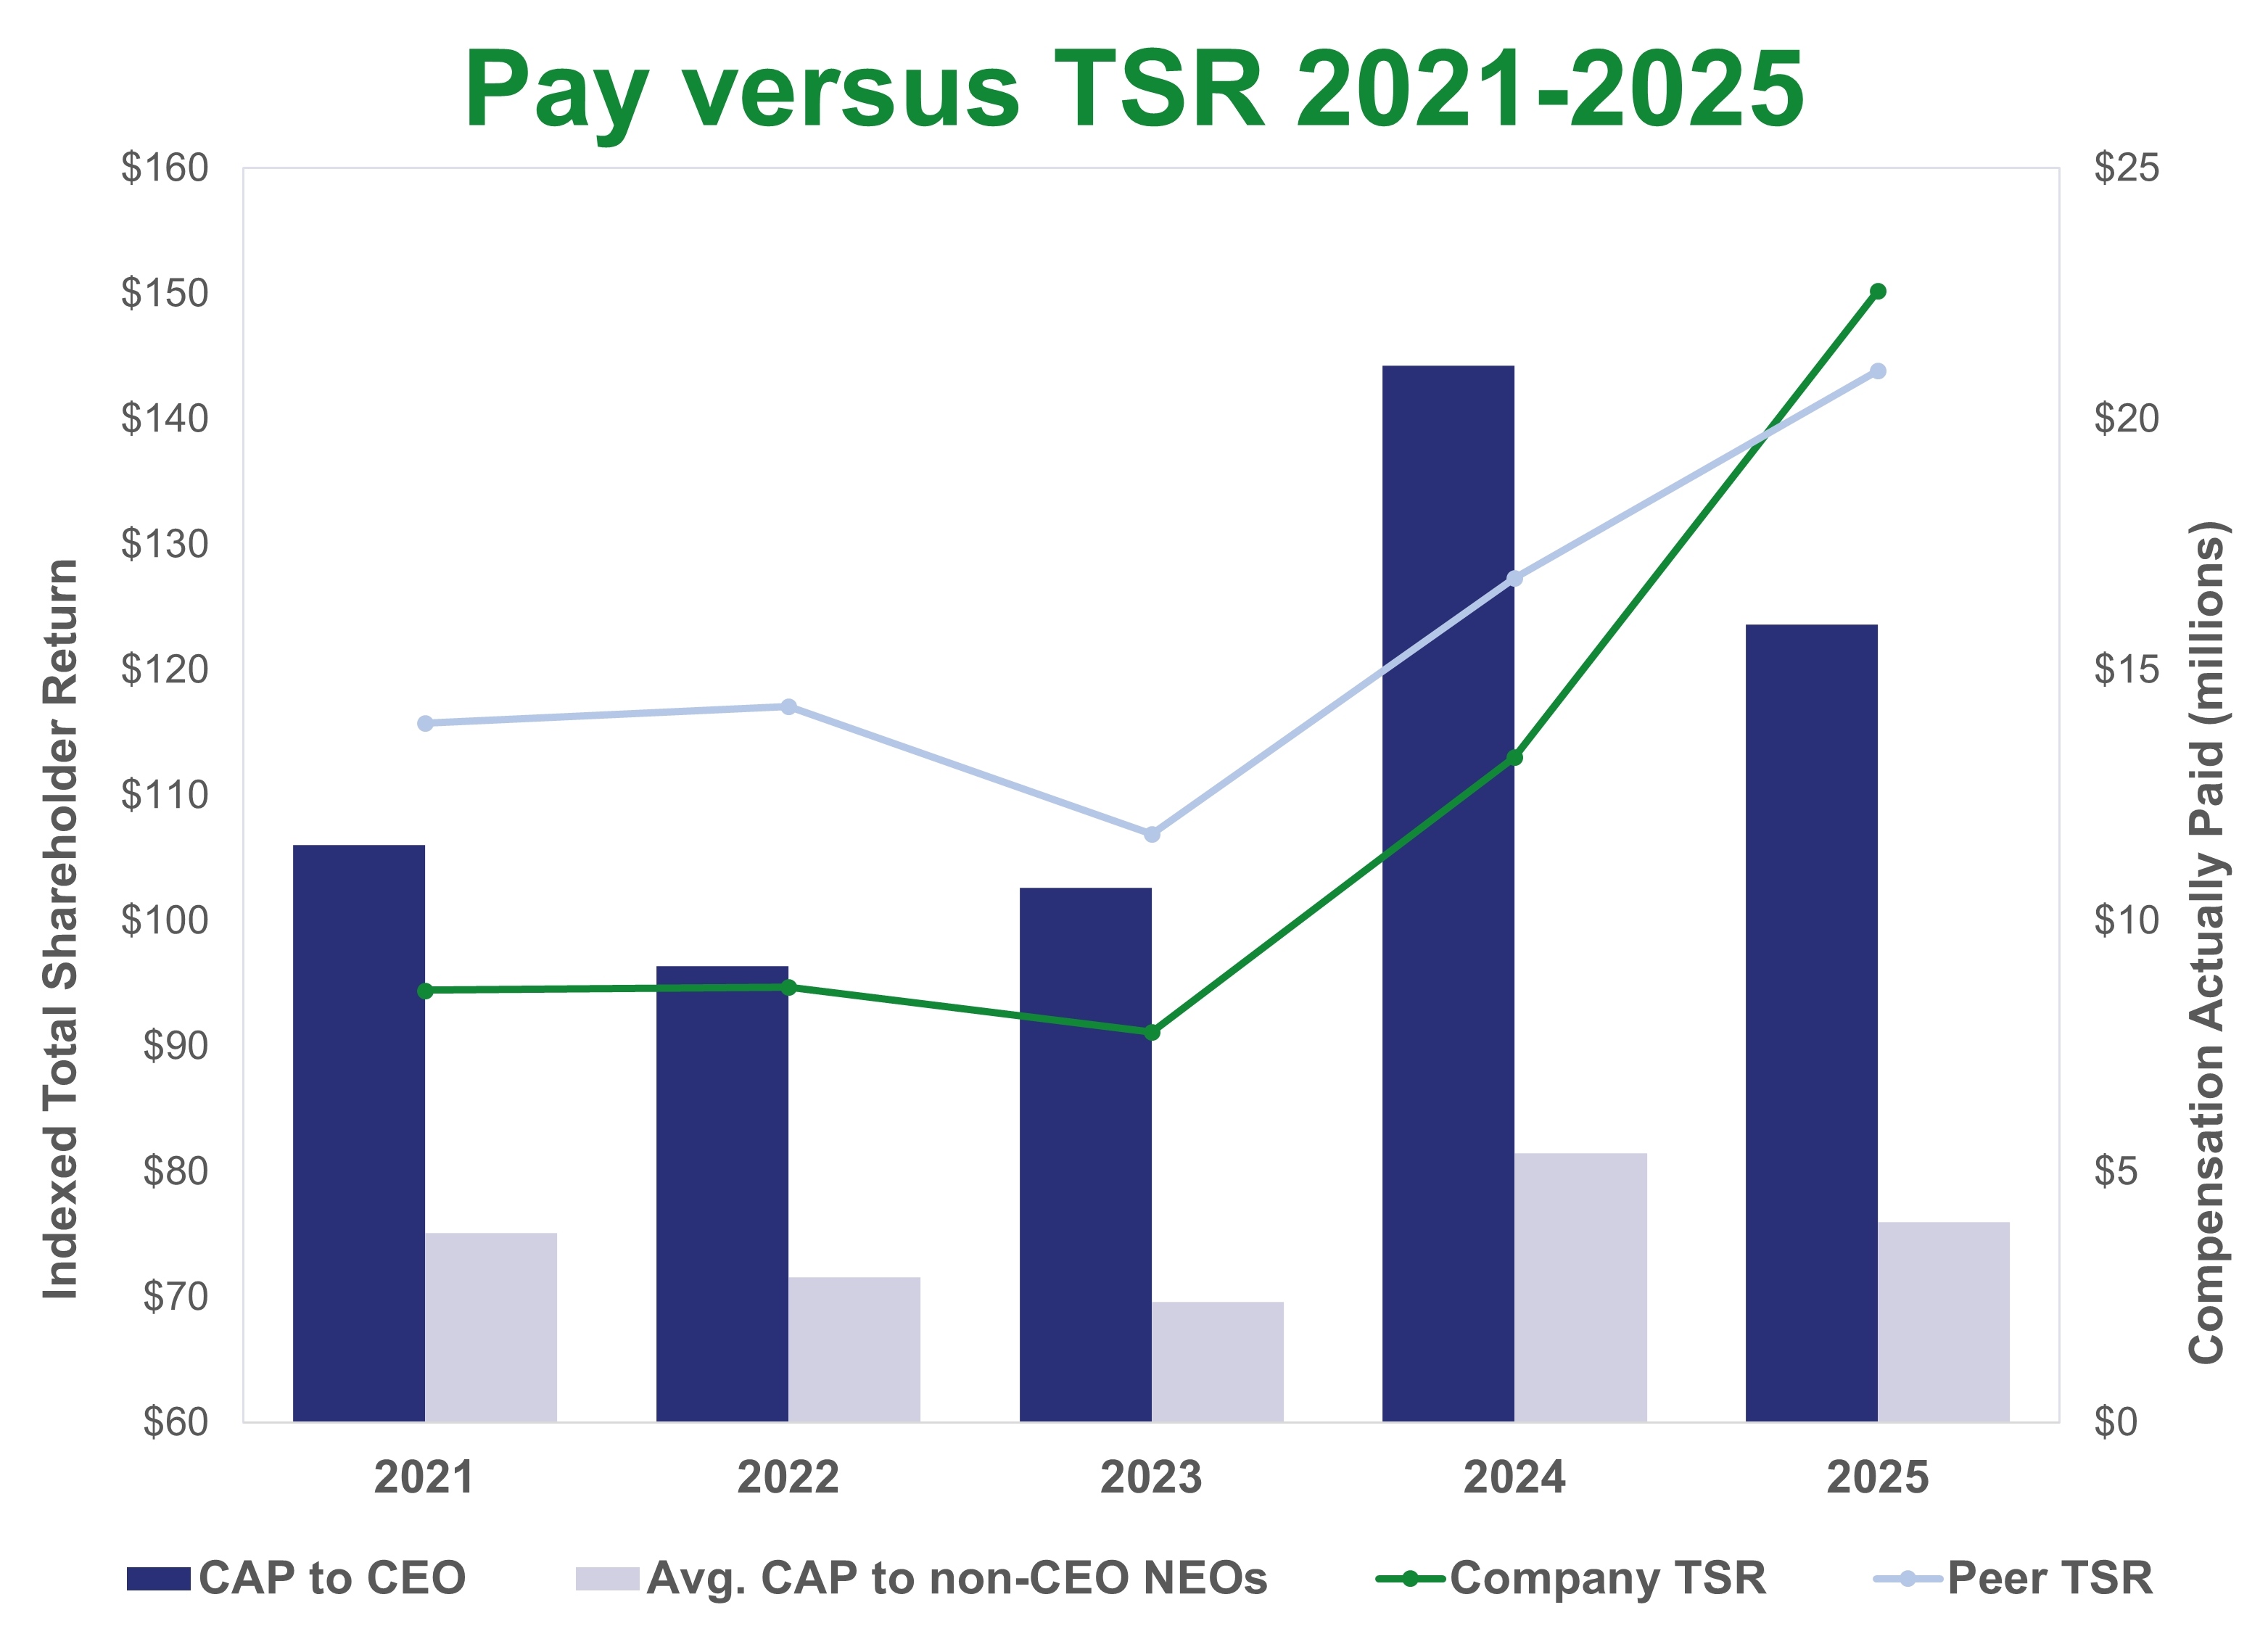
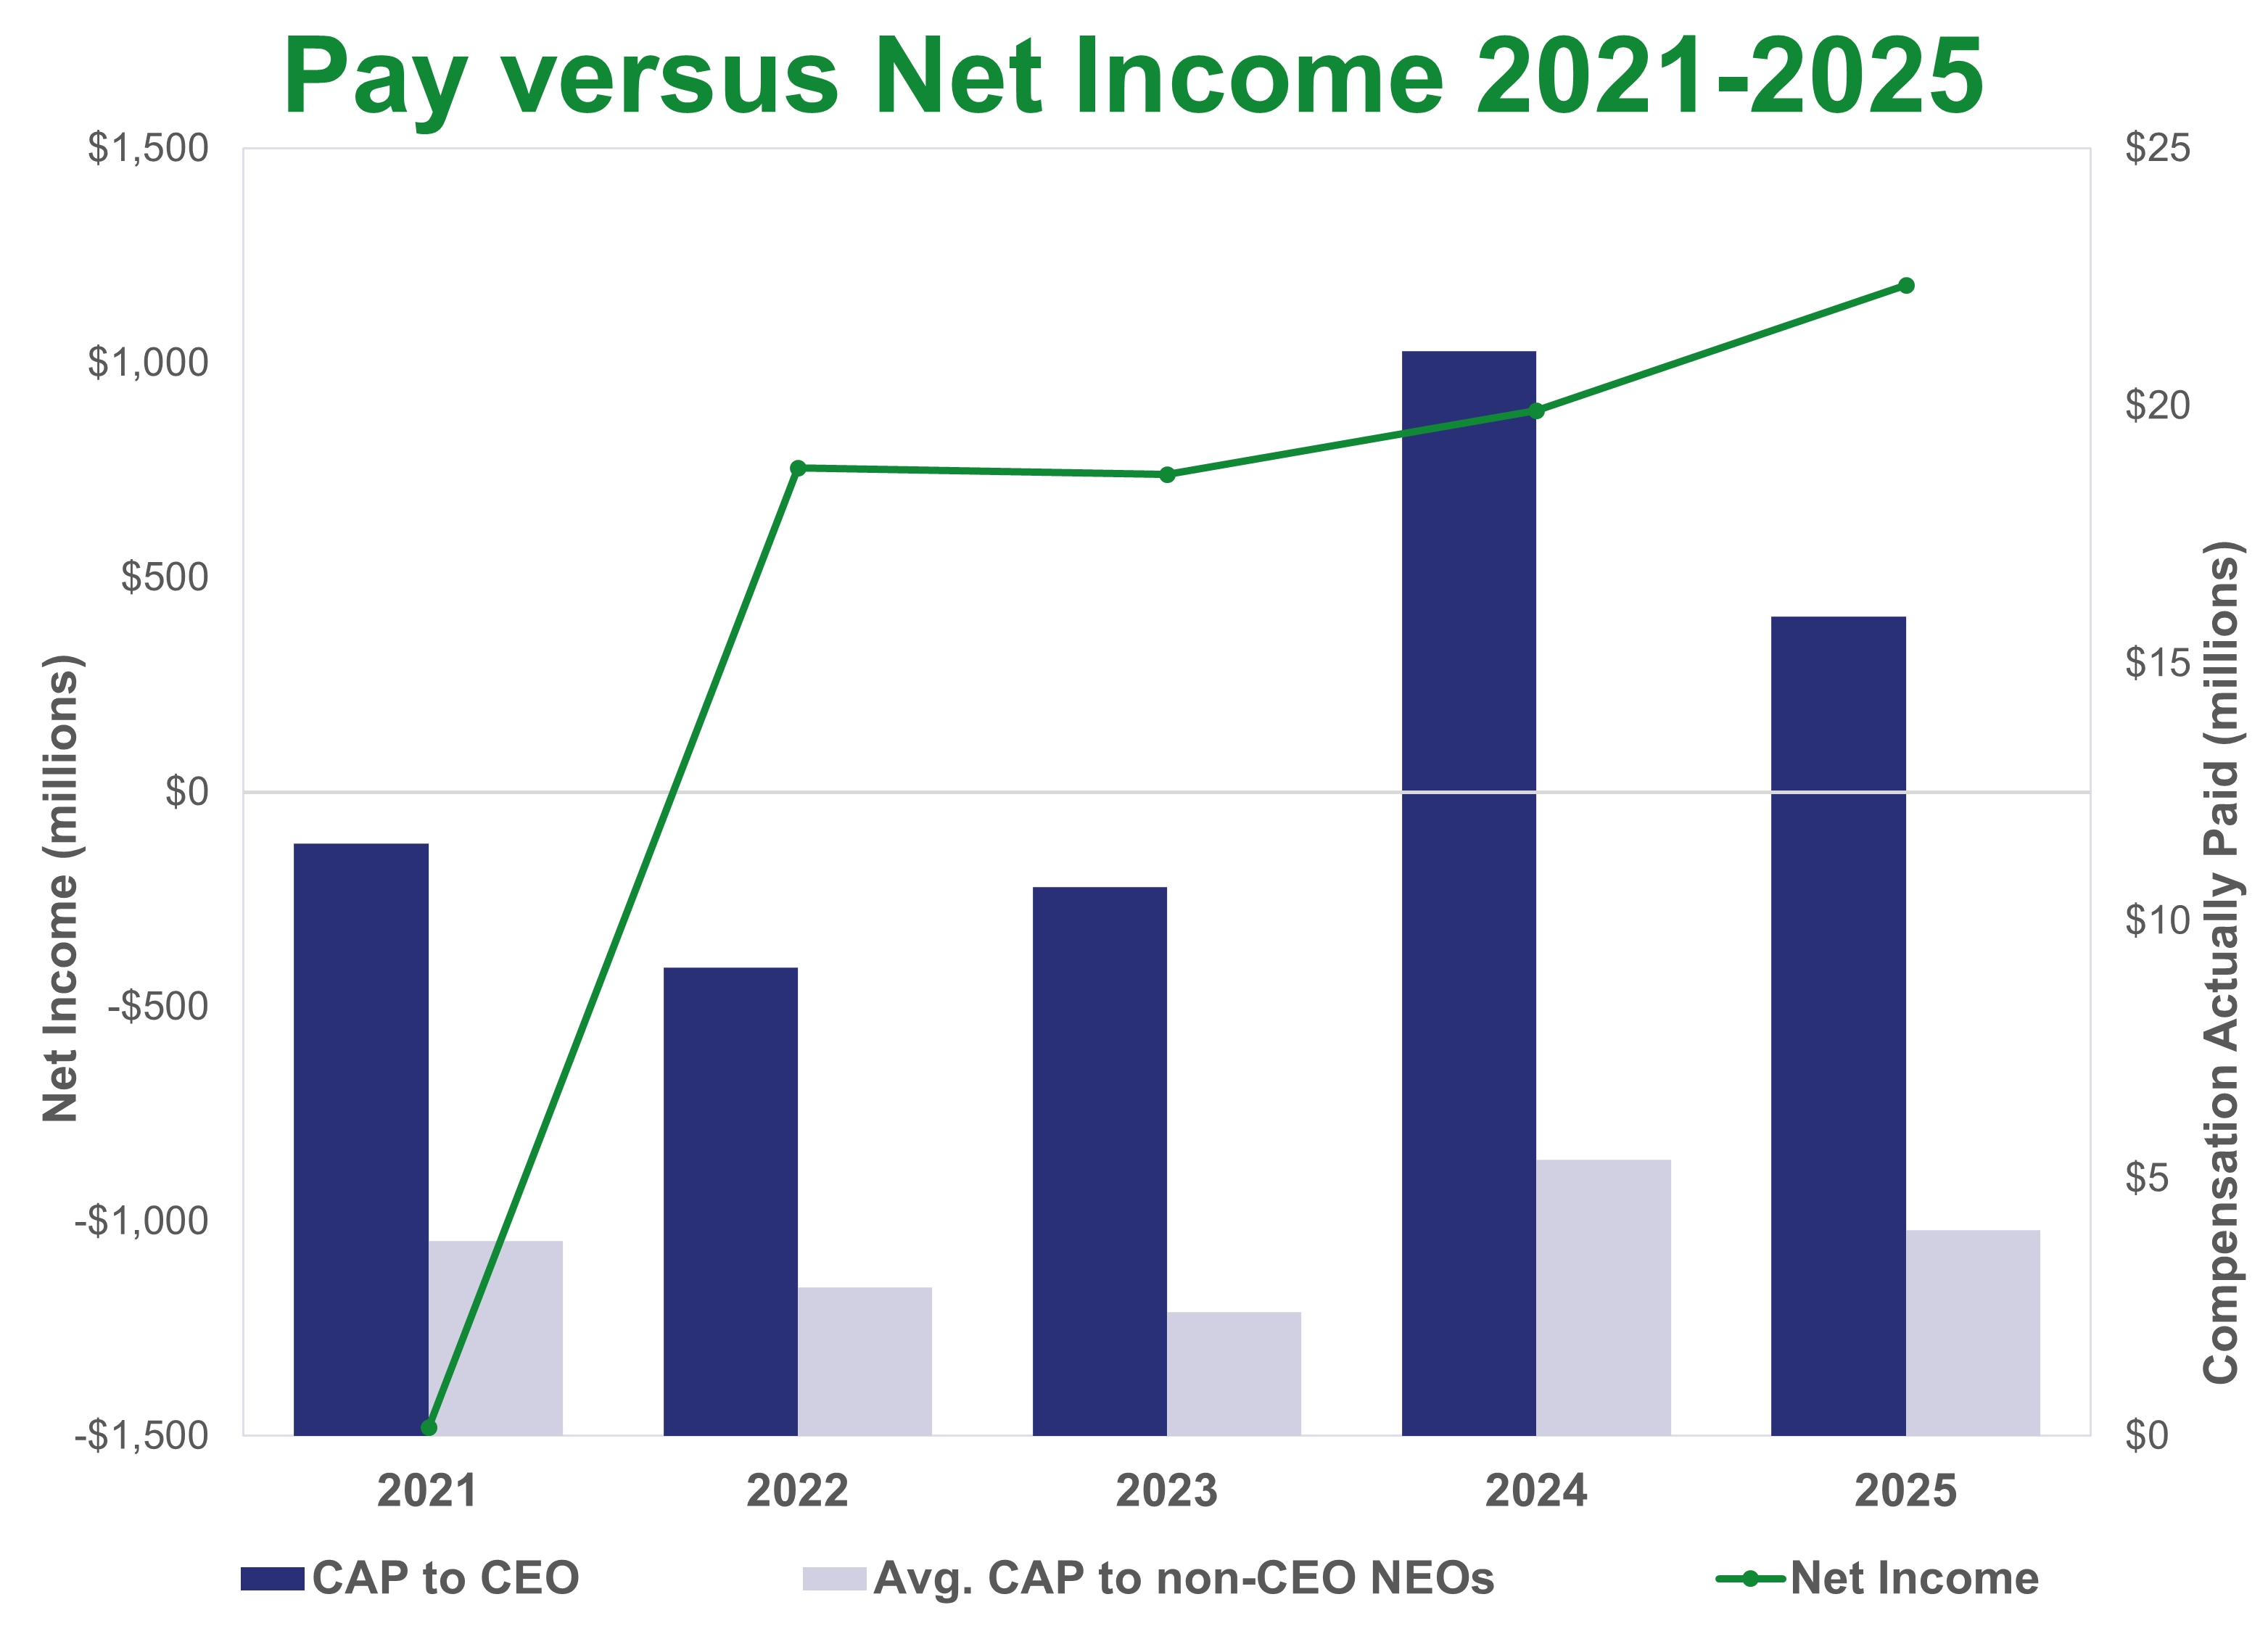
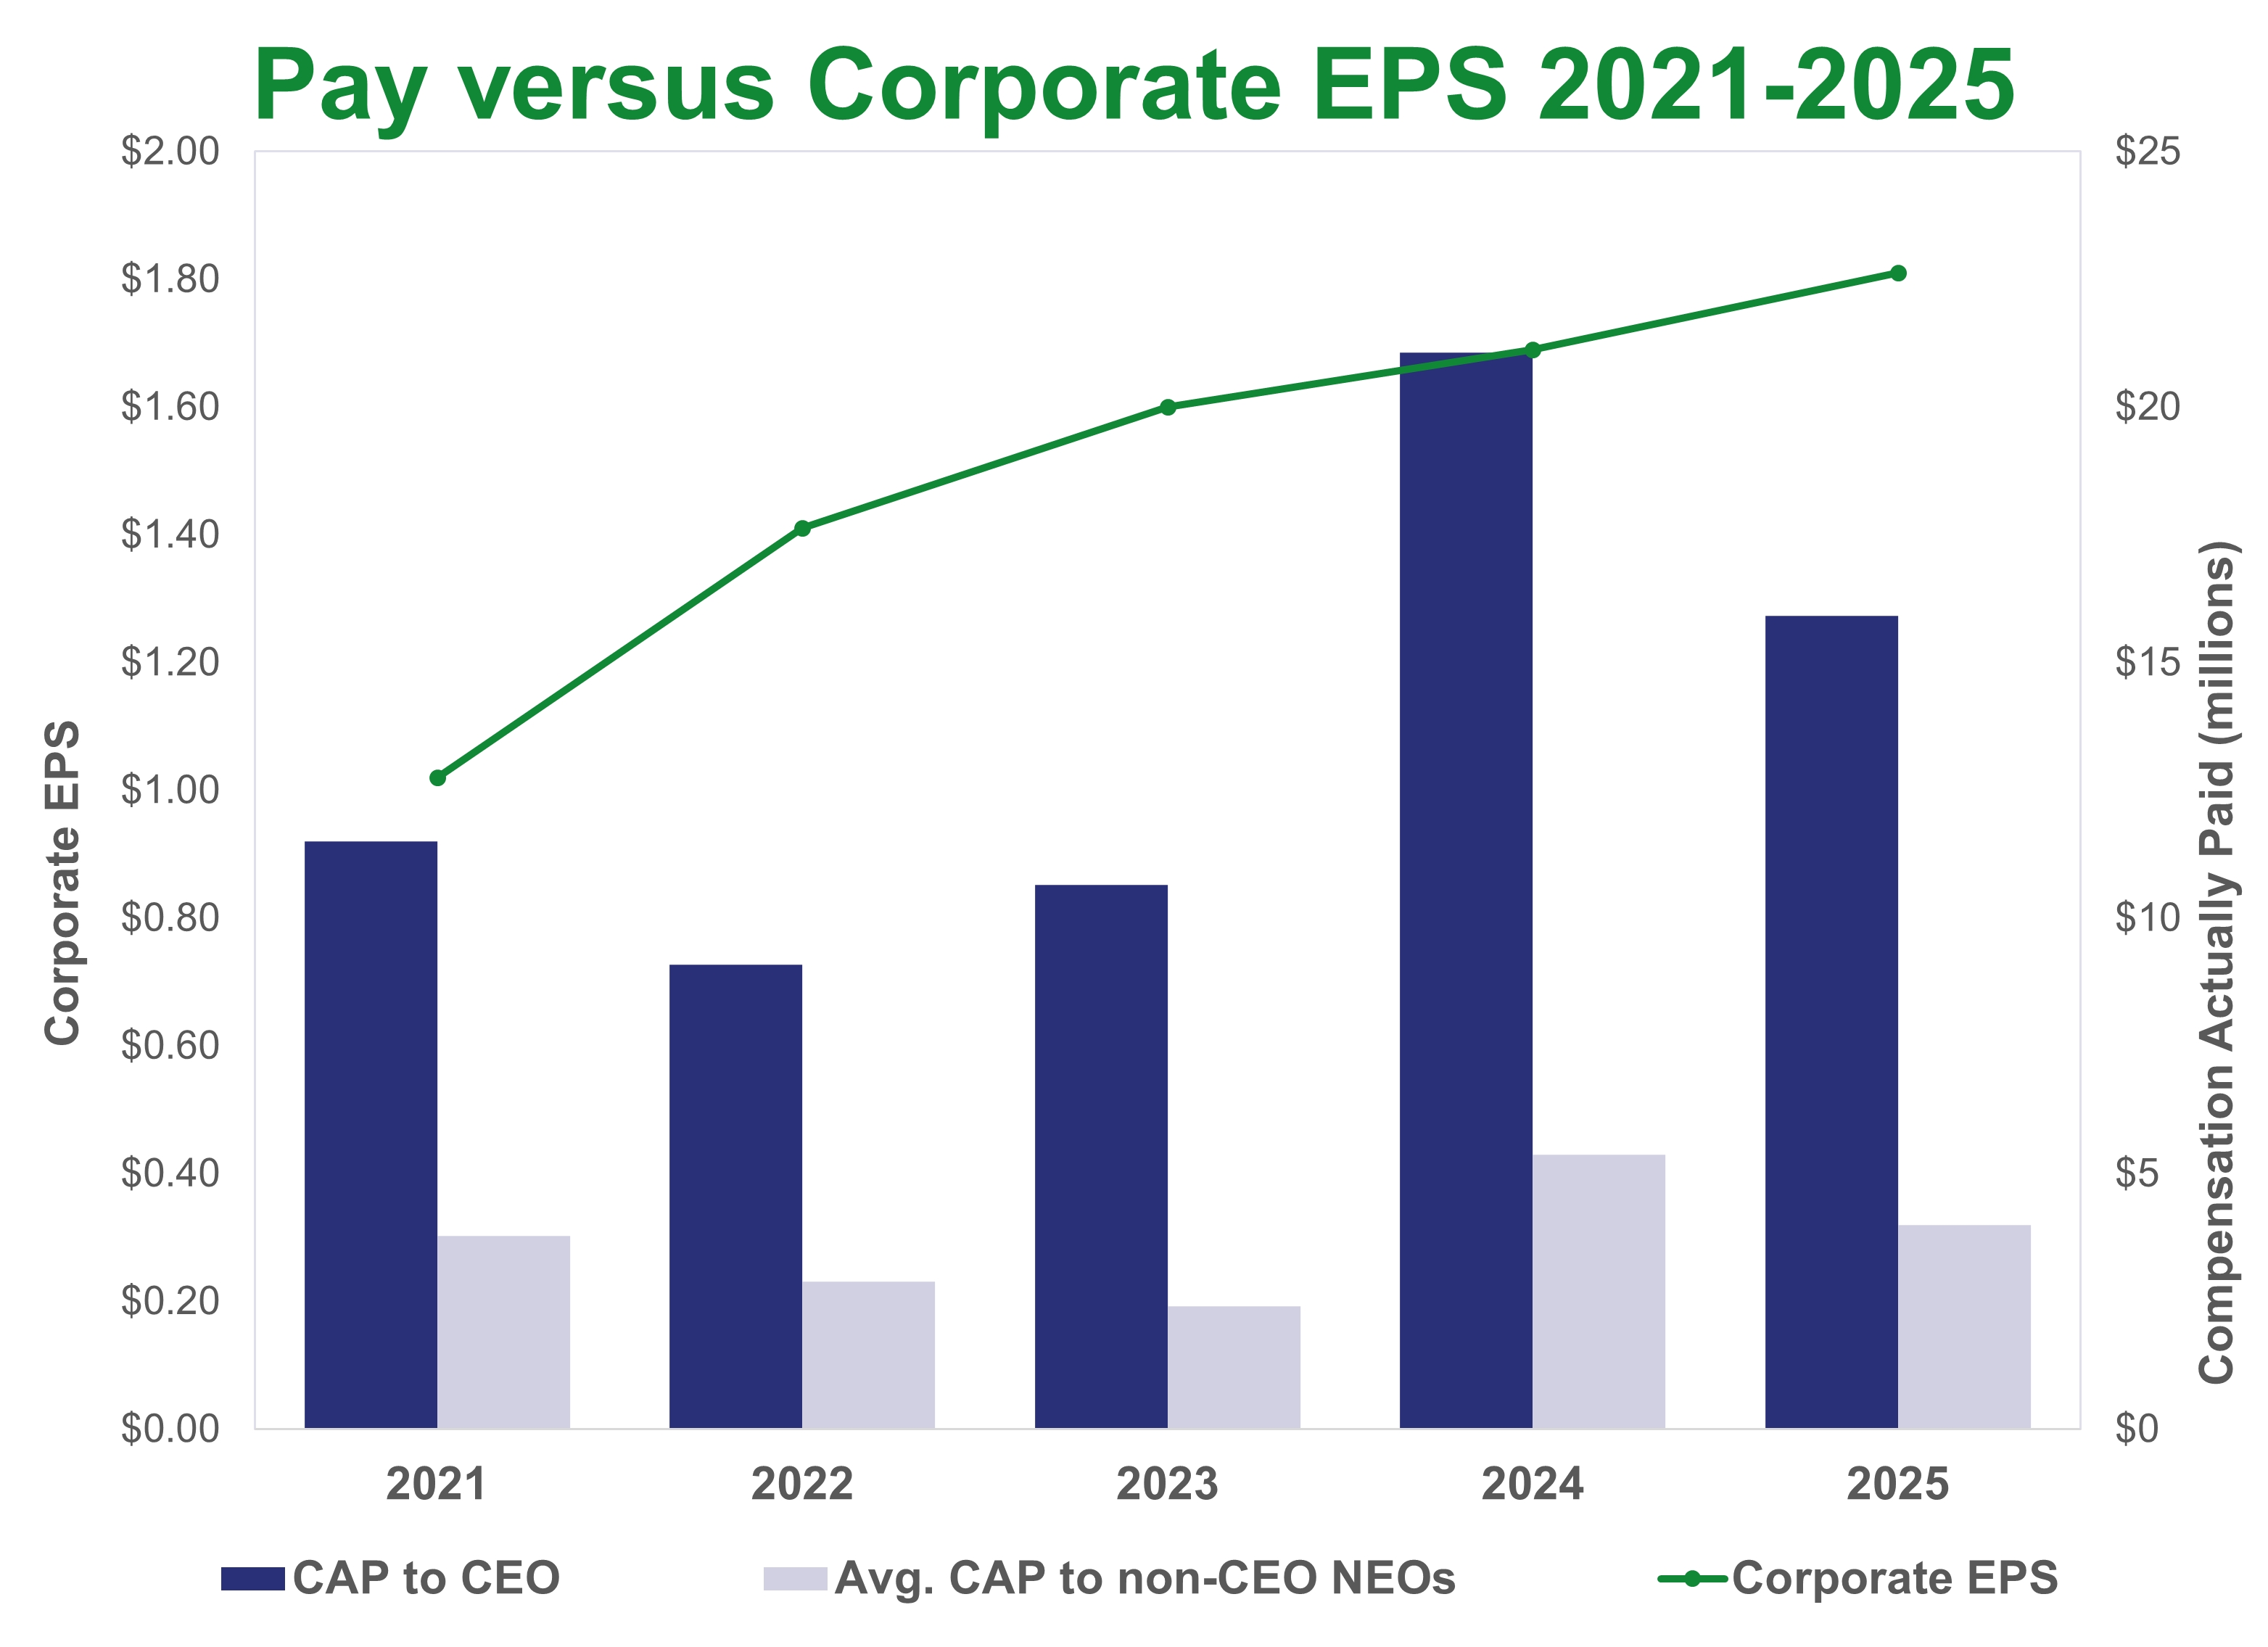
Based on our approach to align executive pay closely with performance, PPL’s CAP is directionally aligned with PPL’s Corporate EPS, total shareowner return (TSR), and earnings growth (EG). For example, the CEO 2025 CAP is greater than 2025 Summary Compensation Table (SCT) disclosure, driven by year-over-year stock appreciation and corresponding increase in payout probabilities for outstanding long-term incentive awards. See the table below for more details followed by a description of the relationship between CAP and select performance metrics.

PAY VERSUS PERFORMANCE TABLE


Year

SCT Total
for CEO

Comp Actually
Paid to CEO

Average SCT
Total for

Average Comp
Actually Paid

Value of Initial Fixed $100
Investment Based on:

Net Income

Corporate


(Sorgi)

(Sorgi)(1)(4)

Non-CEO NEOs(2)

to Non-CEO NEOs(2)(4)

Company TSR

Peer Group TSR(3)

(millions)

EPS(5)

2025

$

13,221,331


$

15,906,018


$

3,644,828


$

3,996,944


$

150

$

144

$

1,181


$

1.81

2024


11,355,743


21,062,470


3,453,068


5,362,484


135


129


888


1.69

2023


11,969,556


10,652,416


3,034,235


2,396,766


109


108


740


1.60

2022


9,146,575


9,088,623


2,706,259


2,888,926


113


118


756


1.41

2021


11,356,481


11,504,637


3,976,822


3,779,539


113


117


(1,480)


1.02


CEO Compensation Reconciliation Footnotes

(1)
SCT Totals and CAP Totals for CEO include Mr. Sorgi, President and Chief Executive Officer. A reconciliation of total compensation from the SCT to CAP for our CEO and additional related information is provided in the following tables:

Year

SCT Total
for CEO

Total Equity
Adjustment
(a)

Total Pension
Benefit
Adjustment
(b)

CAP Total
for CEO

Total
Adjustment

2025

$

13,221,331


$

4,228,188


$

(1,543,501)


$

15,906,018


$

2,684,687


(a) The following provides the adjustments for equity compensation:

Year

SCT Total

Deduct: Value of Stock Awards in SCT

Add: FYE Fair Value of Unvested Stock Awards Granted
during FY

Add: Year Over Year Change in Fair Value from prior FYE to Current FYE of Unvested Stock Awards Granted in Prior Years

Add: Change in Fair Value from Prior FYE to Vesting Date of Stock Awards Granted in Prior Years that Vested in FY

Equity Value
Included in CAP

Total Equity
Adjustment

2025

$

13,221,331


$

7,865,249


$

9,559,260


$

651,873


$

1,882,304


$

12,093,437


$

4,228,188


(b) The following provides the adjustments for pension and defined benefit plan compensation:

Year

SCT Total

Deduct: SCT Aggregate Change in Value of Accumulated Benefits Under Defined Benefit and Pension Plans

Add: Aggregate Value of the Service Cost Attributable to CEO Under the Defined Benefit Pension Plan for Services during FY and Prior Service Cost of Benefits Granted in a Defined Benefit Pension Plan Amendment Attributable to CEO for Services in Years Prior to Amendment

Total Pension
Benefit
Adjustment

2025

$

13,221,331


$

2,119,321


$

575,820


$

(1,543,501)


Non-CEO NEO Average Compensation Reconciliation Footnotes

(2) Average SCT Totals and Average CAP Totals for Non-CEO NEOs include:

for 2025, Mr. Bergstein, Ms. Stark, Mr. Del Vecchio, Mr. Bonenberger and Mr. Sullivan;
for 2024, Mr. Bergstein, Mr. Del Vecchio, Mr. Sullivan and Ms. Stark;
for 2023, Mr. Bergstein, Mr. Sullivan, Ms. Stark, John R. Crockett III, President of LG&E and KU Energy LLC and Senior Vice President and Chief Development Officer of PPL Services Corporation, and Stephanie R. Raymond, former President of PPL Electric;
for 2022, Mr. Bergstein, Gregory N. Dudkin, former Chief Operating Officer, Ms. Stark and Mr. Crockett; and
for 2021, Mr. Bergstein, Mr. Dudkin, Paul W. Thompson, former President and CEO of LKE, Ms. Stark and Philip Swift, former Chief Executive of Western Power Distribution.


A reconciliation of average total compensation from the SCT to CAP for our 2025 non-CEO NEOs and additional related information is provided in the following tables:

Year

SCT Total for
non-CEO NEOs

Total Equity
Adjustment
(a)

Total Pension
Benefit
Adjustment
(b)

CAP Total for
non-CEO NEOs

Total
Adjustment

2025

$

3,644,828


$

753,291


$

(401,175)


$

3,996,944


$

352,116


(a) The following provides the adjustments for equity compensation:

Year

SCT Total

Deduct: Value of Stock and Option Awards in SCT

Add: FYE Fair Value of Unvested Stock Awards Granted during FY

Add: Year Over Year Change in Fair Value from prior FYE to Current FYE of Unvested Stock Awards Granted in Prior Years

Add: Change in Fair Value from Prior FYE to Vesting Date of Stock Awards Granted in Prior Years that Vested in FY

Equity Value
Included in CAP

Total Equity
Adjustment

2025

$

3,644,828


$

1,695,245


$

1,893,816


$

133,831


$

420,889


$

2,448,536


$

753,291


(b) The following provides the adjustments for pension and defined benefit plan compensation:

Year

SCT Total

Deduct: SCT
Aggregate Change in Value of Accumulated Benefits Under Defined Benefit and Pension Plans

Add: Aggregate Value of the Service Cost Attributable to NEOs Under the Defined Benefit Pension Plan for Services during FY and Prior Service Cost of Benefits Granted in a Defined Benefit Pension Plan Amendment Attributable to NEOs for Services in Years Prior to Amendment

Total Pension
Benefit Adjustment

2025

$

3,644,828


$

455,227


$

54,052


$

(401,175)


(3)
TSR assumes $100 invested on December 31, 2020, including reinvestment of dividends. Peer Group TSR represents the EEI Index of Investor-owned Electric Utilities, which is used by the company for purposes of compliance with Item 201(e) of Regulation S-K.
(4)
In calculating CAP, PPL calculated the fair value (or change in fair value) of outstanding, vested and forfeited equity awards in accordance with SEC rules for CAP and computed in a manner consistent with the methodology for financial reporting purposes consistent with U.S. generally accepted accounting principles. For restricted stock units, CAP values are based on a closing price on applicable year-end date(s) or, in the case of vesting dates, the actual vesting price. For performance units (excluding TSR Awards), CAP values are based on the same valuation methodology as restricted stock unit awards above except year-end values are multiplied times the probability of achievement as of each such date. For TSR-based performance units, the fair value is calculated by a Monte Carlo simulation model that considers a correlation coefficient, expected stock volatility and expected life as of the applicable year-end date(s). For more information about the assumptions used to value awards on their grant date, see the “Grants of Plan-Based Awards During 2025” table on page 63. For more information about the reported value for future achievement of outstanding performance-based awards, see the “Outstanding Equity Awards at Fiscal Year End 2025” table on page 64.
(5)
Corporate EPS. See page 38 for more information on Corporate EPS and its use in our annual cash incentive plans.
       
Company Selected Measure Name Corporate EPS.        
Named Executive Officers, Footnote Average SCT Totals and Average CAP Totals for Non-CEO NEOs include:
for 2025, Mr. Bergstein, Ms. Stark, Mr. Del Vecchio, Mr. Bonenberger and Mr. Sullivan;
for 2024, Mr. Bergstein, Mr. Del Vecchio, Mr. Sullivan and Ms. Stark;
for 2023, Mr. Bergstein, Mr. Sullivan, Ms. Stark, John R. Crockett III, President of LG&E and KU Energy LLC and Senior Vice President and Chief Development Officer of PPL Services Corporation, and Stephanie R. Raymond, former President of PPL Electric;
for 2022, Mr. Bergstein, Gregory N. Dudkin, former Chief Operating Officer, Ms. Stark and Mr. Crockett; and
for 2021, Mr. Bergstein, Mr. Dudkin, Paul W. Thompson, former President and CEO of LKE, Ms. Stark and Philip Swift, former Chief Executive of Western Power Distribution.
       
Peer Group Issuers, Footnote Peer Group TSR represents the EEI Index of Investor-owned Electric Utilities, which is used by the company for purposes of compliance with Item 201(e) of Regulation S-K.        
Adjustment To PEO Compensation, Footnote
(1)
SCT Totals and CAP Totals for CEO include Mr. Sorgi, President and Chief Executive Officer. A reconciliation of total compensation from the SCT to CAP for our CEO and additional related information is provided in the following tables:

Year

SCT Total
for CEO

Total Equity
Adjustment
(a)

Total Pension
Benefit
Adjustment
(b)

CAP Total
for CEO

Total
Adjustment

2025

$

13,221,331


$

4,228,188


$

(1,543,501)


$

15,906,018


$

2,684,687


(a) The following provides the adjustments for equity compensation:

Year

SCT Total

Deduct: Value of Stock Awards in SCT

Add: FYE Fair Value of Unvested Stock Awards Granted
during FY

Add: Year Over Year Change in Fair Value from prior FYE to Current FYE of Unvested Stock Awards Granted in Prior Years

Add: Change in Fair Value from Prior FYE to Vesting Date of Stock Awards Granted in Prior Years that Vested in FY

Equity Value
Included in CAP

Total Equity
Adjustment

2025

$

13,221,331


$

7,865,249


$

9,559,260


$

651,873


$

1,882,304


$

12,093,437


$

4,228,188


(b) The following provides the adjustments for pension and defined benefit plan compensation:

Year

SCT Total

Deduct: SCT Aggregate Change in Value of Accumulated Benefits Under Defined Benefit and Pension Plans

Add: Aggregate Value of the Service Cost Attributable to CEO Under the Defined Benefit Pension Plan for Services during FY and Prior Service Cost of Benefits Granted in a Defined Benefit Pension Plan Amendment Attributable to CEO for Services in Years Prior to Amendment

Total Pension
Benefit
Adjustment

2025

$

13,221,331


$

2,119,321


$

575,820


$

(1,543,501)


Non-PEO NEO Average Total Compensation Amount $ 3,644,828 $ 3,453,068 $ 3,034,235 $ 2,706,259 $ 3,976,822
Non-PEO NEO Average Compensation Actually Paid Amount $ 3,996,944 5,362,484 2,396,766 2,888,926 3,779,539
Adjustment to Non-PEO NEO Compensation Footnote

(2) Average SCT Totals and Average CAP Totals for Non-CEO NEOs include:

for 2025, Mr. Bergstein, Ms. Stark, Mr. Del Vecchio, Mr. Bonenberger and Mr. Sullivan;
for 2024, Mr. Bergstein, Mr. Del Vecchio, Mr. Sullivan and Ms. Stark;
for 2023, Mr. Bergstein, Mr. Sullivan, Ms. Stark, John R. Crockett III, President of LG&E and KU Energy LLC and Senior Vice President and Chief Development Officer of PPL Services Corporation, and Stephanie R. Raymond, former President of PPL Electric;
for 2022, Mr. Bergstein, Gregory N. Dudkin, former Chief Operating Officer, Ms. Stark and Mr. Crockett; and
for 2021, Mr. Bergstein, Mr. Dudkin, Paul W. Thompson, former President and CEO of LKE, Ms. Stark and Philip Swift, former Chief Executive of Western Power Distribution.


A reconciliation of average total compensation from the SCT to CAP for our 2025 non-CEO NEOs and additional related information is provided in the following tables:

Year

SCT Total for
non-CEO NEOs

Total Equity
Adjustment
(a)

Total Pension
Benefit
Adjustment
(b)

CAP Total for
non-CEO NEOs

Total
Adjustment

2025

$

3,644,828


$

753,291


$

(401,175)


$

3,996,944


$

352,116


(a) The following provides the adjustments for equity compensation:

Year

SCT Total

Deduct: Value of Stock and Option Awards in SCT

Add: FYE Fair Value of Unvested Stock Awards Granted during FY

Add: Year Over Year Change in Fair Value from prior FYE to Current FYE of Unvested Stock Awards Granted in Prior Years

Add: Change in Fair Value from Prior FYE to Vesting Date of Stock Awards Granted in Prior Years that Vested in FY

Equity Value
Included in CAP

Total Equity
Adjustment

2025

$

3,644,828


$

1,695,245


$

1,893,816


$

133,831


$

420,889


$

2,448,536


$

753,291


(b) The following provides the adjustments for pension and defined benefit plan compensation:

Year

SCT Total

Deduct: SCT
Aggregate Change in Value of Accumulated Benefits Under Defined Benefit and Pension Plans

Add: Aggregate Value of the Service Cost Attributable to NEOs Under the Defined Benefit Pension Plan for Services during FY and Prior Service Cost of Benefits Granted in a Defined Benefit Pension Plan Amendment Attributable to NEOs for Services in Years Prior to Amendment

Total Pension
Benefit Adjustment

2025

$

3,644,828


$

455,227


$

54,052


$

(401,175)


Compensation Actually Paid vs. Total Shareholder Return

img212496855_59.jpg

       
Compensation Actually Paid vs. Net Income

img212496855_60.jpg

       
Compensation Actually Paid vs. Company Selected Measure

img212496855_61.jpg

       
Total Shareholder Return Vs Peer Group

img212496855_59.jpg

       
Tabular List, Table

List of Company Selected Measures


The adjacent table highlights PPL’s performance measures that are most closely tied to executive compensation as reported in the Pay vs. Performance Table above. See page 38 for more information on how we align our compensation with performance, including Corporate EPS, critical corporate initiatives and operational goals, in our annual cash incentive plan and Annex A for a reconciliation of financial measures presented in accordance with GAAP to non-GAAP measures used for compensation. See page 39 for more information on how TSR, EG, and LTS are utilized in our LTI plan.


Most Important Performance Measures

(alphabetical ranking)


Corporate Earnings Per Share (Corporate EPS)


Critical Corporate Initiatives


Earnings Growth (EG)


Long-Term Sustainability (LTS)


Operational Goals


Relative Total Shareowner Return (TSR)

       
Total Shareholder Return Amount $ 150 135 109 113 113
Peer Group Total Shareholder Return Amount 144 129 108 118 117
Net Income (Loss) $ 1,181,000,000 $ 888,000,000 $ 740,000,000 $ 756,000,000 $ (1,480,000,000)
Company Selected Measure Amount 1.81 1.69 1.6 1.41 1.02
Additional 402(v) Disclosure

As required by Item 402(v) of Regulation S-K, we are providing the following information on the relationship between Compensation Actually Paid (CAP) and PPL’s performance for our NEOs, including our principal executive officer. CAP is defined by the SEC and is not used by the People and Compensation Committee in its pay-for-performance assessments. See the Compensation Discussion and Analysis (CD&A) section for a discussion of PPL’s compensation philosophy, practices and programs.

       
Measure:: 1          
Pay vs Performance Disclosure          
Name Corporate Earnings Per Share (Corporate EPS)        
Non-GAAP Measure Description
(5)
Corporate EPS. See page 38 for more information on Corporate EPS and its use in our annual cash incentive plans.
       
Measure:: 2          
Pay vs Performance Disclosure          
Name Critical Corporate Initiatives        
Measure:: 3          
Pay vs Performance Disclosure          
Name Earnings Growth (EG)        
Measure:: 4          
Pay vs Performance Disclosure          
Name Long-Term Sustainability (LTS)        
Measure:: 5          
Pay vs Performance Disclosure          
Name Operational Goals        
Measure:: 6          
Pay vs Performance Disclosure          
Name Relative Total Shareowner Return (TSR)        
Mr. Sorgi [Member]          
Pay vs Performance Disclosure          
PEO Total Compensation Amount $ 13,221,331 $ 11,355,743 $ 11,969,556 $ 9,146,575 $ 11,356,481
PEO Actually Paid Compensation Amount $ 15,906,018 $ 21,062,470 $ 10,652,416 $ 9,088,623 $ 11,504,637
PEO Name Mr. Sorgi        
PEO | Mr. Sorgi [Member]          
Pay vs Performance Disclosure          
Adjustment to Compensation, Amount $ 2,684,687        
PEO | Mr. Sorgi [Member] | Aggregate Pension Adjustments Service Cost          
Pay vs Performance Disclosure          
Adjustment to Compensation, Amount (1,543,501)        
PEO | Mr. Sorgi [Member] | Pension Adjustments Service Cost          
Pay vs Performance Disclosure          
Adjustment to Compensation, Amount 575,820        
PEO | Mr. Sorgi [Member] | Pension Adjustments Prior Service Cost          
Pay vs Performance Disclosure          
Adjustment to Compensation, Amount (2,119,321)        
PEO | Mr. Sorgi [Member] | Equity Awards Adjustments          
Pay vs Performance Disclosure          
Adjustment to Compensation, Amount 4,228,188        
PEO | Mr. Sorgi [Member] | Aggregate Grant Date Fair Value of Equity Award Amounts Reported in Summary Compensation Table          
Pay vs Performance Disclosure          
Adjustment to Compensation, Amount (7,865,249)        
PEO | Mr. Sorgi [Member] | Equity Awards Adjustments, Excluding Value Reported in Compensation Table          
Pay vs Performance Disclosure          
Adjustment to Compensation, Amount 12,093,437        
PEO | Mr. Sorgi [Member] | Year-end Fair Value of Equity Awards Granted in Covered Year that are Outstanding and Unvested          
Pay vs Performance Disclosure          
Adjustment to Compensation, Amount 9,559,260        
PEO | Mr. Sorgi [Member] | Year-over-Year Change in Fair Value of Equity Awards Granted in Prior Years That are Outstanding and Unvested          
Pay vs Performance Disclosure          
Adjustment to Compensation, Amount 651,873        
PEO | Mr. Sorgi [Member] | Change in Fair Value as of Vesting Date of Prior Year Equity Awards Vested in Covered Year          
Pay vs Performance Disclosure          
Adjustment to Compensation, Amount 1,882,304        
Non-PEO NEO          
Pay vs Performance Disclosure          
Adjustment to Compensation, Amount 352,116        
Non-PEO NEO | Aggregate Pension Adjustments Service Cost          
Pay vs Performance Disclosure          
Adjustment to Compensation, Amount (401,175)        
Non-PEO NEO | Pension Adjustments Service Cost          
Pay vs Performance Disclosure          
Adjustment to Compensation, Amount 54,052        
Non-PEO NEO | Pension Adjustments Prior Service Cost          
Pay vs Performance Disclosure          
Adjustment to Compensation, Amount (455,227)        
Non-PEO NEO | Equity Awards Adjustments          
Pay vs Performance Disclosure          
Adjustment to Compensation, Amount 753,291        
Non-PEO NEO | Aggregate Grant Date Fair Value of Equity Award Amounts Reported in Summary Compensation Table          
Pay vs Performance Disclosure          
Adjustment to Compensation, Amount (1,695,245)        
Non-PEO NEO | Equity Awards Adjustments, Excluding Value Reported in Compensation Table          
Pay vs Performance Disclosure          
Adjustment to Compensation, Amount 2,448,536        
Non-PEO NEO | Year-end Fair Value of Equity Awards Granted in Covered Year that are Outstanding and Unvested          
Pay vs Performance Disclosure          
Adjustment to Compensation, Amount 1,893,816        
Non-PEO NEO | Year-over-Year Change in Fair Value of Equity Awards Granted in Prior Years That are Outstanding and Unvested          
Pay vs Performance Disclosure          
Adjustment to Compensation, Amount 133,831        
Non-PEO NEO | Change in Fair Value as of Vesting Date of Prior Year Equity Awards Vested in Covered Year          
Pay vs Performance Disclosure          
Adjustment to Compensation, Amount $ 420,889