Pure in Millions
Pursuant to a mandate of the Dodd-Frank Act commonly referred to as "Pay versus Performance," the SEC has adopted a rule requiring registrants to provide a clear description of (1) the relationship between executive compensation actually paid ("CAP") to the Company's NEOs (including the principal executive officer or person acting in a similar capacity during the last completed fiscal year ("CEO")) and the Company’s cumulative total shareholder return (“TSR”), net income and a third Company-selected financial measure, and (2) the relationship between the Company's TSR and the TSR of a peer group chosen by the Company.
The following table provides information regarding CAP to our CEO and non-CEO NEOs during each of the past five fiscal years, as well as TSR, net income, and our Company-selected measure, adjusted EBITDA. See the “Compensation Discussion and Analysis" section above for a comprehensive discussion of our executive compensation program and philosophy.
|
Value of Initial Fixed $100 Investment Based on: |
||||||||||||||||||||||||||||||||||||||||
|
Year (a) |
Summary Compensation Table Total for Current CEO(1)
($) (b) |
Compensation Actually Paid to Current CEO
($) (c) |
Summary Compensation Table Total for Former CEO(1)
($) (d) |
Compensation Actually Paid to Former CEO
($) (e) |
Average Summary Compensation Table Total for Non-CEO NEOs(1)
($) (f) |
Average Compensation Actually Paid to Non-CEO NEOs
($) (g) |
Interface Total Shareholder Return(2)
($) (h) |
Peer Group Total Shareholder Return(2)(3)
($) (i) |
Net Income (in Millions)
($) (j) |
Interface Adjusted EBITDA(4) (in Millions)
($) (k) |
||||||||||||||||||||||||||||||
|
2025 |
5,651,488 | 10,461,049 | N/A | N/A | 2,004,495 | 2,858,947 | 274.81 | 136.30 | 116.1 | 217.9 | ||||||||||||||||||||||||||||||
|
2024 |
5,590,848 | 14,534,973 | N/A | N/A | 1,916,984 | 4,521,182 | 154.07 | 112.05 | 86.9 | 189.0 | ||||||||||||||||||||||||||||||
|
2023 |
4,526,511 | 4,807,487 | N/A | N/A | 1,797,544 | 2,146,971 | 77.74 | 99.79 | 44.5 | 162.0 | ||||||||||||||||||||||||||||||
|
2022 |
5,091,309 | 4,511,701 | 3,658,931 | 1,914,885 | 1,362,460 | 645,183 | 60.70 | 99.94 | 19.6 | 176.1 | ||||||||||||||||||||||||||||||
|
2021 |
N/A | N/A | 6,250,848 | 7,083,641 | 1,889,694 | 2,188,909 | 97.22 | 132.16 | 55.2 | 169.4 | ||||||||||||||||||||||||||||||
|
(1) |
These columns reflect the amounts reported in the “Summary Compensation Table” for Ms. Hurd, our current CEO, Mr. Hendrix, our former CEO, and the average for our non-CEO NEOs, for each of the years listed. The non-CEO NEOs for whom the average compensation is presented in this table are Messrs. Foshee, Hausmann, Poppens and Stansfield, for each of the years presented. |
|
(2) |
TSR is calculated based on an initial fixed investment of $100 on December 31, 2020 (the final trading day before our 2021 fiscal year), assuming reinvestment of dividends, through the end of the covered fiscal year presented. |
|
(3) |
The peer group used for the TSR calculation are the same companies comprising the “self-determined peer group” index used for compensation decision making (as described in the Compensation Discussion and Analysis in the proxy statement for each applicable fiscal year) and used to create the stock performance graph included in the Company’s Annual Report on Form 10-K for each applicable fiscal year. |
|
(4) |
Adjusted EBITDA is a non-GAAP financial measure. Please see Appendix A for a reconciliation of this non-GAAP measure to the most directly comparable GAAP measure. |

Adjustments to the Summary Compensation Table Totals to arrive at CAP for our CEOs and Non-CEO NEOs are shown below.
|
Calculation for Current CEO Hurd _________________________________________________________ |
Calculation for Avg of Non-CEO NEOs ____________________________________________________ |
|||||||||||||||||||||||||||||||||||||||
|
Year 2021 ($) |
Year 2022 ($) |
Year 2023 ($) |
Year 2024 ($) |
Year 2025 ($) |
Year 2021 ($) |
Year 2022 ($) |
Year 2023 ($) |
Year 2024 ($) |
Year 2025 ($) |
|||||||||||||||||||||||||||||||
|
Summary Compensation Table Total |
N/A | 5,091,309 | 4,526,511 | 5,590,848 | 5,651,488 | 1,889,694 | 1,362,460 | 1,797,544 | 1,916,984 | 2,004,495 | ||||||||||||||||||||||||||||||
|
Less Stock Award Value Reported in Summary Compensation Table for the Covered Year |
N/A | (3,543,485 | ) | (2,614,777 | ) | (2,740,892 | ) | (2,821,999 | ) | (934,024 | ) | (550,168 | ) | (914,060 | ) | (699,128 | ) | (665,391 | ) | |||||||||||||||||||||
|
Plus Fair Value for Awards Granted in the Covered Year |
N/A | 2,963,877 | 2,931,519 | 6,246,104 | 4,322,888 | 1,113,482 | 444,128 | 1,083,559 | 1,593,213 | 816,253 | ||||||||||||||||||||||||||||||
|
Change in Fair Value of Awards from Prior Years that Vested in Covered Year |
N/A | - | (134,309 | ) | 133,867 | (717,469 | ) | 2,040 | (20,731 | ) | (18,153 | ) | 96,842 | (149,801 | ) | |||||||||||||||||||||||||
|
Change in Fair Value of Outstanding Unvested Awards from Prior Years |
N/A | - | 98,543 | 5,305,045 | 4,151,639 | 136,553 | (573,021 | ) | 229,720 | 1,653,356 | 964,022 | |||||||||||||||||||||||||||||
|
Less Fair Value of Awards Forfeited during the Covered Year |
N/A | - | - | - | (125,497 | ) | (18,837 | ) | (17,485 | ) | (18,104 | ) | (36,754 | ) | (18,800 | ) | ||||||||||||||||||||||||
|
Plus Fair Value of Incremental Dividends of Earnings Paid on Stock Awards |
N/A | - | - | - | - | - | - | - | - | - | ||||||||||||||||||||||||||||||
|
Less Aggregate Change in Actuarial Present Value of Accumulated Benefit Under Pension Plans |
N/A | - | - | - | - | - | - | (13,534 | ) | (3,330 | ) | (91,831 | ) | |||||||||||||||||||||||||||
|
Plus Aggregate Service Cost and Prior Service Cost for Pension Plans |
N/A | - | - | - | - | - | - | - | - | - | ||||||||||||||||||||||||||||||
|
“Compensation Actually Paid” |
N/A | 4,511,701 | 4,807,487 | 14,534,973 | 10,461,049 | 2,188,909 | 645,183 | 2,146,971 | 4,521,182 | 2,858,947 | ||||||||||||||||||||||||||||||
| Calculation for Former CEO Hendrix | ||||||||||||||||||||||||||||||||||||||||
|
Calculation of “Compensation Actually Paid” |
Year 2021 ($) |
Year 2022 ($) |
Year 2023 ($) |
Year 2024 ($) |
Year 2025 ($) |
|||||||||||||||||||||||||||||||||||
|
Summary Compensation Table Total |
6,250,848 | 3,658,931 | N/A | N/A | N/A | |||||||||||||||||||||||||||||||||||
|
Less Stock Award Value Reported in Summary Compensation Table for the Covered Year |
(2,150,267 | ) | (991,768 | ) | N/A | N/A | N/A | |||||||||||||||||||||||||||||||||
|
Plus Fair Value for Awards Granted in the Covered Year |
2,656,714 | 738,217 | N/A | N/A | N/A | |||||||||||||||||||||||||||||||||||
|
Change in Fair Value of Awards from Prior Years that Vested in Covered Year |
- | - | N/A | N/A | N/A | |||||||||||||||||||||||||||||||||||
|
Change in Fair Value of Outstanding Unvested Awards from Prior Years |
326,346 | (1,490,495 | ) | N/A | N/A | N/A | ||||||||||||||||||||||||||||||||||
|
Less Fair Value of Awards Forfeited during the Covered Year |
- | - | N/A | N/A | N/A | |||||||||||||||||||||||||||||||||||
|
Plus Fair Value of Incremental Dividends of Earnings Paid on Stock Awards |
- | - | N/A | N/A | N/A | |||||||||||||||||||||||||||||||||||
|
Less Aggregate Change in Actuarial Present Value of Accumulated Benefit Under Pension Plans |
- | - | N/A | N/A | N/A | |||||||||||||||||||||||||||||||||||
|
Plus Aggregate Service Cost and Prior Service Cost for Pension Plans |
- | - | N/A | N/A | N/A | |||||||||||||||||||||||||||||||||||
|
“Compensation Actually Paid” |
7,083,641 | 1,914,885 | N/A | N/A | N/A | |||||||||||||||||||||||||||||||||||
CEO PAY-FOR-PERFORMANCE ALIGNMENT
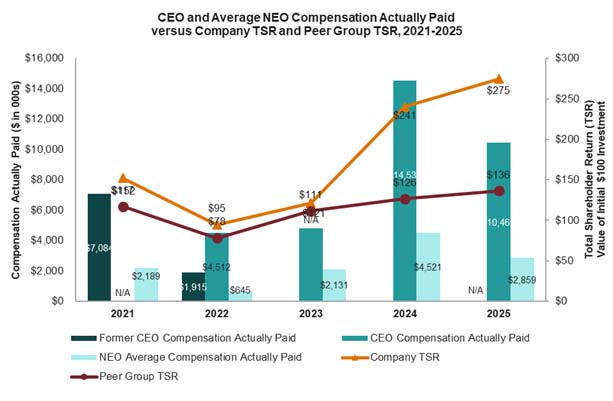
The following chart sets forth the relationship between CAP to our current and former CEO, the average of CAP to our other NEOs, the Company’s cumulative TSR, and the peer group’s cumulative TSR, over the four-year period from 2021 through 2025.
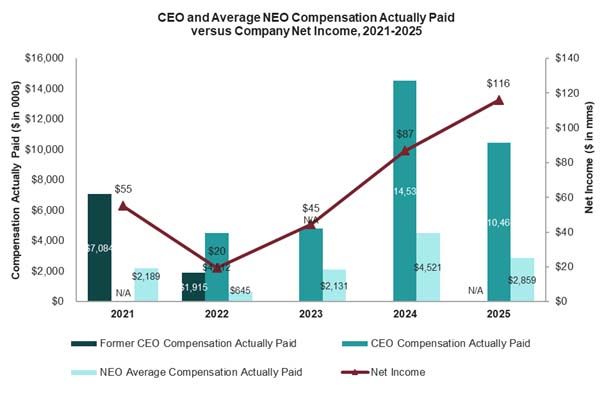
The following chart sets forth the relationship between CAP to our current and former CEO, the average of CAP to our other NEOs, and our net income during fiscal years 2021 through 2025.
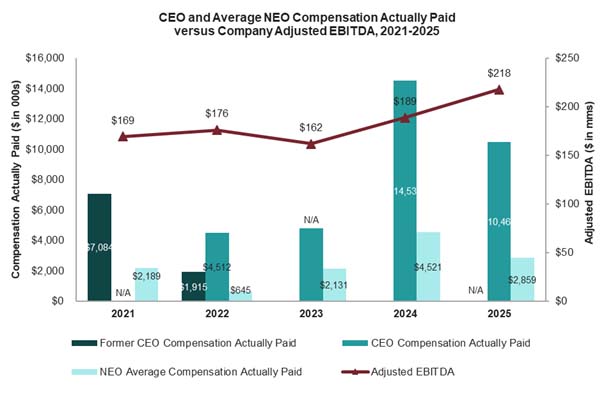
The following chart sets forth the relationship between CAP to our current and former CEO, the average of CAP to our other NEOs, and the Company’s Adjusted EBITDA during fiscal years 2021 through 2025.
TABULAR LIST OF MOST IMPORTANT FINANCIAL PERFORMANCE MEASURES FOR 2025
While Interface Adjusted EBITDA is shown in the pay-versus-performance table above, the following three performance measures are all important and key to the Company’s success. These measures are included in the short and long-term incentive plans to ensure alignment between the goals of the NEOs to the business strategies. The measures in this table are not ranked.
|
Most Important Performance Measures |
|
|
Adjusted EBITDA* |
|
|
Adjusted Operating Income* |
|
|
Currency Neutral Sales* |
|
|
* |
Denotes a non-GAAP financial measure. |