Pay vs Performance Disclosure
Dec. 28, 2024
USD ($)
$ / shares
Dec. 30, 2023
USD ($)
$ / shares
Dec. 31, 2022
USD ($)
$ / shares
Jan. 01, 2022
USD ($)
$ / shares
| Year | Summary Compensation Table Total for PEO (1) | Compensation Actually Paid to PEO (2) | Average Summary Compensation Table Total for Non-PEO Named Executive Officers (1) | Average Compensation Actually Paid to Non-PEO Named Executive Officers (2) | Value of Initial Fixed $100 Investment Based on: | Net Income | Company-Selected Measure (4) | |||||||||||||||||||
| Total Shareholder Return | Peer Group Total Shareholder Return (3) | |||||||||||||||||||||||||
| 2025 | $5,519,261 | $4,393,172 | $1,580,101 | $1,359,961 | $207.33 | $170.39 | $103,681,000 | $9.26 | ||||||||||||||||||
| 2024 | $6,126,562 | $7,985,878 | $1,701,782 | $2,048,942 | $249.89 | $152.76 | $112,554,000 | $10.28 | ||||||||||||||||||
| 2023 | $6,031,798 | $8,891,608 | $1,630,226 | $2,138,678 | $202.20 | $137.97 | $116,806,000 | $10.04 | ||||||||||||||||||
| 2022 | $4,944,998 | $3,320,545 | $1,356,271 | $1,103,554 | $127.42 | $108.69 | $121,730,000 | $9.24 | ||||||||||||||||||
| 2021 | $5,934,170 | $8,960,596 | $1,725,405 | $2,357,145 | $164.41 | $123.74 | $84,881,000 | $7.83 | ||||||||||||||||||
| SCT Amounts | Subtract amounts reported in the "Stock Awards" and "Option Awards" columns in the SCT for applicable FY | YE Value of Current Year Awards Outstanding as of YE | Change in Value as of YE for Prior Year Awards Outstanding as of YE | Change in Value as of Vesting Date for Prior Year Awards that Vested During the Year | Total Adjustments | CAP Amounts | |||||||||||||||||
| CEO | |||||||||||||||||||||||
| 2025 | $5,519,261 | $(3,036,181) | $2,341,555 | $(751,072) | $319,609 | $(1,126,089) | $4,393,172 | ||||||||||||||||
| 2024 | $6,126,562 | $(3,548,532) | $3,856,789 | $879,929 | $671,130 | $1,859,316 | $7,985,878 | ||||||||||||||||
| 2023 | $6,031,798 | $(3,277,818) | $4,263,771 | $1,310,977 | $562,879 | $2,859,809 | $8,891,608 | ||||||||||||||||
| 2022 | $4,944,998 | $(2,031,868) | $1,845,736 | $(951,717) | $(486,604) | $(1,624,453) | $3,320,545 | ||||||||||||||||
| 2021 | $5,934,170 | $(3,070,380) | $4,038,932 | $1,584,393 | $473,481 | $3,026,426 | $8,960,596 | ||||||||||||||||
| Average Other NEOs* | |||||||||||||||||||||||
| 2025 | $1,580,101 | $(596,518) | $459,819 | $(145,833) | $62,392 | $(220,140) | $1,359,961 | ||||||||||||||||
| 2024 | $1,701,782 | $(704,469) | $765,552 | $168,555 | $117,523 | $347,160 | $2,048,942 | ||||||||||||||||
| 2023 | $1,630,226 | $(615,439) | $800,223 | $232,907 | $90,762 | $508,452 | $2,138,678 | ||||||||||||||||
| 2022 | $1,356,271 | $(412,289) | $374,463 | $(141,671) | $(73,220) | $(252,718) | $1,103,554 | ||||||||||||||||
| 2021 | $1,725,405 | $(746,662) | $903,078 | $355,520 | $119,804 | $631,740 | $2,357,145 | ||||||||||||||||
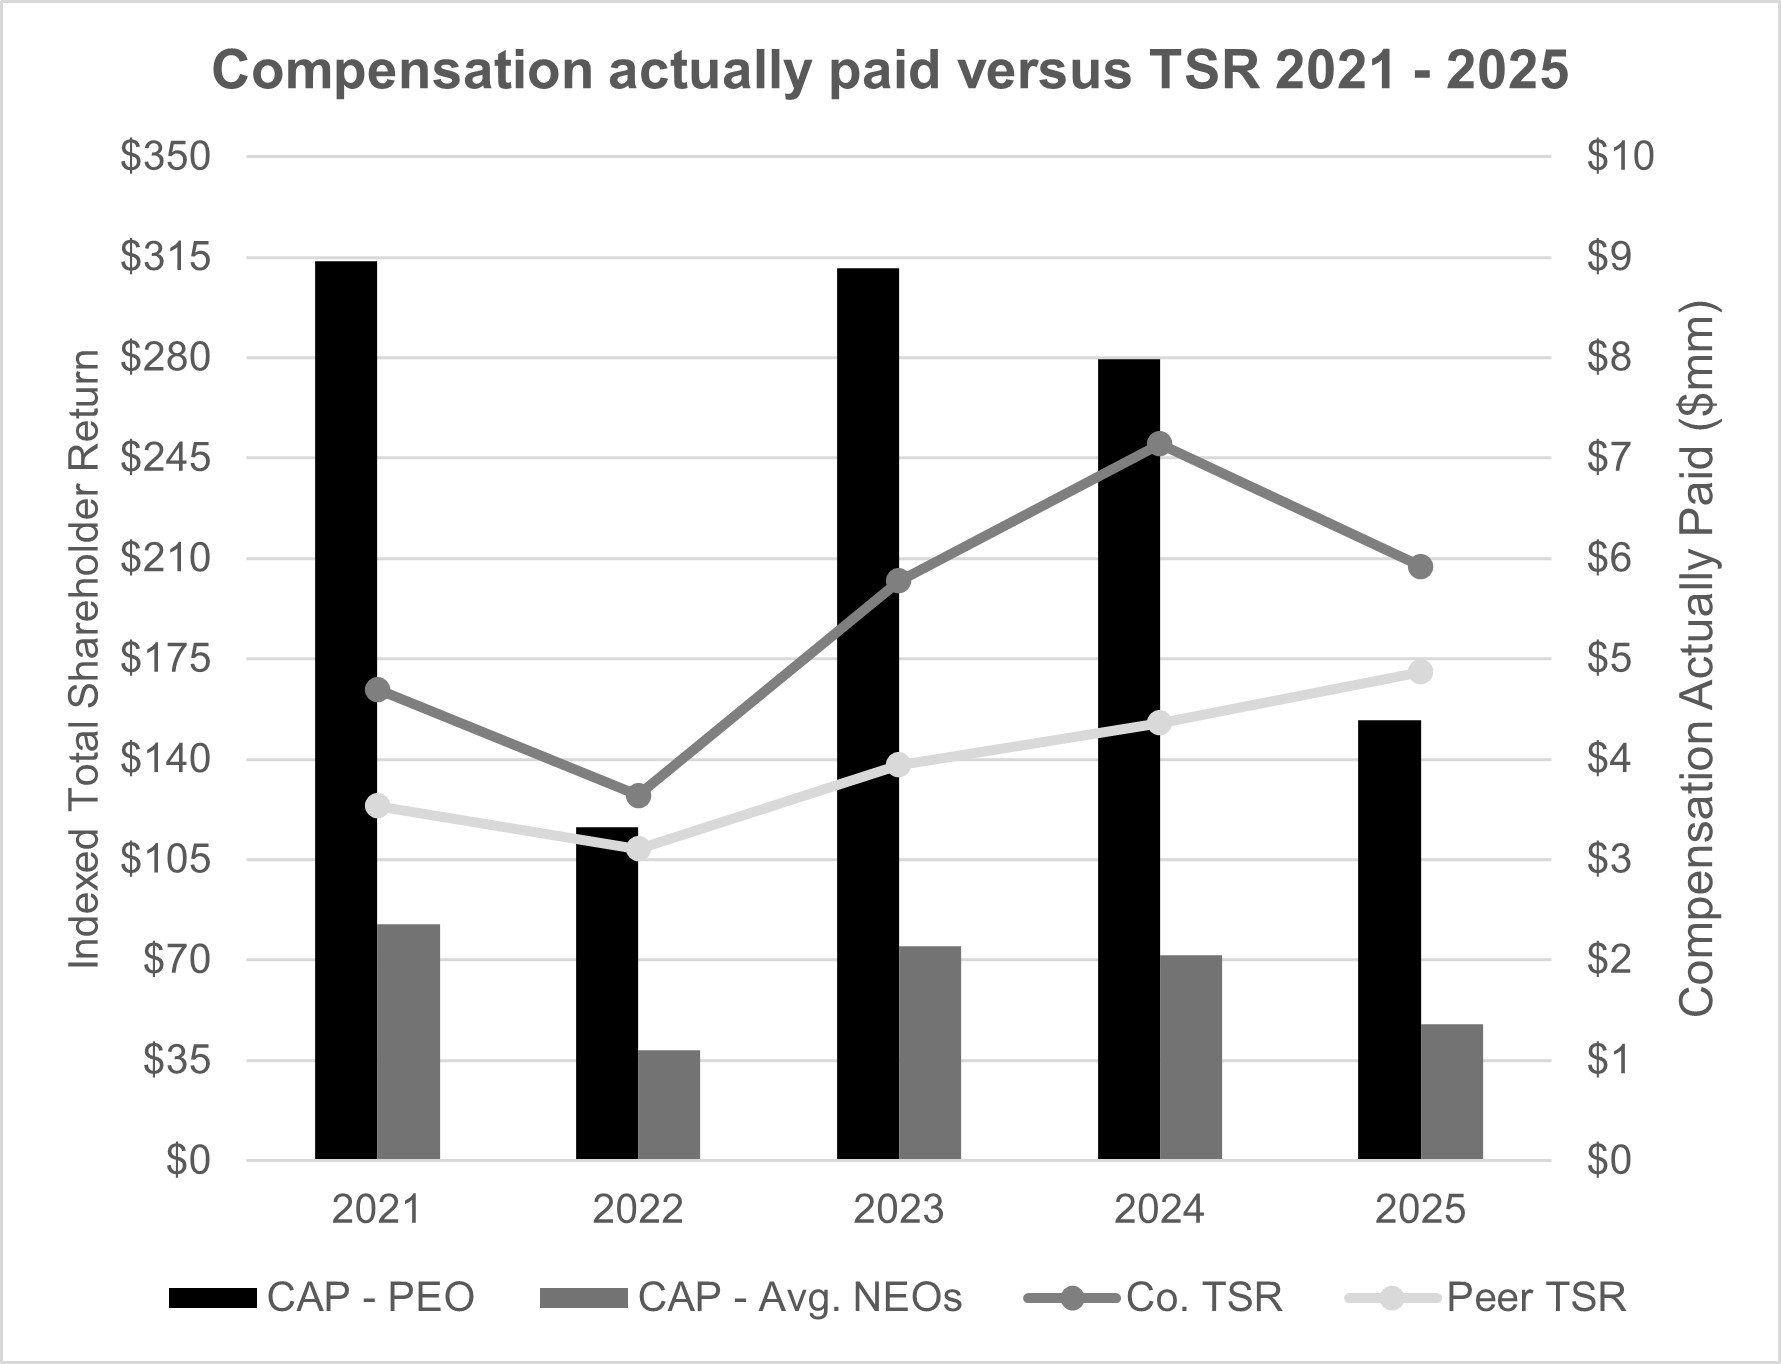
The following charts show graphically the relationships over the past three years of the CAP Amounts for our PEO and Other NEOs as compared to our cumulative total shareholder return (TSR), Peer Group TSR, Net Income and Adjusted Diluted EPS, as well as the relationship between TSR and Peer Group TSR:
 | 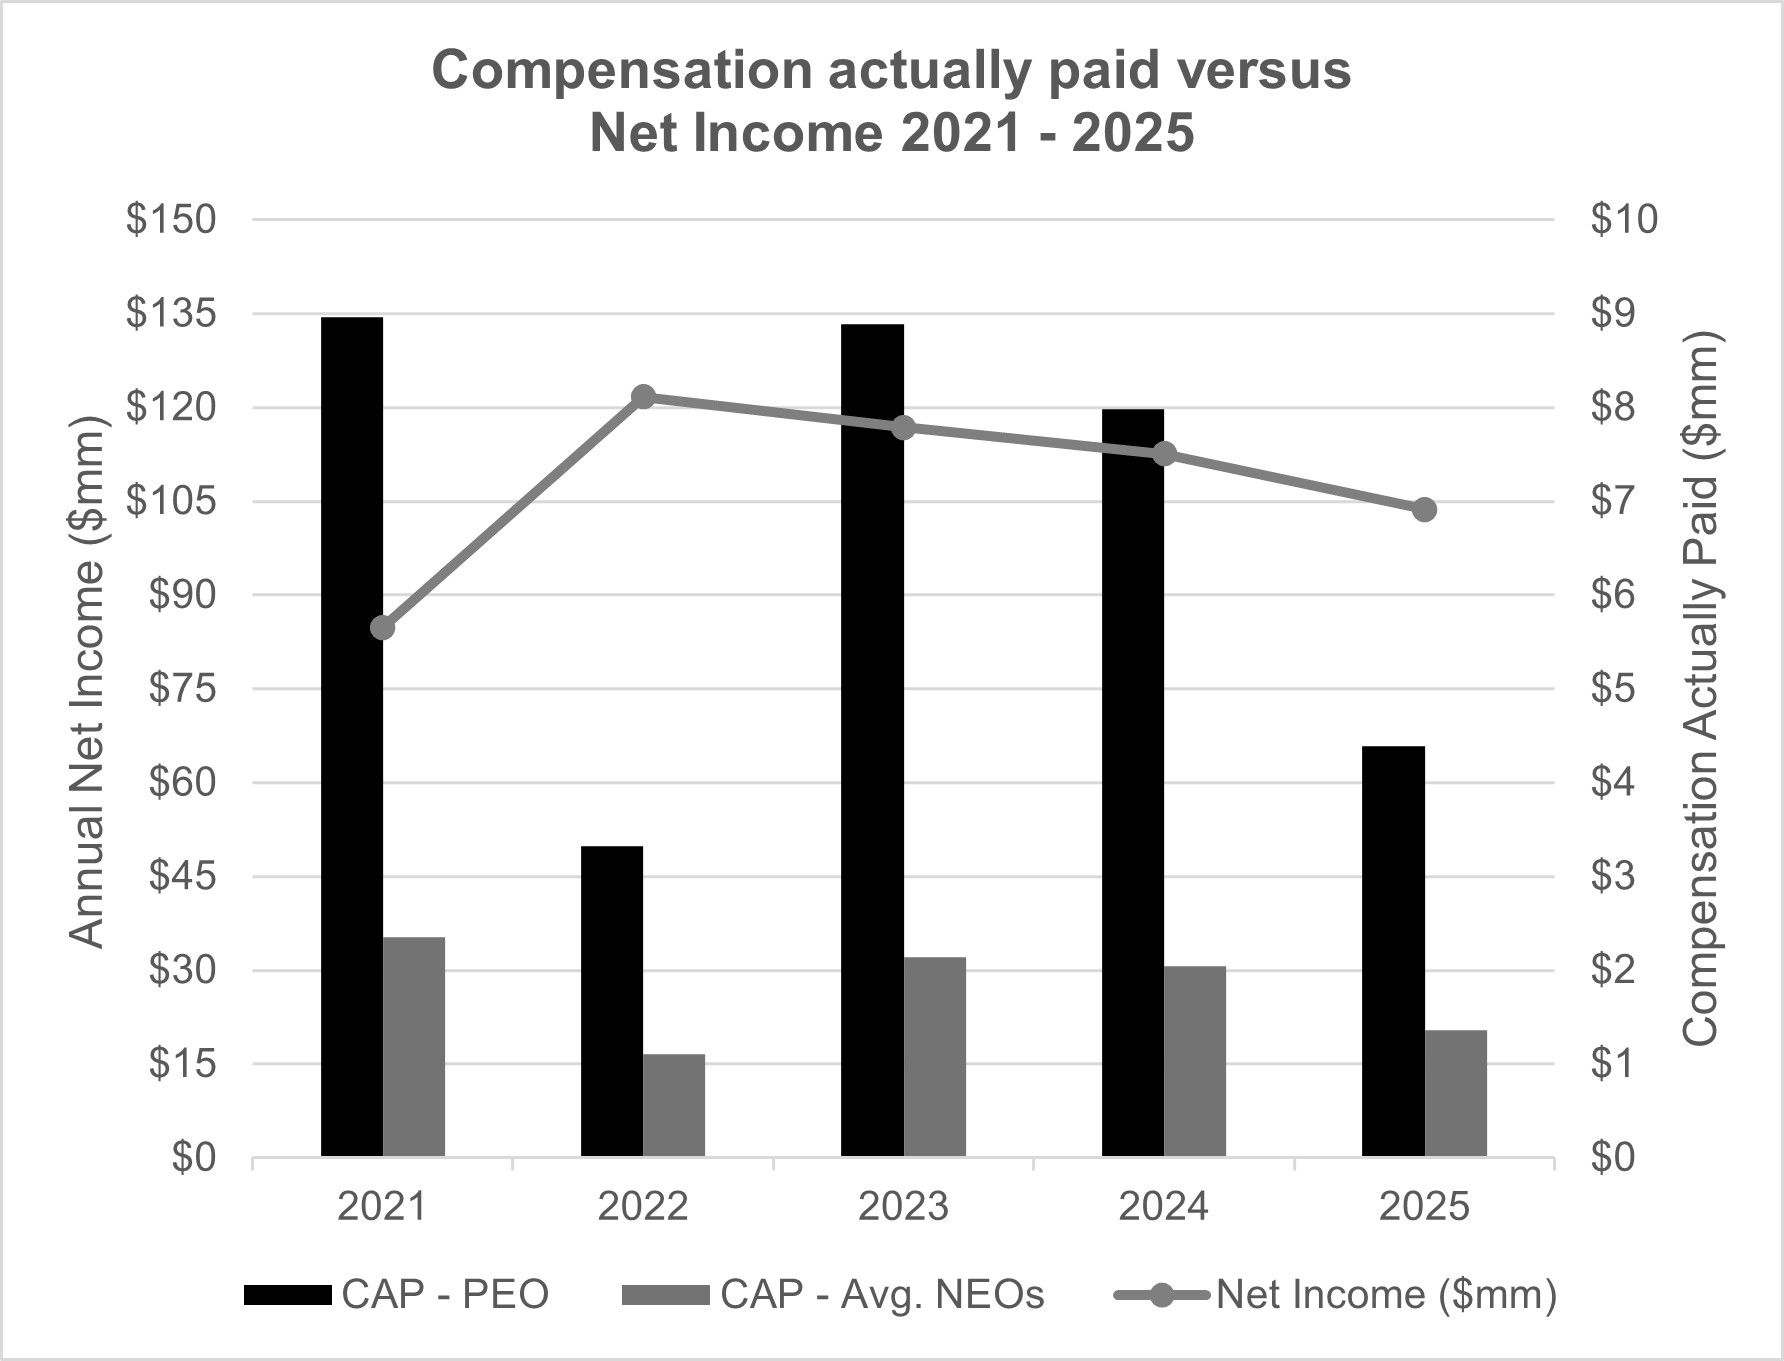 | ||||
The following charts show graphically the relationships over the past three years of the CAP Amounts for our PEO and Other NEOs as compared to our cumulative total shareholder return (TSR), Peer Group TSR, Net Income and Adjusted Diluted EPS, as well as the relationship between TSR and Peer Group TSR:
| | ||||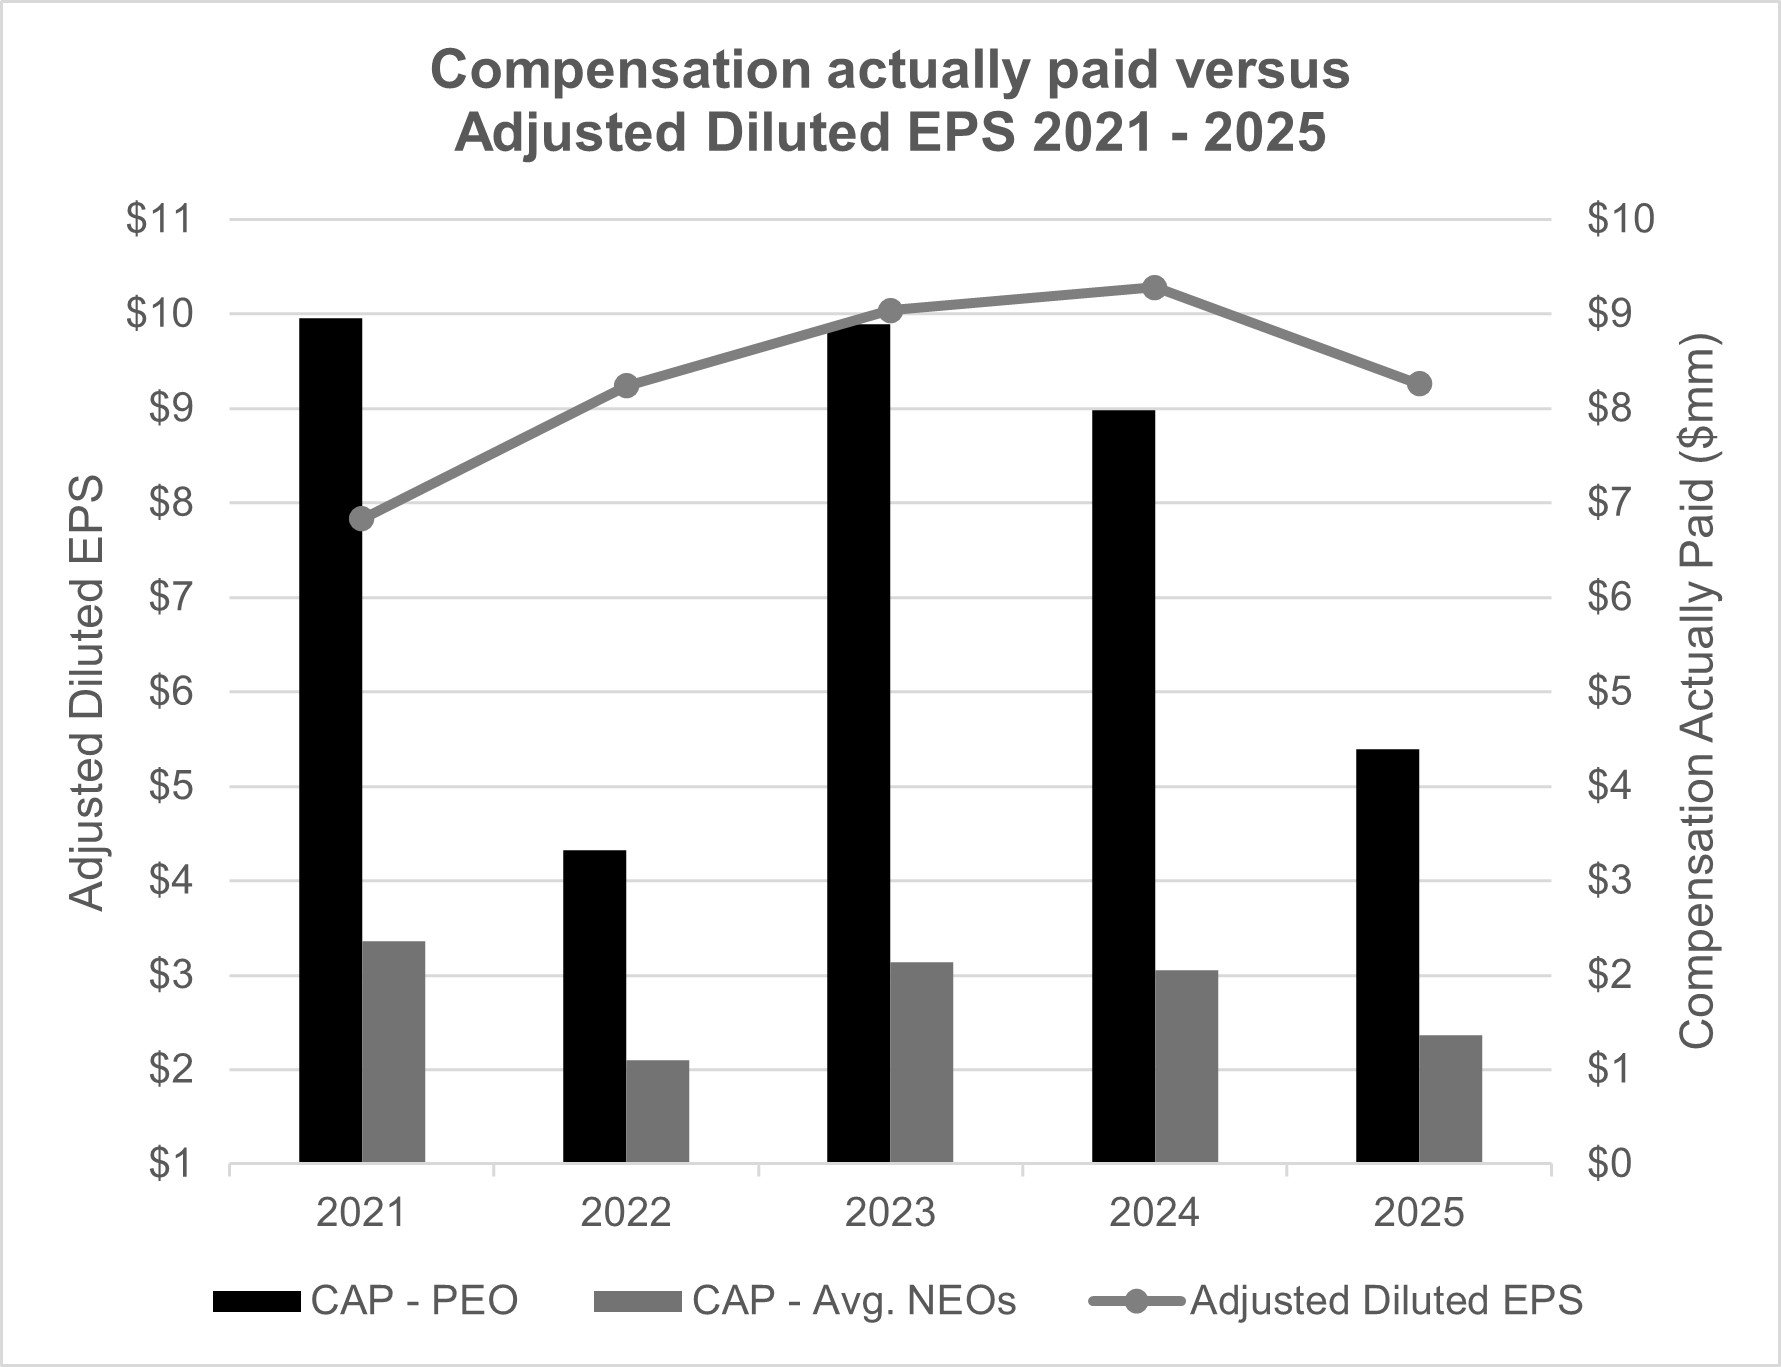
| Adjusted Diluted EPS | ||
| Adjusted Average Return on Shareholders' Equity | ||
| Adjusted EBITDA | ||
Our CAP has largely followed the trend of our TSR and Adjusted Diluted EPS over the past five years. Net Income is not directly used by our compensation committee in determining our executive compensation, however Net Income is the most directly comparable GAAP financial measure used in our calculation of Non-GAAP Adjusted EBITDA. Net Income decreased 4% in 2023 from 2022 due to a $15.1 million after tax gain on the sale of one of our manufacturing facilities in China in 2022 (China Transaction). The gain on sale from the China Transaction was excluded from Adjusted EBITDA and, therefore, was not considered by our compensation committee when determining performance-based compensation for our executives in 2023. In 2024, the relationship between Net Income and CAP stabilized and aligned, with both declining slightly. In 2025, the correlation between Net Income and CAP remained strong. We are pleased with the strong correlation between compensation paid to our executives and our stock price for each of the fiscal years shown. For each of the fiscal years shown, we believe the CAP Amounts for our PEOs and Other NEOs were consistent with the changes in our TSR, peer group TSR and the Company Selected Measures, reflecting the pay-for-performance approach applied by our compensation committee.