Pay vs Performance Disclosure - USD ($)
Aug. 09, 2024
Dec. 31, 2025
Dec. 31, 2024
Dec. 31, 2023
Dec. 31, 2022
Dec. 31, 2021
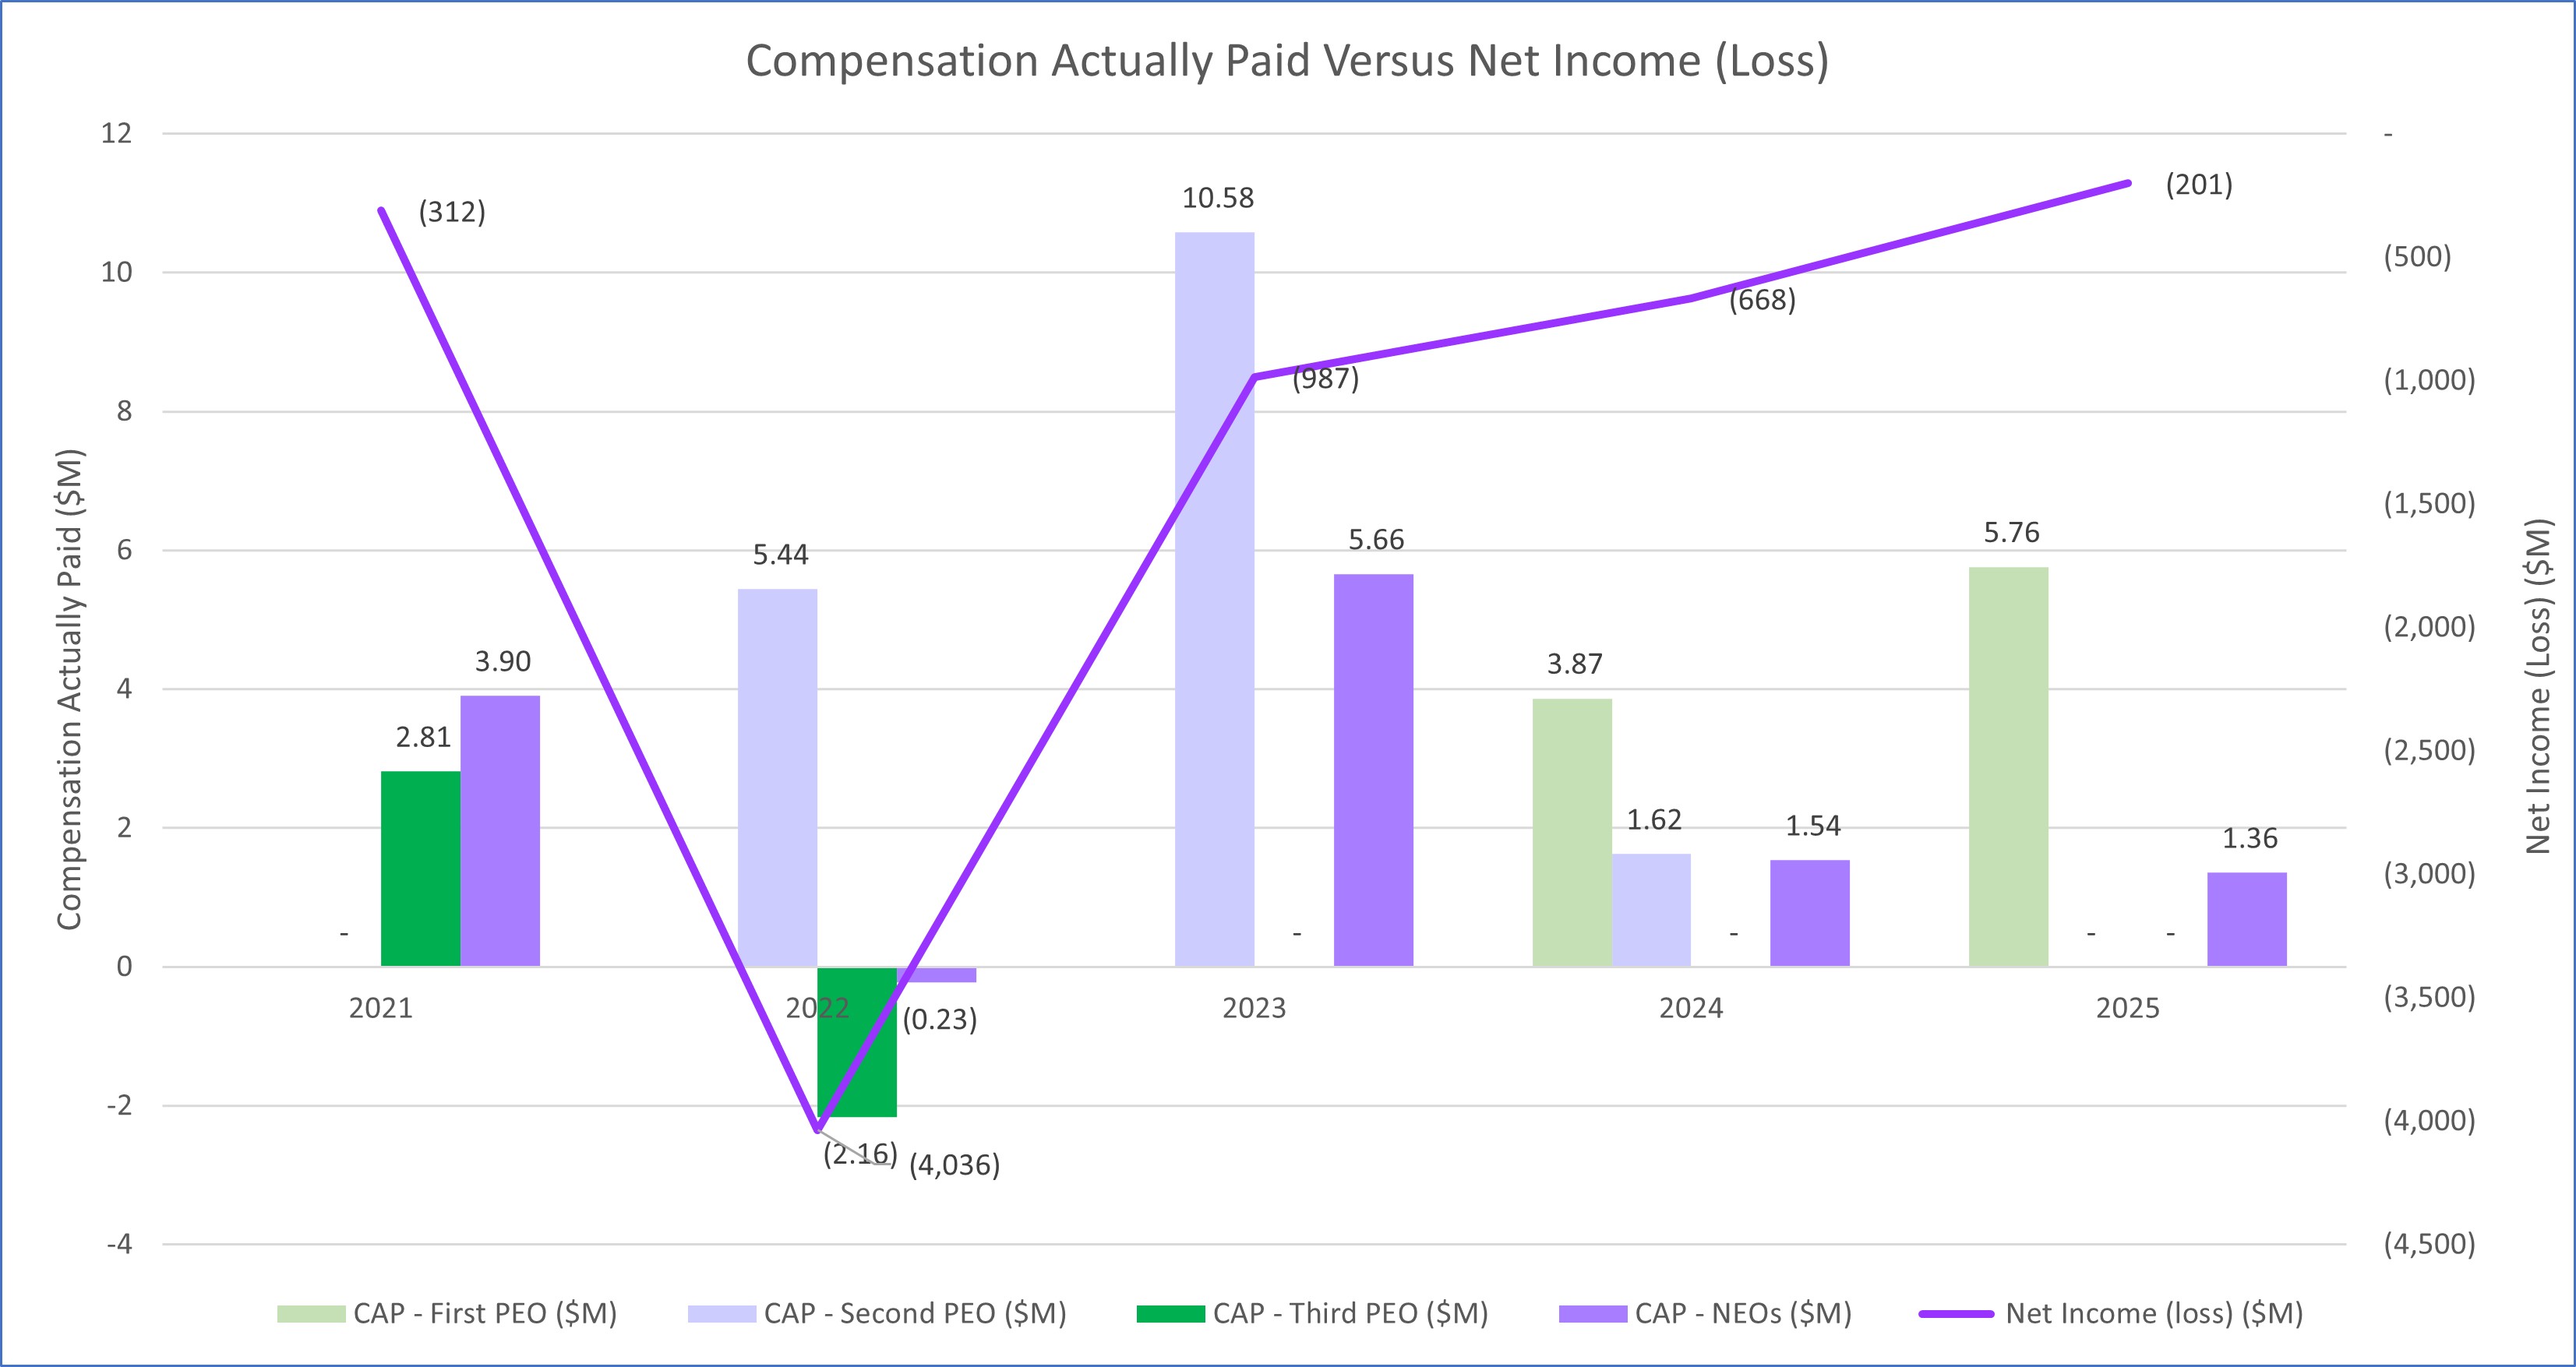
The following table sets forth the compensation for each of our Chief Executive Officers (our “PEOs”) during 2025 and the
average compensation for our other named executive officers, both as reported in the 2025 Summary Compensation
Table and with certain adjustments to reflect the “compensation actually paid” (“CAP”) to such individuals, as defined
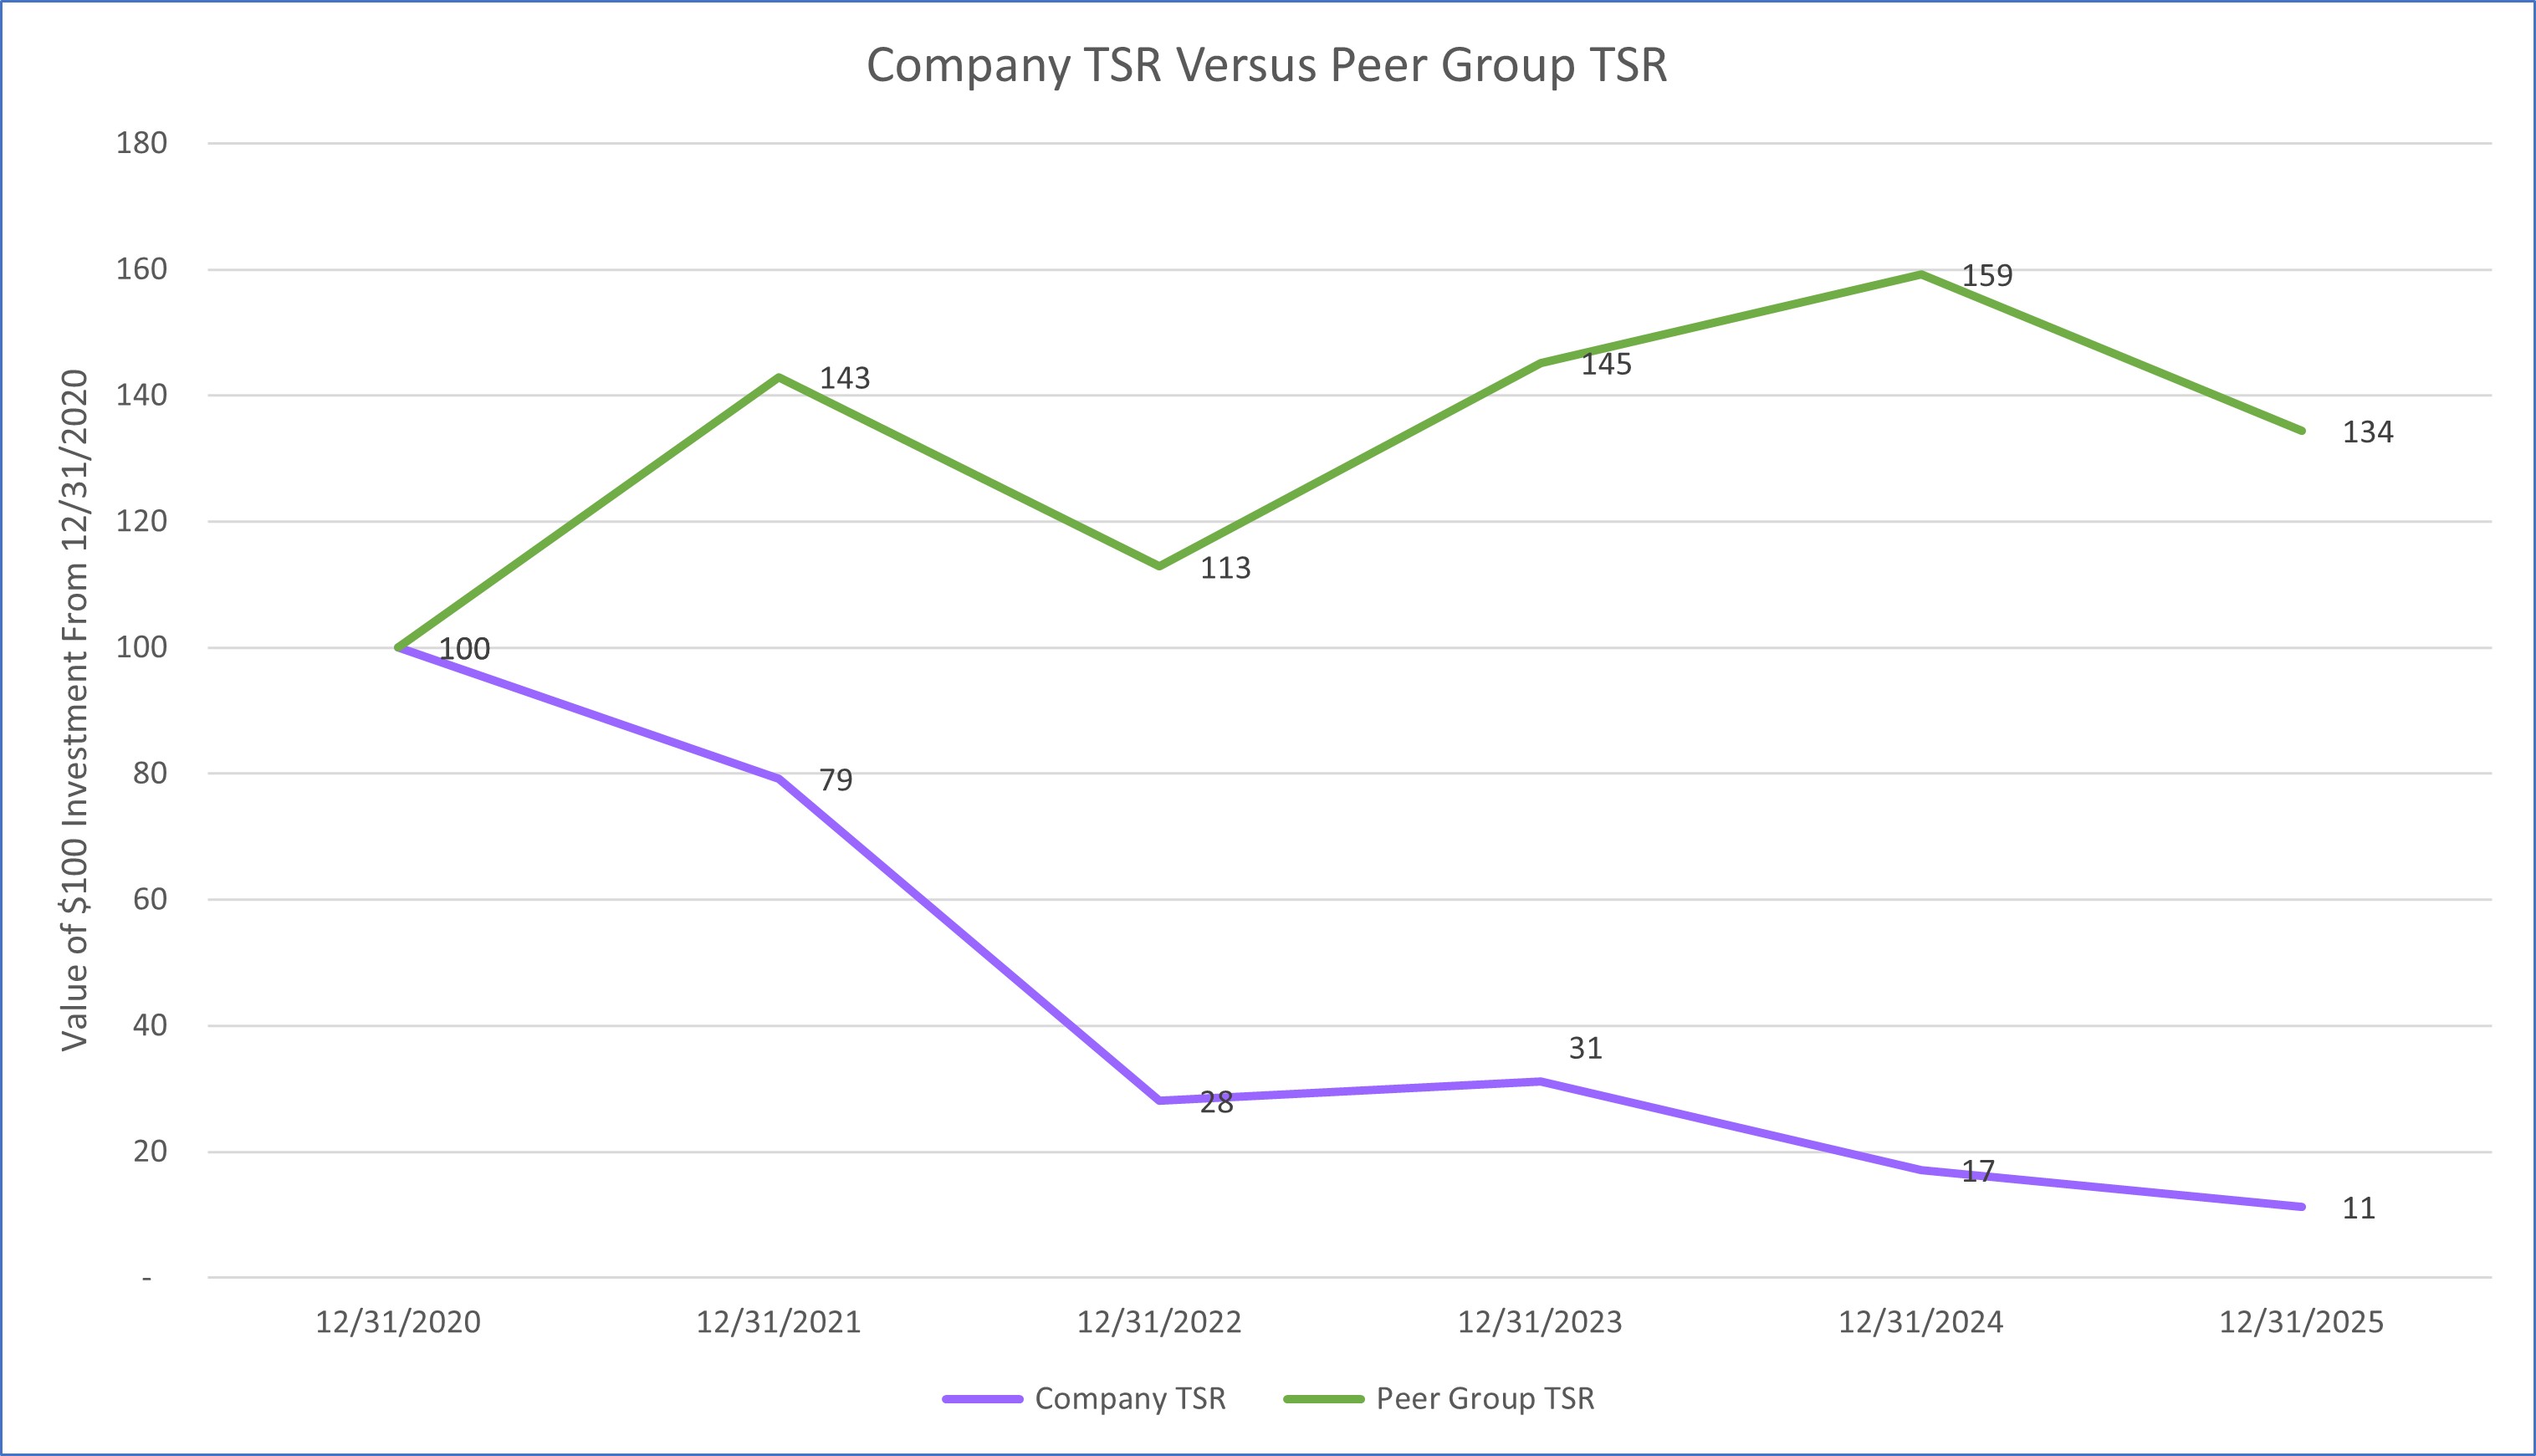
under SEC rules, for each of 2025, 2024, 2023, 2022, and 2021. The table also provides information on our cumulative
TSR, the cumulative TSR of our peer group, Net Income, and Adjusted EBITDA (our Company-selected measure) over
such years in accordance with SEC rules.
Fiscal Year | Summary Compensation Table Total for PEO(1) | Compensation Actually Paid to PEO(5) | Summary Compensation Table Total for Second PEO(1) | Compensation Actually Paid to Second PEO(5) | Summary Compensation Table Total for Third PEO(1) | Compensation Actually Paid to Third PEO(5) | Average Summary Compensation Table Total for Non-PEO NEOs(2) | Average Compensation Actually Paid to Non-PEO NEOs(5) | Value of Initial Fixed $100 Investment Based On: | Net Income/ (Loss)(4) (in millions) | Adjusted EBITDA (in millions) | ||
Total Shareholder Return | Peer Group Total Shareholder Return(3) | ||||||||||||
2025 | 8,350,984 | 5,761,746 | N/A | N/A | N/A | N/A | 3,620,536 | 1,356,654 | 11.24 | 134.41 | (201.1) | 1,001.8 | |
2024 | 4,844,251 | 3,866,509 | 21,865,641 | 1,623,752 | N/A | N/A | 4,596,255 | 1,535,438 | 17.10 | 159.23 | (668.0) | 1,060.4 | |
2023 | N/A | N/A | 12,478,373 | 10,579,394 | N/A | N/A | 5,681,364 | 5,657,407 | 31.17 | 145.19 | (986.6) | 1,117.2 | |
2022 | N/A | N/A | 8,375,608 | 5,440,653 | 4,538,176 | (2,164,082) | 2,644,643 | (226,698) | 28.07 | 112.84 | (4,035.6) | 1,112.7 | |
2021 | N/A | N/A | N/A | N/A | 5,319,950 | 2,813,040 | 4,404,432 | 3,903,063 | 79.17 | 142.95 | (312.0) | 800.4 | |
(1)The PEO is Matti Shem Tov, the second PEO is Jonathan Gear, and the third PEO is Jerre Stead. Mr. Stead was Chairman Emeritus of the Board
from October 21, 2022 to May 7, 2025, and received no compensation for this position.
(2)The 2025 non-PEO NEOs are Jonathan Collins, Bar Veinstein, Henry Levy, Maroun Mourad, Gordon Samson, and Melanie Margolin. The 2024 and
2023 non-PEO NEOs are Jonathan Collins, Bar Veinstein, Henry Levy, and Gordon Samson. The 2022 non-PEO NEOs are Jonathan Collins,
Steen Lomholt-Thomsen, Gordon Samson, and Stefano Maestri. The 2021 non-PEO NEOs are Jonathan Collins, Steen Lomholt-Thomsen, Gordon
Samson, Mukhtar Ahmed, Richard Hanks, and Jeff Roy.
(3)Our TSR peer group is the peer group used for purposes of the “stock performance graph” in Clarivate’s Annual Report on Form 10-K and consists
of the following companies: FactSet Research Systems Inc.; Gartner Inc.; Moody’s Corporation; MSCI Inc.; S&P Global Inc.; and Verisk Analytics,
Inc.
(4)Our 2025, 2024, 2023 and 2022 net income (loss) attributable to ordinary shares, as reported under U.S. GAAP, includes goodwill and intangible
asset impairments of $15.0 million, $540.7 million, $979.9 million and $4,449.1 million, respectively.
(5)The following tables show what adjustments were made to the summary compensation table total to calculate CAP for 2025. We paid no dividends
during 2025, and thus no adjustments were made on account of dividend payments. CAP does not reflect the actual amount of compensation
earned by or paid to the PEOs and our other NEOs during the applicable year. For information regarding the decisions made by our HRCC in
regard to the PEOs’ and our other NEOs’ compensation for 2025, see “Compensation Discussion and Analysis,” above.
Fiscal Year | Summary Compensation Table Total for First PEO | Exclusion of Stock Awards & Option Awards | Year-End Fair Value of Unvested Equity Granted During the Current Year (a) | Change in Fair Value of Prior Awards That Vested During the Current Year (b) | Change in Fair Value of Prior Awards That Remained Unvested at End of Current Year (c) | Fair Value at Vest of Awards Granted and Vested During the Current Year (d) | Prior Year-End Fair Value of Prior Awards That Forfeited During the Current Year (e) | Inclusion of Equity Values (a) + (b) + (c) + (d) - (e) | Compensation Actually Paid to First PEO |
2025 | 8,350,984 | (6,399,514) | 4,910,410 | (143,279) | (956,855) | — | — | 3,810,276 | 5,761,746 |
Fiscal Year | Summary Compensation Table Total for Non-PEO NEOs | Exclusion of Stock Awards & Option Awards | Year-End Fair Value of Unvested Equity Granted During the Current Year (a) | Change in Fair Value of Prior Awards That Vested During the Current Year (b) | Change in Fair Value of Prior Awards That Remained Unvested at End of Current Year (c) | Fair Value at Vest of Awards Granted and Vested During the Current Year (d) | Prior Year-End Fair Value of Prior Awards That Forfeited During the Current Year (e) | Inclusion of Equity Values (a) + (b) + (c) + (d) - (e) | Compensation Actually Paid to Non-PEO NEOs |
2025 | 3,620,536 | (2,394,170) | 1,186,959 | (335,417) | (441,022) | 90,664 | 370,896 | 130,288 | 1,356,654 |
from October 21, 2022 to May 7, 2025, and received no compensation for this position.
(2)The 2025 non-PEO NEOs are Jonathan Collins, Bar Veinstein, Henry Levy, Maroun Mourad, Gordon Samson, and Melanie Margolin. The 2024 and
2023 non-PEO NEOs are Jonathan Collins, Bar Veinstein, Henry Levy, and Gordon Samson. The 2022 non-PEO NEOs are Jonathan Collins,
Steen Lomholt-Thomsen, Gordon Samson, and Stefano Maestri. The 2021 non-PEO NEOs are Jonathan Collins, Steen Lomholt-Thomsen, Gordon
Samson, Mukhtar Ahmed, Richard Hanks, and Jeff Roy.
of the following companies: FactSet Research Systems Inc.; Gartner Inc.; Moody’s Corporation; MSCI Inc.; S&P Global Inc.; and Verisk Analytics,
Inc.
during 2025, and thus no adjustments were made on account of dividend payments. CAP does not reflect the actual amount of compensation
earned by or paid to the PEOs and our other NEOs during the applicable year. For information regarding the decisions made by our HRCC in
regard to the PEOs’ and our other NEOs’ compensation for 2025, see “Compensation Discussion and Analysis,” above.
Fiscal Year | Summary Compensation Table Total for First PEO | Exclusion of Stock Awards & Option Awards | Year-End Fair Value of Unvested Equity Granted During the Current Year (a) | Change in Fair Value of Prior Awards That Vested During the Current Year (b) | Change in Fair Value of Prior Awards That Remained Unvested at End of Current Year (c) | Fair Value at Vest of Awards Granted and Vested During the Current Year (d) | Prior Year-End Fair Value of Prior Awards That Forfeited During the Current Year (e) | Inclusion of Equity Values (a) + (b) + (c) + (d) - (e) | Compensation Actually Paid to First PEO |
2025 | 8,350,984 | (6,399,514) | 4,910,410 | (143,279) | (956,855) | — | — | 3,810,276 | 5,761,746 |
during 2025, and thus no adjustments were made on account of dividend payments. CAP does not reflect the actual amount of compensation
earned by or paid to the PEOs and our other NEOs during the applicable year. For information regarding the decisions made by our HRCC in
regard to the PEOs’ and our other NEOs’ compensation for 2025, see “Compensation Discussion and Analysis,” above.
Fiscal Year | Summary Compensation Table Total for Non-PEO NEOs | Exclusion of Stock Awards & Option Awards | Year-End Fair Value of Unvested Equity Granted During the Current Year (a) | Change in Fair Value of Prior Awards That Vested During the Current Year (b) | Change in Fair Value of Prior Awards That Remained Unvested at End of Current Year (c) | Fair Value at Vest of Awards Granted and Vested During the Current Year (d) | Prior Year-End Fair Value of Prior Awards That Forfeited During the Current Year (e) | Inclusion of Equity Values (a) + (b) + (c) + (d) - (e) | Compensation Actually Paid to Non-PEO NEOs |
2025 | 3,620,536 | (2,394,170) | 1,186,959 | (335,417) | (441,022) | 90,664 | 370,896 | 130,288 | 1,356,654 |
measures used to link CAP to our NEOs to Company performance in the most recently completed fiscal year:
vRecurring organic revenue growth
vRevenue
vFree cash flow
vAdjusted EBITDA
vAdjusted diluted EPS
vRelative TSR