Pay vs Performance Disclosure - USD ($)
Sep. 27, 2025
Sep. 28, 2024
Sep. 30, 2023
Sep. 24, 2022
Sep. 25, 2021
Pay Versus Performance
In accordance with rules adopted by the Securities and Exchange Commission pursuant to the Dodd-Frank Wall Street Reform and Consumer Protection Act of 2010, and Item 402(v) of Regulation S-K, we are providing the following disclosure regarding executive compensation and Company performance for the years listed below. The Compensation Committee did not consider the pay versus performance disclosure below in making its pay decisions for any of the years shown.
Value of Initial Fixed $100 Investment Based on(3) | ||||||||||||||||||||||||
Year | Summary Compensation Table Total for PEO(1) | Compensation Actually Paid to PEO(2) | Average Summary Compensation Table Total for Non-PEO NEOs(1) | Average Compensation Actually Paid to Non-PEO NEOs(2) | Total Shareholder Return | Peer-Group Total Shareholder Return | Net Income ($000s) | Net Sales ($000s) | ||||||||||||||||
2025 | $3,130,472 | $3,130,472 | $2,897,174 | $2,897,174 | $198 | $195 | $83,593 | $5,334,033 | ||||||||||||||||
2024 | $3,132,883 | $3,132,883 | $2,867,166 | $2,867,166 | $212 | $168 | $105,541 | $5,639,609 | ||||||||||||||||
2023 | $3,290,980 | $3,290,980 | $3,045,314 | $3,045,314 | $213 | $131 | $210,812 | $5,892,782 | ||||||||||||||||
2022 | $2,505,366 | $2,505,366 | $1,753,173 | $1,753,173 | $229 | $117 | $272,759 | $5,678,835 | ||||||||||||||||
2021 | $2,124,670 | $2,124,670 | $1,583,027 | $1,583,027 | $182 | $118 | $249,731 | $4,987,920 | ||||||||||||||||
(1) | The amounts reflect the Summary Compensation Table total compensation figures for James W. Lanning, our principal executive officer (“PEO”), for each of the years listed. The Non-PEO NEOs (named executive officers) for who the Summary Compensation Table total average compensation is presented are: for 2025, 2024 and 2023, Robert P. Ingle, Patricia E. Jackson, and Michael D. Hogan; for 2022, Robert P. Ingle, Patricia E. Jackson, Ronald B. Freeman, and Larry K. Collins; for 2021, Robert P. Ingle, Ronald B. Freeman, and Larry K. Collins. |
(2) | The amounts shown for Compensation Actually Paid and Average Compensation Actually Paid to Non-PEO NEOs have been calculated in accordance with Item 402(v) of Regulation S-K. These amounts reflect total compensation as set forth in the Summary Compensation Table above for each year. None of the adjustments required by Item 402(v) are applicable to the Company. |
(3) | This column shows Company Total Shareholder Return (“TSR”) and peer group TSR on a cumulative basis for each year of the five-year period from 2021 through 2025. For purposes of this disclosure, the peer group consists of the peer group used for our stock performance graph, as presented in Item 5 of the Company’s Annual Report on Form 10K for the fiscal year ended September 27, 2025. The companies making up the peer group, in no particular order, are Ingles Markets, Inc., Koninklijke Ahold Delhaize N.V., Weis Markets, Inc., The Kroger Co., SpartanNash Co., Sprouts Farmers Markets, Inc., and Village Super Market, Inc. Dollar values assume $100 was invested for the cumulative period from September 25, 2021 to September 27, 2025, in either the Company or the peer group, and reinvestment of the pre-tax value of dividends paid. Historical stock performance is not necessarily indicative of future stock performance. |
(1) | The amounts reflect the Summary Compensation Table total compensation figures for James W. Lanning, our principal executive officer (“PEO”), for each of the years listed. The Non-PEO NEOs (named executive officers) for who the Summary Compensation Table total average compensation is presented are: for 2025, 2024 and 2023, Robert P. Ingle, Patricia E. Jackson, and Michael D. Hogan; for 2022, Robert P. Ingle, Patricia E. Jackson, Ronald B. Freeman, and Larry K. Collins; for 2021, Robert P. Ingle, Ronald B. Freeman, and Larry K. Collins. |
(3) | This column shows Company Total Shareholder Return (“TSR”) and peer group TSR on a cumulative basis for each year of the five-year period from 2021 through 2025. For purposes of this disclosure, the peer group consists of the peer group used for our stock performance graph, as presented in Item 5 of the Company’s Annual Report on Form 10K for the fiscal year ended September 27, 2025. The companies making up the peer group, in no particular order, are Ingles Markets, Inc., Koninklijke Ahold Delhaize N.V., Weis Markets, Inc., The Kroger Co., SpartanNash Co., Sprouts Farmers Markets, Inc., and Village Super Market, Inc. Dollar values assume $100 was invested for the cumulative period from September 25, 2021 to September 27, 2025, in either the Company or the peer group, and reinvestment of the pre-tax value of dividends paid. Historical stock performance is not necessarily indicative of future stock performance. |
(2) | The amounts shown for Compensation Actually Paid and Average Compensation Actually Paid to Non-PEO NEOs have been calculated in accordance with Item 402(v) of Regulation S-K. These amounts reflect total compensation as set forth in the Summary Compensation Table above for each year. None of the adjustments required by Item 402(v) are applicable to the Company. |
(2) | The amounts shown for Compensation Actually Paid and Average Compensation Actually Paid to Non-PEO NEOs have been calculated in accordance with Item 402(v) of Regulation S-K. These amounts reflect total compensation as set forth in the Summary Compensation Table above for each year. None of the adjustments required by Item 402(v) are applicable to the Company. |
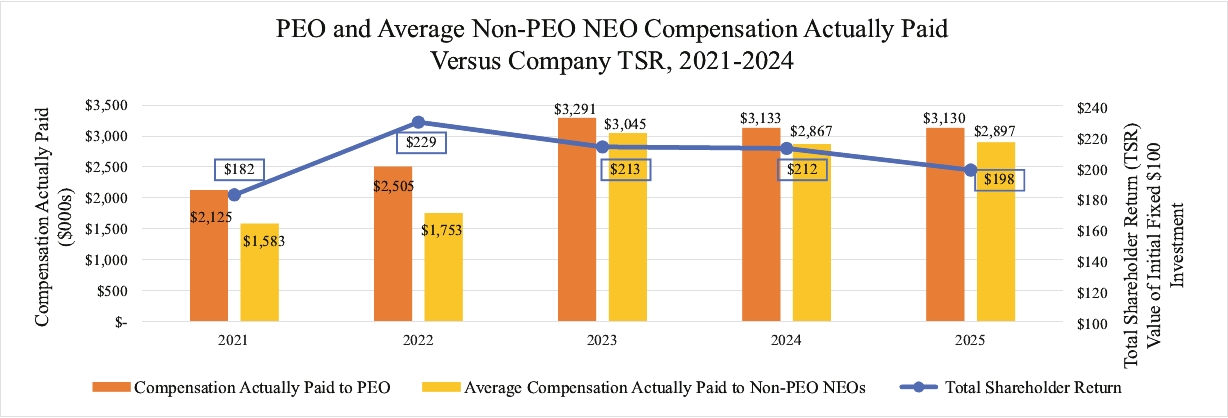
Relationship Between Compensation Actually Paid and Company Cumulative Total Shareholder Return (TSR).
The following chart sets forth the relationship between Compensation Actually Paid to our PEO, the Average Compensation Actually Paid to Non-PEO NEOs, and the Company Cumulative TSR for each year of the five-year period from 2021 through 2025.
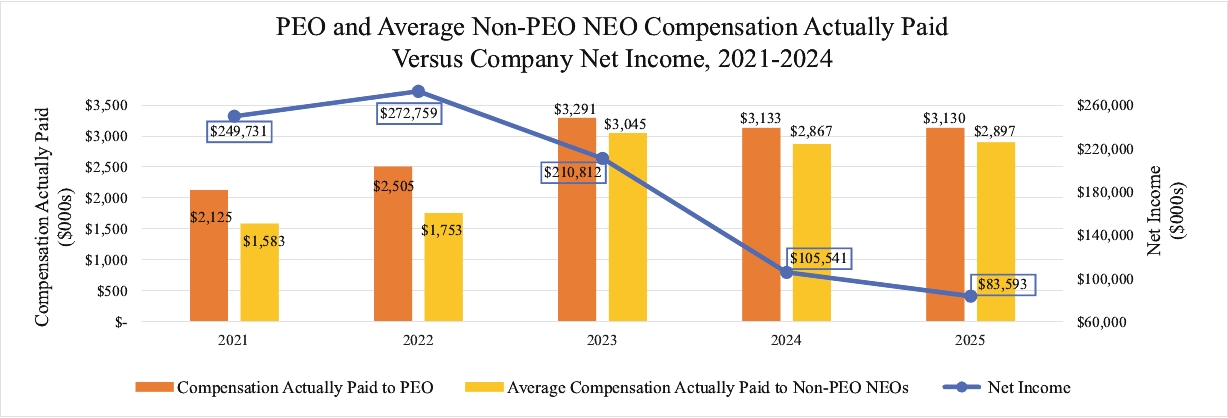
Relationship Between Compensation Actually Paid and Company Net Income.
The following charts sets forth the relationship between Compensation Actually Paid to our PEO, the average of Compensation Actually Paid to Non-PEO NEOs, and Company Net Income for each year of the five-year period from 2021 to 2025.
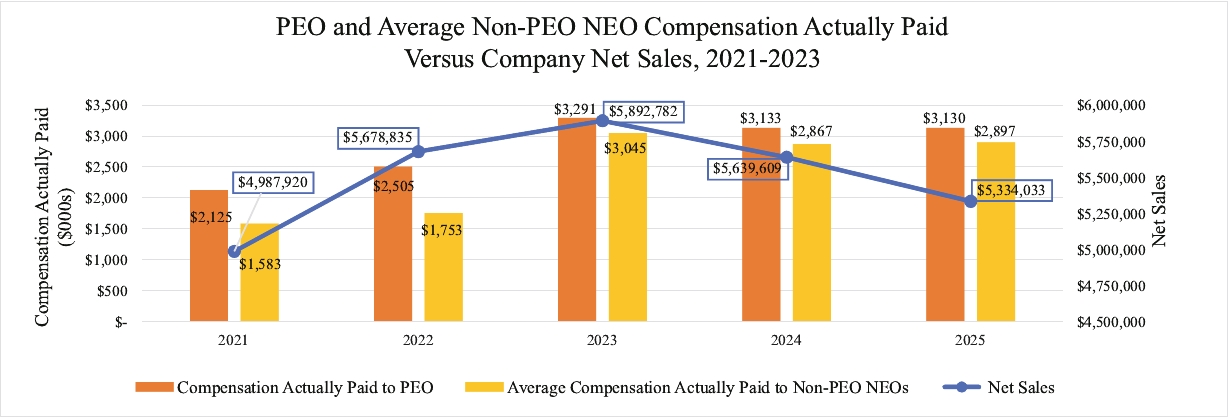
Relationship Between Compensation Actually Paid and Company Net Sales.
The following charts sets forth the relationship between Compensation Actually Paid to our PEO, the average of Compensation Actually Paid to Non-PEO NEOs, and Company Net Sales for each year of the five-year period from 2021 to 2025.
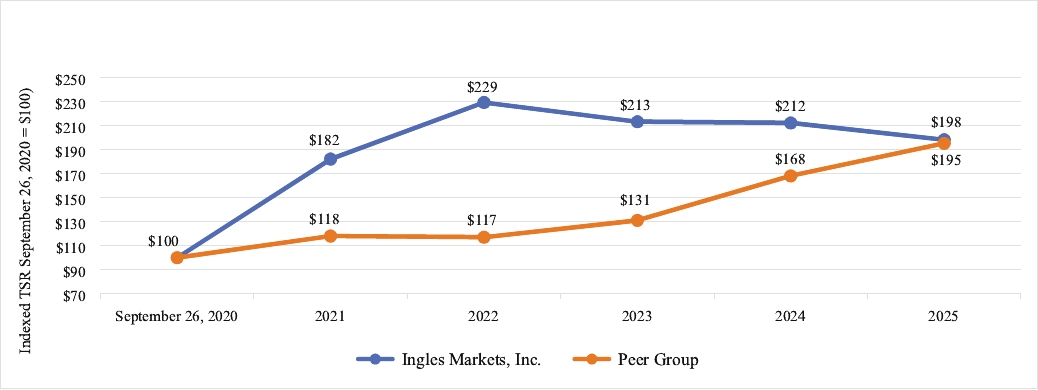
Relationship Between Company TSR and Peer Group TSR.
The following chart sets forth the relationship between our cumulative TSR and the TSR for the peer group for each year of the five-year period from 2021 through 2025.