Value of Initial Fixed $100 | ||||||||||||||||
Investment Based On: | ||||||||||||||||
Average | ||||||||||||||||
| Summary | Summary | Average | S&P 600 | ||||||||||||
Compensation | | Compensation | | Compensation | | Compensation | Small Cap | | ||||||||
Table Total | Actually Paid | Table Total for | Actually Paid | | Company | | Financials | | Net | Earnings | ||||||
for PEO | to PEO | Other NEOs | to Other NEOs | TSR | TSR | Income | per Share | |||||||||
Year | ($) | ($)(1) | ($) | ($)(1) | ($)(2) | ($)(2) | ($mm) | ($) | ||||||||
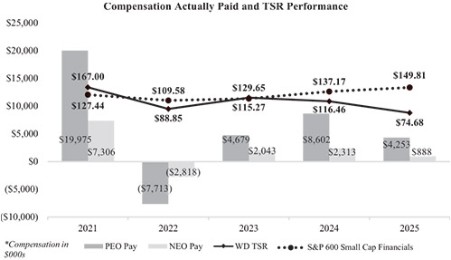
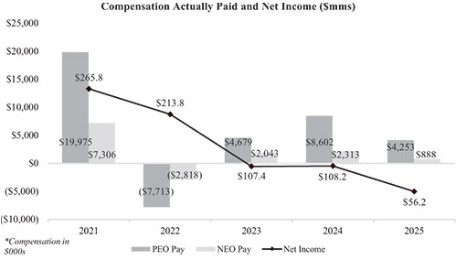
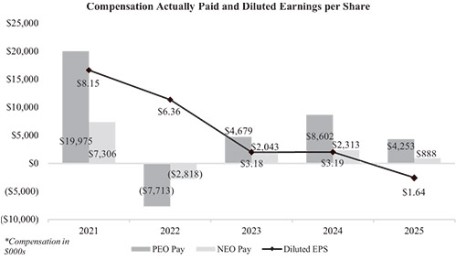
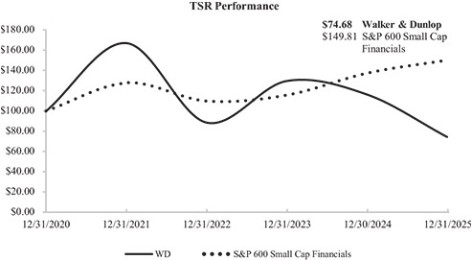
2025 | 15,500,252 | 4,252,992 | 2,139,390 | 887,760 | 74.68 | 149.81 | 56.25 | 1.64 | ||||||||
2024 |
| 7,575,160 | 8,601,703 | 2,256,593 | 2,312,669 | 116.46 | 137.17 | 108.17 | 3.19 | |||||||
2023 |
| 4,821,113 | 4,679,223 | 2,033,001 | 2,042,895 | 129.65 | 115.27 | 107.36 | 3.18 | |||||||
2022 | 4,775,116 | (7,712,630) | 1,899,621 | (2,818,053) | 88.85 | 109.58 | 213.82 | 6.36 | ||||||||
2021 | 7,558,968 |
| 19,975,036 |
| 2,928,087 |
| 7,305,891 |
| 167.00 |
| 127.44 |
| 265.76 |
| 8.15 | |
| (1) | Amounts represent compensation actually paid to our PEO and the average compensation actually paid to our remaining NEOs for the relevant fiscal year, as determined under SEC rules (and described below), which includes the individuals indicated in the table below for each fiscal year: |
Year | | PEO | | Non-PEO NEOs |
2025 | William M. Walker | Gregory A. Florkowski, Stephen P. Theobald, Daniel J. Groman and Paula A. Pryor | ||
2024 | William M. Walker | Gregory A. Florkowski, Stephen P. Theobald, Daniel J. Groman and Paula A. Pryor | ||
2023 | William M. Walker | Gregory A. Florkowski, Howard W. Smith, Stephen P. Theobald, and Richard M. Lucas | ||
2022 | William M. Walker | Gregory A. Florkowski, Howard W. Smith, Stephen P. Theobald, Richard M. Lucas and Paula A. Pryor | ||
2021 | William M. Walker | Stephen P. Theobald, Howard W. Smith, Richard M. Lucas and Paula A. Pryor |
Fair value or change in fair value, as applicable, of equity awards in the “Compensation Actually Paid” columns was determined based on the stock price at the end of each fiscal year taking into account the probable outcome as of the end of the year for outstanding performance awards, as follows:
For the fiscal year ending December 31, 2021, represents actual achievement for the 2019 performance awards, achievement of maximum performance level for EPS and revenue and target performance level for ROE for the 2020
performance awards, and assumes the achievement of threshold performance level for EPS, target performance level for revenue and ROE, and no achievement under the TSR outperformance component for the 2021 performance award.
For the fiscal year ending December 31, 2022, represents actual achievement for the 2020 performance awards, assumes the achievement of a below-threshold performance level for EPS, target performance level for revenue, threshold performance level for ROE and no achievement under the TSR outperformance component for the 2021 performance awards, and assumes the achievement of a below-threshold performance level for EPS and ROE, threshold performance level for revenue and no achievement under the TSR outperformance component for the 2022 performance award.
For the fiscal year ending December 31, 2023, represents actual achievement for the 2021 performance awards, and assumes the achievement of a below-threshold performance level for EPS, revenue, and ROE and no achievement under the TSR outperformance component for the 2022 and 2023 performance awards.
For the fiscal year ending December 31, 2024, represents actual achievement for the 2022 performance awards, and assumes the achievement of a below-threshold performance level for EPS, revenue, and ROE and no achievement under the TSR outperformance component for the 2023 performance awards, and assumes the achievement of target performance level for EPS and revenue, and threshold performance level for ROE and no achievement under the TSR outperformance component for the 2024 performance awards.
For the fiscal year ending December 31, 2025, represents actual achievement for the 2023 performance awards, and assumes the achievement of a below-threshold performance level for EPS and ROE, between threshold and target performance level for revenue and no achievement under the TSR outperformance component for the 2024 performance awards, and assumes the achievement of threshold performance level for EPS, between threshold and target performance level for revenue, below-threshold performance level for ROE and no achievement under the TSR outperformance component for the 2025 performance awards. For the Value Creation Award, while no payouts are currently expected to be earned under this award, the fair value represents the estimated value based on future performance of the Company calculated through a Monte Carlo simulation analysis prepared by an independent third party.
The following table sets forth the adjustments we made in the pay-versus-performance table in order to arrive at the amount of compensation “actually paid” to our NEOs:
Adjustments to Determine Compensation “Actually Paid” for PEO ($) | | 2025 |
Deduction for Amounts Reported under the “Stock Awards” Column in the Summary Compensation Table | (13,170,931) | |
Increase in Fair Value of Awards Granted during year that Remain Unvested as of Year-end, determined as of Year-end | 5,630,897 | |
Increase/deduction for Change in Fair Value from Prior Year-end to current Year-end of Awards Granted Prior to year that were Outstanding and Unvested as of Year-end | (3,528,456) | |
Increase/deduction for Change in Fair Value from Prior Year-end to Vesting Date of Awards Granted Prior to year that Vested during year | (178,770) | |
Total Adjustments |
| (11,247,260) |
Adjustments to Determine Compensation “Actually Paid” for Non-PEO NEOs (Average)($) | | 2025 |
Deduction for Amounts Reported under the “Stock Awards” Column in the Summary Compensation Table | (1,196,683) | |
Increase in Fair Value of Awards Granted during year that Remain Unvested as of Year-end, determined as of Year-end | 787,592 | |
Increase/deduction for Change in Fair Value from Prior Year-end to current Year-end of Awards Granted Prior to year that were Outstanding and Unvested as of Year-end | (784,045) | |
Increase/deduction for Change in Fair Value from Prior Year-end to Vesting Date of Awards Granted Prior to year that Vested during year | (58,494) | |
Total Adjustments |
| (1,251,630) |
| (2) | Represents the value of an investment of $100 on December 31, 2020, and that all dividends, if any, were reinvested. |
Year | | PEO | | Non-PEO NEOs |
2025 | William M. Walker | Gregory A. Florkowski, Stephen P. Theobald, Daniel J. Groman and Paula A. Pryor | ||
2024 | William M. Walker | Gregory A. Florkowski, Stephen P. Theobald, Daniel J. Groman and Paula A. Pryor | ||
2023 | William M. Walker | Gregory A. Florkowski, Howard W. Smith, Stephen P. Theobald, and Richard M. Lucas | ||
2022 | William M. Walker | Gregory A. Florkowski, Howard W. Smith, Stephen P. Theobald, Richard M. Lucas and Paula A. Pryor | ||
2021 | William M. Walker | Stephen P. Theobald, Howard W. Smith, Richard M. Lucas and Paula A. Pryor |
The following table sets forth the adjustments we made in the pay-versus-performance table in order to arrive at the amount of compensation “actually paid” to our NEOs:
Adjustments to Determine Compensation “Actually Paid” for PEO ($) | | 2025 |
Deduction for Amounts Reported under the “Stock Awards” Column in the Summary Compensation Table | (13,170,931) | |
Increase in Fair Value of Awards Granted during year that Remain Unvested as of Year-end, determined as of Year-end | 5,630,897 | |
Increase/deduction for Change in Fair Value from Prior Year-end to current Year-end of Awards Granted Prior to year that were Outstanding and Unvested as of Year-end | (3,528,456) | |
Increase/deduction for Change in Fair Value from Prior Year-end to Vesting Date of Awards Granted Prior to year that Vested during year | (178,770) | |
Total Adjustments |
| (11,247,260) |
The following table sets forth the adjustments we made in the pay-versus-performance table in order to arrive at the amount of compensation “actually paid” to our NEOs:
Adjustments to Determine Compensation “Actually Paid” for Non-PEO NEOs (Average)($) | | 2025 |
Deduction for Amounts Reported under the “Stock Awards” Column in the Summary Compensation Table | (1,196,683) | |
Increase in Fair Value of Awards Granted during year that Remain Unvested as of Year-end, determined as of Year-end | 787,592 | |
Increase/deduction for Change in Fair Value from Prior Year-end to current Year-end of Awards Granted Prior to year that were Outstanding and Unvested as of Year-end | (784,045) | |
Increase/deduction for Change in Fair Value from Prior Year-end to Vesting Date of Awards Granted Prior to year that Vested during year | (58,494) | |
Total Adjustments |
| (1,251,630) |
The following reflects the financial measures that we have determined represent the most important financial measures used to link compensation actually paid to performance for 2025:
Most Important Financial Measures for 2025 |
Diluted Earnings Per Share |
Return on Equity (ROE) |
Total Revenues |
Adjusted EBITDA |