Pay vs Performance Disclosure - USD ($)
Dec. 31, 2025
Dec. 31, 2024
Dec. 31, 2023
Dec. 31, 2022
Dec. 31, 2021
DODD-FRANK MANDATED PAY VERSUS PERFORMANCE DISCLOSURE
As required by Section 953(a) of the Dodd-Frank Wall Street Reform and Consumer Protection Act, and Item 402(v) of Regulation S-K, the Company must annually disclose in its proxy statement the relationship between Company performance and the “compensation actually paid” (“CAP”) to the Principal Executive Officer (“PEO”) and other NEOs.
The following tables and related disclosures contain information regarding PEO CAP and the average CAP to our NEOs for each of the last five years. They also provide information regarding company performance over the same periods and the relationship of CAP to company performance. For information about how the Compensation Committee seeks to align pay with performance when making compensation decisions, see “Compensation Discussion and Analysis.”
Pay Versus Performance Table
Value of Initial Fixed $100 Investment Based On: | ||||||||||||||||||||||||||||||||||||||||||||||||||||||||
| Year | Summary Compensation Table Total for PEO1 ($) | Compensation Actually Paid to PEO2 ($) | Average Summary Compensation Table Total for Non-PEO NEOs3 ($) | Average Compensation Actually Paid to Non-PEO NEOs4 ($) | Total Shareholder Return5 ($) | Peer Group Total Shareholder Return6 ($) | GAAP Net Income (Loss) ($ in thousands) | |||||||||||||||||||||||||||||||||||||||||||||||||
2025 | 14,467,393 | 127,861,600 | 4,540,877 | 44,102,871 | 523 | 120 | (1,276,775) | |||||||||||||||||||||||||||||||||||||||||||||||||
2024 | 10,943,571 | 51,862,690 | 4,123,249 | 19,665,192 | 207 | 91 | (913,772) | |||||||||||||||||||||||||||||||||||||||||||||||||
2023 | 10,411,260 | 17,719,035 | 4,169,997 | 7,124,646 | 93 | 92 | (749,567) | |||||||||||||||||||||||||||||||||||||||||||||||||
2022 | 7,789,898 | 4,334,915 | 3,964,362 | 2,740,466 | 60 | 89 | (481,534) | |||||||||||||||||||||||||||||||||||||||||||||||||
2021 | 7,322,642 | 2,807,467 | 3,323,439 | 1,870,969 | 82 | 99 | (434,654) | |||||||||||||||||||||||||||||||||||||||||||||||||
1.Reflects compensation (as reported in the Summary Compensation Table (“SCT”)) for our Chair and CEO, Mr. Lewis, who served as our PEO in all five years.
2.Calculated in accordance with Item 402(v)(2) of Regulation S-K. The following adjustments were made to Mr. Lewis’s SCT total compensation as reported in the SCT for 2025 to determine CAP.
| Year | Summary Compensation Table Total ($) | Deductions for Reported Grant Date Fair Value of Stock AwardsA ($) | Deductions for Reported Grant Date Fair Value of Option AwardsA ($) | Additions for Pay Versus Performance Equity AdjustmentsB ($) | Compensation Actually Paid ($) | |||||||||||||||||||||||||||||||||
2025 | 14,467,393 | (2,999,940) | (9,000,033) | 125,394,180 | 127,861,600 | |||||||||||||||||||||||||||||||||
A.Reflects the amounts reported in the Stock Awards and Option Awards columns of the SCT.
B.The pay versus performance equity adjustments reflect the aggregated sum of the following values.
| Year | Year-End Fair Value of Outstanding and Unvested Equity Awards Granted in the Covered Year ($) | Year Over Year Change in Fair Value of Outstanding and Unvested Equity Awards Granted in Prior Years ($) | Year Over Year Change in Fair Value of Equity Awards Granted in Prior Years that Vested in the Covered Year ($) | Total Pay Versus Performance Equity AdjustmentsC ($) | ||||||||||||||||||||||||||||
| 2025 | 33,719,805 | 65,026,329 | 26,648,045 | 125,394,180 | ||||||||||||||||||||||||||||
C.Amounts may not sum due to rounding of underlying elements for reporting purposes.
1.Measurement date equity fair values are calculated with assumptions derived on a basis consistent with those used for grant date fair value purposes. RSUs are valued based on the closing stock price on the relevant measurement date. Prior to vesting, PSUs were valued with an assumed payout factor of 0%, consistent with the assumption for ASC 718 purposes. For 2025, the value of PSUs reflects the number of PSUs that vested multiplied by the closing stock price on the date of vesting. Stock options are valued using a Black-Scholes model as at the relevant measurement dates.
3.Reflects compensation for the following non-PEO NEOs:
2025: Ms. Bonstein, Mr. Adsett, Dr. Flammer, and Mr. Smith
2022, 2023 and 2024: Ms. Bonstein, Mr. Adsett, Dr. Flammer, and Mr. Wise
2021: Ms. Bonstein, Mr. Adsett, Dr. Flammer, Ms. Schaeffer, and Ms. Pellizzari
4.Average CAP for the non-PEO NEOs has been calculated in accordance with Item 402(v)(2) of Regulation S-K. The following adjustments were made to average 2025 SCT total compensation to determine average CAP.
| Year | Average Summary Compensation Table Total ($) | Deductions for Average Reported Grant Date Fair Value of Stock AwardsA ($) | Deductions for Average Reported Grant Date Fair Value of Option AwardsA ($) | Additions for Average Pay Versus Performance Equity AdjustmentsB ($) | Average Compensation Actually PaidC ($) | |||||||||||||||||||||||||||||||||
2025 | 4,540,877 | (843,712) | (2,531,119) | 42,936,825 | 44,102,871 | |||||||||||||||||||||||||||||||||
A.Reflects the average amounts reported in the Stock Awards and Option Awards columns of the SCT.
B.The pay versus performance equity adjustments reflect the aggregated sum of the following values.
| Year | Average Year-End Fair Value of Outstanding and Unvested Equity Awards Granted in the Covered Year ($) | Average Year Over Year Change in Fair Value of Outstanding and Unvested Equity Awards Granted in Prior Years ($) | Average Year Over Year Change in Fair Value of Equity Awards Granted in Prior Years that Vested in the Covered Year ($) | Total Pay Versus Performance Equity AdjustmentsC ($) | ||||||||||||||||||||||||||||
2025 | 9,483,235 | 22,789,226 | 10,664,365 | 42,936,825 | ||||||||||||||||||||||||||||
C.Amounts may not sum due to rounding of underlying elements for reporting purposes.
5.Total shareholder return is the only financial performance measure that is currently, and was through the years presented in the table, used in incentive plans to link CAP to Company performance.
6.The Nasdaq Biotech Index is the selected Peer Group for TSR comparisons as included on the total return chart included on our Annual Report on Form 10-K for each reported year.
3.Reflects compensation for the following non-PEO NEOs:
2025: Ms. Bonstein, Mr. Adsett, Dr. Flammer, and Mr. Smith
2022, 2023 and 2024: Ms. Bonstein, Mr. Adsett, Dr. Flammer, and Mr. Wise
2021: Ms. Bonstein, Mr. Adsett, Dr. Flammer, Ms. Schaeffer, and Ms. Pellizzari
2.Calculated in accordance with Item 402(v)(2) of Regulation S-K. The following adjustments were made to Mr. Lewis’s SCT total compensation as reported in the SCT for 2025 to determine CAP.
| Year | Summary Compensation Table Total ($) | Deductions for Reported Grant Date Fair Value of Stock AwardsA ($) | Deductions for Reported Grant Date Fair Value of Option AwardsA ($) | Additions for Pay Versus Performance Equity AdjustmentsB ($) | Compensation Actually Paid ($) | |||||||||||||||||||||||||||||||||
2025 | 14,467,393 | (2,999,940) | (9,000,033) | 125,394,180 | 127,861,600 | |||||||||||||||||||||||||||||||||
A.Reflects the amounts reported in the Stock Awards and Option Awards columns of the SCT.
B.The pay versus performance equity adjustments reflect the aggregated sum of the following values.
| Year | Year-End Fair Value of Outstanding and Unvested Equity Awards Granted in the Covered Year ($) | Year Over Year Change in Fair Value of Outstanding and Unvested Equity Awards Granted in Prior Years ($) | Year Over Year Change in Fair Value of Equity Awards Granted in Prior Years that Vested in the Covered Year ($) | Total Pay Versus Performance Equity AdjustmentsC ($) | ||||||||||||||||||||||||||||
| 2025 | 33,719,805 | 65,026,329 | 26,648,045 | 125,394,180 | ||||||||||||||||||||||||||||
C.Amounts may not sum due to rounding of underlying elements for reporting purposes.
4.Average CAP for the non-PEO NEOs has been calculated in accordance with Item 402(v)(2) of Regulation S-K. The following adjustments were made to average 2025 SCT total compensation to determine average CAP.
| Year | Average Summary Compensation Table Total ($) | Deductions for Average Reported Grant Date Fair Value of Stock AwardsA ($) | Deductions for Average Reported Grant Date Fair Value of Option AwardsA ($) | Additions for Average Pay Versus Performance Equity AdjustmentsB ($) | Average Compensation Actually PaidC ($) | |||||||||||||||||||||||||||||||||
2025 | 4,540,877 | (843,712) | (2,531,119) | 42,936,825 | 44,102,871 | |||||||||||||||||||||||||||||||||
A.Reflects the average amounts reported in the Stock Awards and Option Awards columns of the SCT.
B.The pay versus performance equity adjustments reflect the aggregated sum of the following values.
| Year | Average Year-End Fair Value of Outstanding and Unvested Equity Awards Granted in the Covered Year ($) | Average Year Over Year Change in Fair Value of Outstanding and Unvested Equity Awards Granted in Prior Years ($) | Average Year Over Year Change in Fair Value of Equity Awards Granted in Prior Years that Vested in the Covered Year ($) | Total Pay Versus Performance Equity AdjustmentsC ($) | ||||||||||||||||||||||||||||
2025 | 9,483,235 | 22,789,226 | 10,664,365 | 42,936,825 | ||||||||||||||||||||||||||||
C.Amounts may not sum due to rounding of underlying elements for reporting purposes.
Compensation Actually Paid versus Company Performance
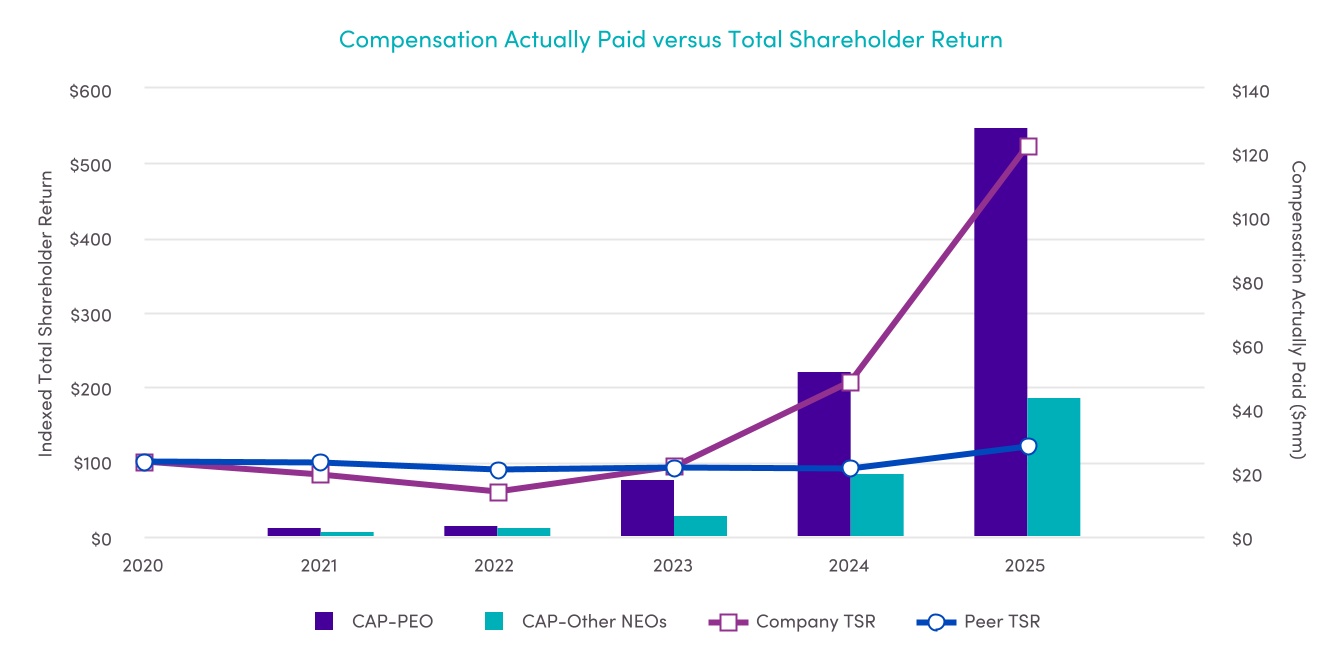
The following graph visually describes the relationship between CAP to our PEO and the average CAP to our non-PEO NEOs, to the cumulative TSR of Insmed. In addition, the graph compares the cumulative TSR of Insmed to our selected peer group, the Nasdaq Biotech Index.
Compensation Actually Paid versus Company Performance
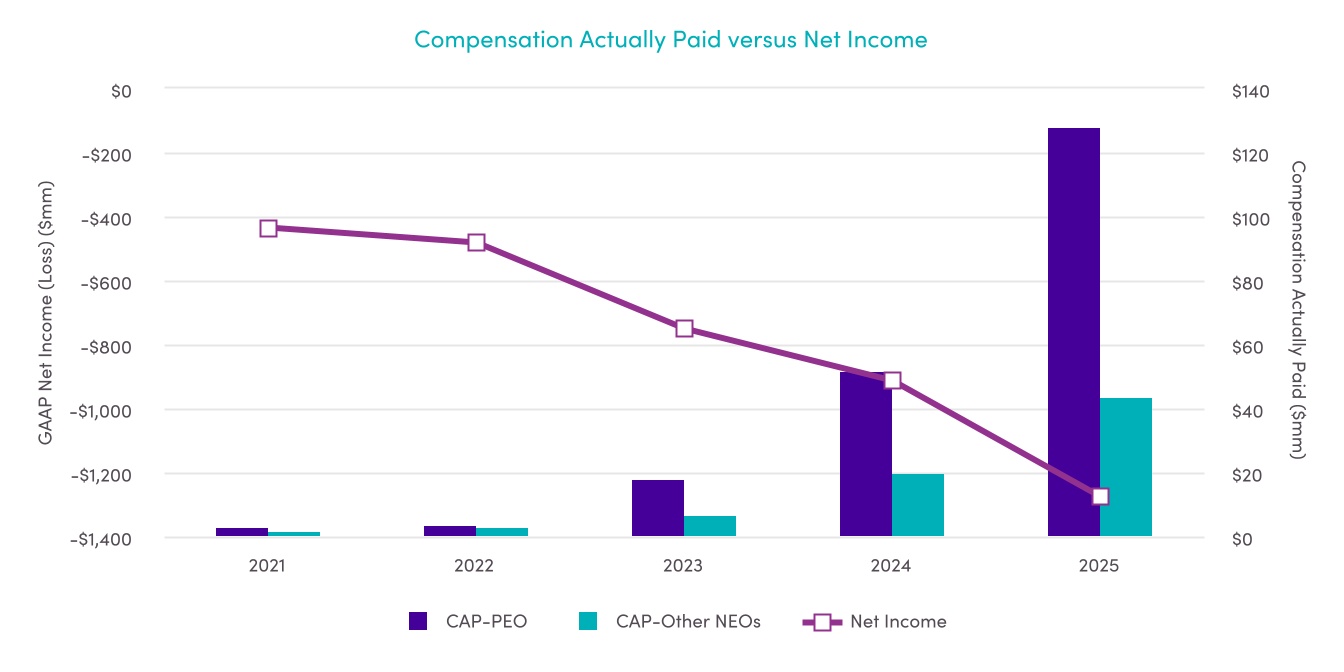
The following graph visually describes the relationship between CAP to our PEO and the average CAP to our non-PEO NEOs, to GAAP net income (loss). Insmed does not consider GAAP net income (loss) as a relevant measure for determining our executive compensation given the lifecycle stage of our company. The movement in CAP across the five-year time horizon does not move meaningfully or deliberately in relation to the reported GAAP net income (loss).
Compensation Actually Paid versus Company Performance
The following graph visually describes the relationship between CAP to our PEO and the average CAP to our non-PEO NEOs, to the cumulative TSR of Insmed. In addition, the graph compares the cumulative TSR of Insmed to our selected peer group, the Nasdaq Biotech Index.
Compensation Actually Paid versus Company Performance
The following graph visually describes the relationship between CAP to our PEO and the average CAP to our non-PEO NEOs, to the cumulative TSR of Insmed. In addition, the graph compares the cumulative TSR of Insmed to our selected peer group, the Nasdaq Biotech Index.
Tabular List of Company Performance Measures
As further described in our CD&A, we believe that the compensation opportunities for our NEOs should be predominantly variable with a significant portion in the form of short-term and long-term incentives. Given the current life-cycle stage of Insmed, financial measures do not feature meaningfully in our incentive plan design, which instead focuses on pipeline progress across our three therapeutic areas and stock price performance. For the fiscal year ending December 31, 2025, the only financial performance measure used to link CAP to our NEOs to company performance was total shareholder return. Total shareholder return was used on a relative basis to assess performance in respect of the 2022 PSUs, which vested during 2025. As a result of total shareholder return already being included in the pay versus performance table, no company-selected measure is reported.
TABULAR LIST OF MOST IMPORTANT MEASURES | |||||||||||
(1) | Total Shareholder Return | ||||