Pay vs Performance Disclosure - USD ($)
Dec. 31, 2025
Dec. 31, 2024
Dec. 31, 2023
Dec. 31, 2022
Dec. 31, 2021
Year(1) | Summary Compensation Table Total for PEO | Compensation Actually Paid to PEO (2) | Average Summary Compensation Table Total for non-PEO Named Executive Officers | Average Compensation Actually Paid to non-PEO Named Executive Officers (2) | Value of Initial Fixed $100 Investment Based On: | Net Income (millions) | Performance- Based Income (millions) (5) | ||||||||||||||||||||||||||||||||||||||||
Total Shareholder Return (3) | Peer Group Total Shareholder Return (4) | ||||||||||||||||||||||||||||||||||||||||||||||
| 2025 | $8,753,165 | $11,974,575 | $7,056,733 | $8,738,008 | $277.70 | $287.03 | $1,667 | $1,873 | |||||||||||||||||||||||||||||||||||||||
| 2024 | 7,069,657 | 7,651,106 | 5,008,546 | 5,433,725 | 209.17 | 255.91 | 1,414 | 1,865 | |||||||||||||||||||||||||||||||||||||||
| 2023 | 6,918,337 | 7,276,014 | 4,804,732 | 5,086,696 | 162.96 | 165.68 | 1,434 | 1,601 | |||||||||||||||||||||||||||||||||||||||
| 2022 | 6,439,183 | 6,487,578 | 4,516,160 | 4,506,675 | 130.73 | 156.52 | 822 | 1,159 | |||||||||||||||||||||||||||||||||||||||
| 2021 | 6,119,523 | 6,727,729 | 5,413,003 | 5,925,474 | 128.89 | 127.73 | 1,562 | 1,211 | |||||||||||||||||||||||||||||||||||||||
| Year | PEO | Non-PEO NEOs | |||||||||
| 2025 | Benjamin J. Tisch | Jane J. Wang, Kenneth I. Siegel, Richard W. Scott and Alexander H. Tisch | |||||||||
| 2024 | James S. Tisch | Jane J. Wang, Jonathan M. Tisch, Kenneth I. Siegel and Richard W. Scott | |||||||||
| 2023 | James S. Tisch | Jane J. Wang, Jonathan M. Tisch, Kenneth I. Siegel and Richard W. Scott | |||||||||
| 2022 | James S. Tisch | David B. Edelson, Jane J. Wang, Jonathan M. Tisch, Kenneth I. Siegel and Richard W. Scott | |||||||||
| 2021 | James S. Tisch | David B. Edelson, Andrew H. Tisch, Jonathan M. Tisch and Kenneth I. Siegel | |||||||||
| Adjustment | PEO | Non-PEO NEOs | ||||||||||||||||||
| Deduction of the aggregate change in the actuarial present value of the named executive officer’s accumulated benefit under all defined benefit and actuarial pension plans reported in the Summary Compensation Table | 2025 | $(2,819) | 2025 | $(60,074) | ||||||||||||||||
| 2024 | 0 | 2024 | (54,984) | |||||||||||||||||
| 2023 | (153,220) | 2023 | (116,857) | |||||||||||||||||
| 2022 | 0 | 2022 | (46,198) | |||||||||||||||||
| 2021 | 0 | 2021 | (31,535) | |||||||||||||||||
| Deduction of the amounts reported in the Summary Compensation Table in respect of all stock and option/SAR awards | 2025 | (4,993,500) | 2025 | (2,615,906) | ||||||||||||||||
| 2024 | (1,000,000) | 2024 | (850,000) | |||||||||||||||||
| 2023 | (1,000,000) | 2023 | (850,000) | |||||||||||||||||
| 2022 | (1,000,000) | 2022 | (700,000) | |||||||||||||||||
| 2021 | (900,000) | 2021 | (805,000) | |||||||||||||||||
| Addition of the fair value as of the end of the year of all stock and option/SAR awards granted during the year that were outstanding and unvested as of the end of the year | 2025 | 7,852,764 | 2025 | 3,974,995 | ||||||||||||||||
| 2024 | 1,159,322 | 2024 | 985,411 | |||||||||||||||||
| 2023 | 1,149,349 | 2023 | 976,957 | |||||||||||||||||
| 2022 | 959,353 | 2022 | 671,518 | |||||||||||||||||
| 2021 | 1,108,068 | 2021 | 991,104 | |||||||||||||||||
| Addition of the change as of the end of the year (from the end of the prior year) in fair value (whether positive or negative) of stock and option/SAR awards granted in any prior year that were outstanding and unvested as of the end of the year | 2025 | 345,013 | 2025 | 357,788 | ||||||||||||||||
| 2024 | 373,574 | 2024 | 308,225 | |||||||||||||||||
| 2023 | 293,199 | 2023 | 222,123 | |||||||||||||||||
| 2022 | 15,770 | 2022 | 9,181 | |||||||||||||||||
| 2021 | 335,839 | 2021 | 216,430 | |||||||||||||||||
| Adjustment | PEO | Non-PEO NEOs | ||||||||||||||||||
| Addition of the change as of the vesting date (from the end of the prior year) in fair value (whether positive or negative) of any stock and option/SAR awards granted in any prior year for which all applicable vesting conditions were satisfied as of the end of or during the year | 2025 | 19,952 | 2025 | 24,472 | ||||||||||||||||
| 2024 | 48,553 | 2024 | 36,527 | |||||||||||||||||
| 2023 | 68,349 | 2023 | 49,741 | |||||||||||||||||
| 2022 | 73,272 | 2022 | 56,014 | |||||||||||||||||
| 2021 | 64,299 | 2021 | 141,472 | |||||||||||||||||
| Adjustment | PEO | Non-PEO NEOs | ||||||||||||||||||
| Deduction of the aggregate change in the actuarial present value of the named executive officer’s accumulated benefit under all defined benefit and actuarial pension plans reported in the Summary Compensation Table | 2025 | $(2,819) | 2025 | $(60,074) | ||||||||||||||||
| 2024 | 0 | 2024 | (54,984) | |||||||||||||||||
| 2023 | (153,220) | 2023 | (116,857) | |||||||||||||||||
| 2022 | 0 | 2022 | (46,198) | |||||||||||||||||
| 2021 | 0 | 2021 | (31,535) | |||||||||||||||||
| Deduction of the amounts reported in the Summary Compensation Table in respect of all stock and option/SAR awards | 2025 | (4,993,500) | 2025 | (2,615,906) | ||||||||||||||||
| 2024 | (1,000,000) | 2024 | (850,000) | |||||||||||||||||
| 2023 | (1,000,000) | 2023 | (850,000) | |||||||||||||||||
| 2022 | (1,000,000) | 2022 | (700,000) | |||||||||||||||||
| 2021 | (900,000) | 2021 | (805,000) | |||||||||||||||||
| Addition of the fair value as of the end of the year of all stock and option/SAR awards granted during the year that were outstanding and unvested as of the end of the year | 2025 | 7,852,764 | 2025 | 3,974,995 | ||||||||||||||||
| 2024 | 1,159,322 | 2024 | 985,411 | |||||||||||||||||
| 2023 | 1,149,349 | 2023 | 976,957 | |||||||||||||||||
| 2022 | 959,353 | 2022 | 671,518 | |||||||||||||||||
| 2021 | 1,108,068 | 2021 | 991,104 | |||||||||||||||||
| Addition of the change as of the end of the year (from the end of the prior year) in fair value (whether positive or negative) of stock and option/SAR awards granted in any prior year that were outstanding and unvested as of the end of the year | 2025 | 345,013 | 2025 | 357,788 | ||||||||||||||||
| 2024 | 373,574 | 2024 | 308,225 | |||||||||||||||||
| 2023 | 293,199 | 2023 | 222,123 | |||||||||||||||||
| 2022 | 15,770 | 2022 | 9,181 | |||||||||||||||||
| 2021 | 335,839 | 2021 | 216,430 | |||||||||||||||||
| Adjustment | PEO | Non-PEO NEOs | ||||||||||||||||||
| Addition of the change as of the vesting date (from the end of the prior year) in fair value (whether positive or negative) of any stock and option/SAR awards granted in any prior year for which all applicable vesting conditions were satisfied as of the end of or during the year | 2025 | 19,952 | 2025 | 24,472 | ||||||||||||||||
| 2024 | 48,553 | 2024 | 36,527 | |||||||||||||||||
| 2023 | 68,349 | 2023 | 49,741 | |||||||||||||||||
| 2022 | 73,272 | 2022 | 56,014 | |||||||||||||||||
| 2021 | 64,299 | 2021 | 141,472 | |||||||||||||||||
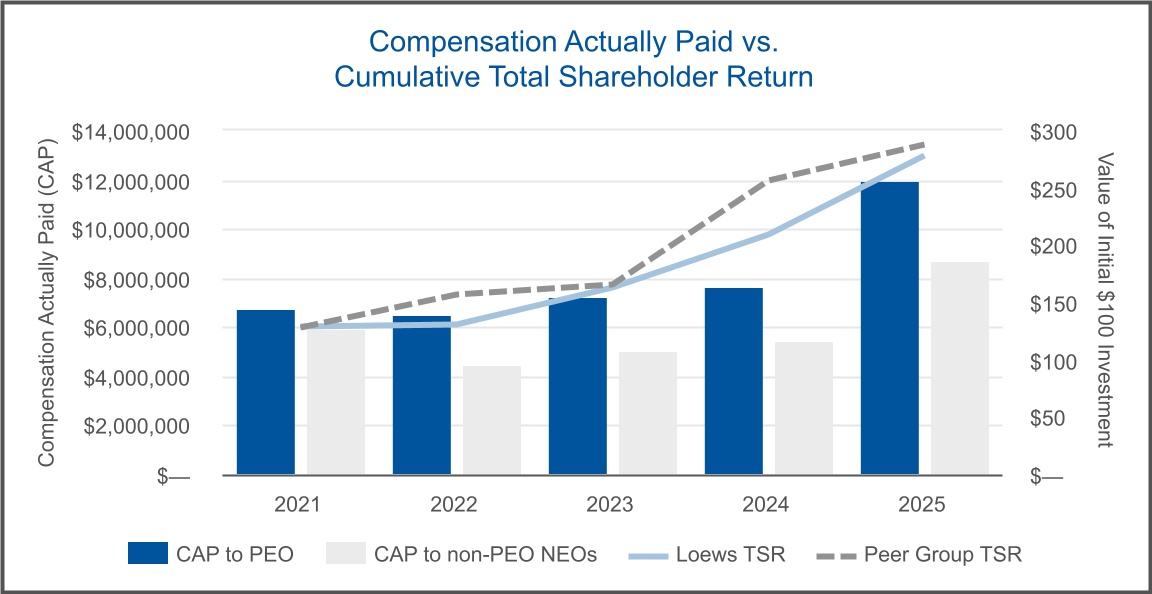
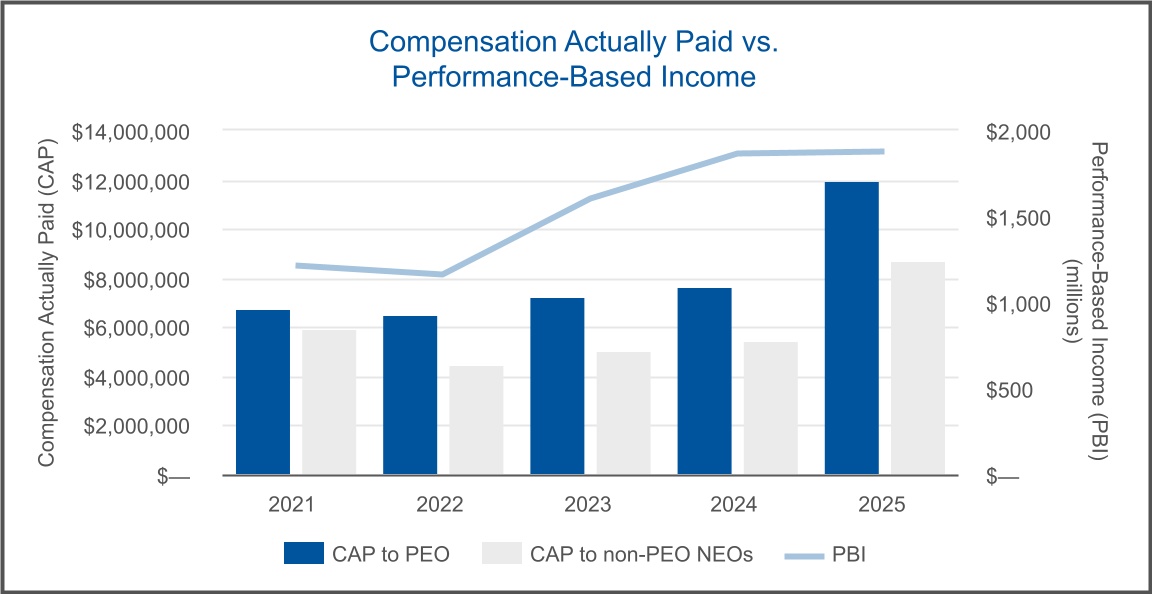
The following graphs show the relationships between compensation actually paid to the PEO and the average compensation actually paid to the non-PEO NEOs and certain performance metrics during the years covered by the Pay Versus Performance Table.
The following graphs show the relationships between compensation actually paid to the PEO and the average compensation actually paid to the non-PEO NEOs and certain performance metrics during the years covered by the Pay Versus Performance Table.

The following graphs show the relationships between compensation actually paid to the PEO and the average compensation actually paid to the non-PEO NEOs and certain performance metrics during the years covered by the Pay Versus Performance Table.
The following graphs show the relationships between compensation actually paid to the PEO and the average compensation actually paid to the non-PEO NEOs and certain performance metrics during the years covered by the Pay Versus Performance Table.
| Financial Performance Measures | ||
| Performance-Based Income | ||
| Performance-Based Income per Share | ||