Pay Versus Performance Disclosure
Provided below is the Company’s “pay versus performance” disclosure as required pursuant to Item 402(v) of Regulation S-K promulgated under the Exchange Act. This disclosure has been prepared in accordance with Item 402(v) and does not necessarily reflect value actually realized by the executives or how the Compensation Committee evaluates compensation decisions in light of Company or individual performance. Please refer to CD&A for a discussion of our executive compensation program objectives and the ways in which we align executive compensation pay with performance.
There is one primary difference between the calculation of the components of "compensation actually paid" (or "CAP") and "summary compensation table" (or "SCT") total compensation:
|
SCT Total |
CAP |
Stock and Option Awards |
Grant date fair value of stock and option awards granted during the year |
Year over year change in the fair value of stock and option awards that are unvested as of the end of the year, or vested or were forfeited during the year, including dividend equivalents, as applicable |
Metrics Used for Linking Pay and Performance
The following is a list of performance measures, which in our assessment represent the most important performance measures used by the Company to link compensation actually paid to the NEOs for 2025. Each metric below is used for purposes of determining payouts under either our short-term incentive program or vesting of our PSU awards. Please see CD&A for a further description of these metrics and how they are used in the Company’s executive compensation program.
Comparable Store Sales Growth |
GAAP Operating Income |
Adjusted Earnings Per Share (EPS) |
Relative Total Shareholder Return (RTSR) |
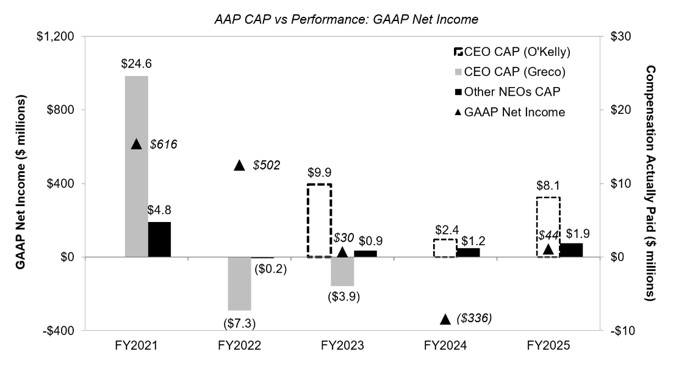
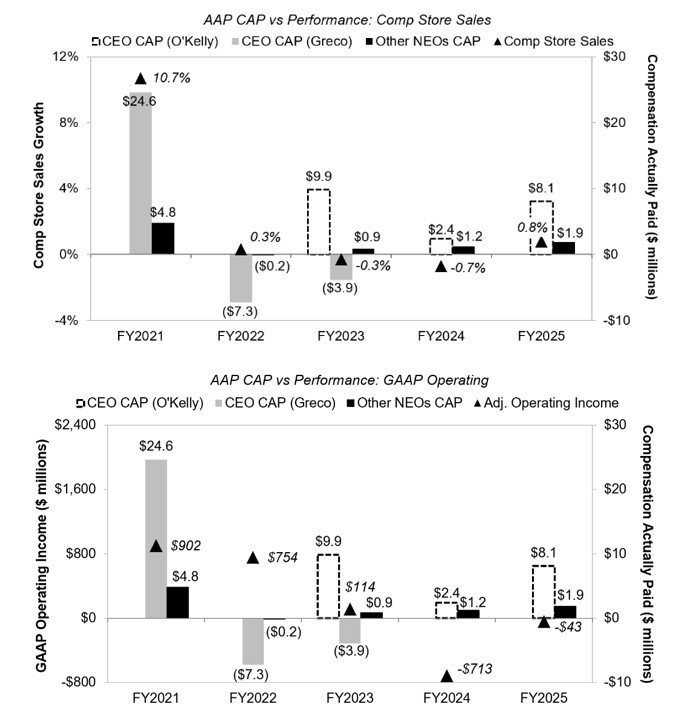
Comparable Store Sales Growth and GAAP Operating Income were selected as the Company-selected measures for the Pay versus Performance table that follows because these metrics have the strongest alignment with the key attributes of strategic and operating plans and help drive the creation of long-term shareholder value.
Pay Versus Performance Table
|
|
|
|
|
|
|
|
Value of Initial Fixed |
|
Company Selected Measure |
||
Year |
|
SCT Total |
SCT Total |
CAP to |
CAP to Former |
Average SCT |
Average CAP |
Total Share- |
Peer Group |
GAAP Net |
Comp. Store |
GAAP Operating |
2025 |
|
$9,121,929 |
— |
$8,097,581 |
— |
$2,350,518 |
$1,885,537 |
$27.63 |
$153.60 |
$44 |
0.8% |
$(43) |
2024 |
|
$10,303,636 |
— |
$2,396,573 |
— |
$2,324,139 |
$1,196,441 |
$30.60 |
$151.26 |
$(336) |
(0.7)% |
$(713) |
2023 |
|
$9,439,086 |
$4,139,044 |
$9,853,745 |
$(3,934,421) |
$2,163,565 |
$875,625 |
$41.63 |
$111.65 |
$30 |
(0.3)% |
$114 |
2022 |
|
— |
$8,384,948 |
— |
$(7,267,775) |
$2,008,124 |
$(169,402) |
$98.22 |
$78.41 |
$502 |
0.3% |
$754 |
2021 |
|
— |
$10,052,271 |
— |
$24,632,043 |
$2,684,996 |
$4,775,021 |
$154.68 |
$119.31 |
$616 |
10.7% |
$902 |
Reconciliation of SCT to CAP for CEO:
|
Fiscal Year 2025 |
|
|
CEO (O’Kelly) |
Avg. Other |
SCT Total |
$9,121,929 |
$2,350,518 |
Minus SCT Change in Pension Value |
$— |
$— |
Plus Pension Value Service Cost |
$— |
$— |
Minus SCT Equity |
$6,335,529 |
$1,255,453 |
Plus End of Year Fair Value of Equity Granted During FY Outstanding and Unvested at End of Year |
$5,272,230 |
$890,210 |
Plus (Minus) Change in Fair Value from Beginning of Year to End of Year of Awards Granted in Any Prior Fiscal Year Outstanding and Unvested at End of Year |
$(751,789) |
$(47,596) |
Plus (Minus) Change in Fair Value from Beginning of Year to Vesting Date of Awards Granted in Any Prior Fiscal Year that Vested During the Fiscal Year |
$790,740 |
$24,340 |
Minus Fair Value at Beginning of Year of Awards Granted in Prior Year that were Forfeited During the Fiscal Year |
— |
76,482 |
Compensation Actually Paid |
$8,097,581 |
$1,885,537 |
EOY = End of Year; BOY = Beginning of Year, SCT = Summary Compensation Table, CAP = Compensation Actually Paid
The fair value of option awards was determined using a Black-Scholes option-pricing model. The fair value of RSUs used to calculate CAP was based on the Company's closing stock price on each valuation date, including accrued dividend equivalent units. The fair value of PSUs used to calculate CAP assumes estimated performance results as of the end of each reporting year for financial metrics (average annual comparable store sales growth and return on invested capital, which were performance measures in our 2020 and 2021 PSU awards, and average comparable store sales growth and adjusted EPS, which are performance measures in our 2025 PSU awards) and a Monte Carlo simulation valuation model for market metrics (which were relative TSR vs. a peer group for the 2020 and 2021 PSUs and relative TSR vs. the constituents of the S&P 500 for the 2022, 2023, and 2024 PSUs and vs. the constituents of the S&P Specialty Retail Index for 2025 PSUs), in accordance with FASB ASC 718. Fair values include accrued dividend equivalent units.
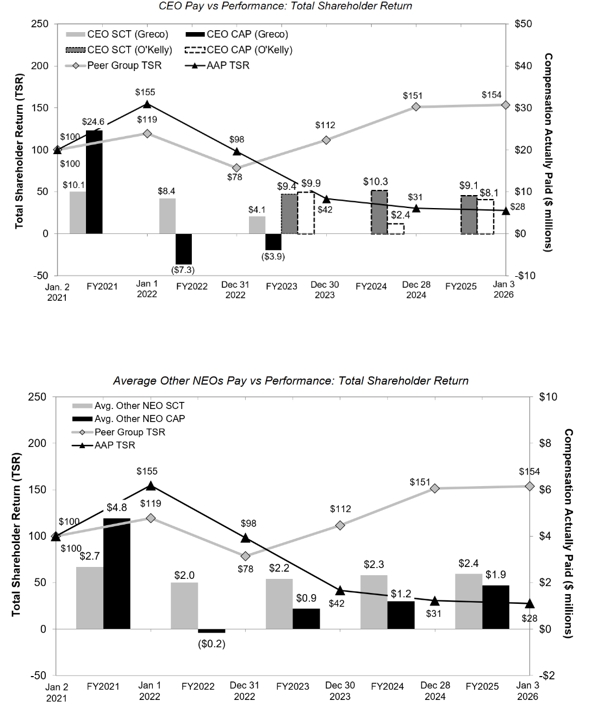
Relationship between Company TSR and Peer Group TSR; CAP and Company TSR
The graphs below illustrate the relationship between our TSR and the Peer Group TSR, as well as the relationship between CAP and our TSR for the CEO and other NEOs. For reference, SCT total compensation values for each year are also shown. As the graphs below illustrate, CAP amounts for our CEO and other NEOs are strongly aligned with the Company's TSR, as intended.
Reconciliation of SCT to CAP for CEO:
|
Fiscal Year 2025 |
|
|
CEO (O’Kelly) |
Avg. Other |
SCT Total |
$9,121,929 |
$2,350,518 |
Minus SCT Change in Pension Value |
$— |
$— |
Plus Pension Value Service Cost |
$— |
$— |
Minus SCT Equity |
$6,335,529 |
$1,255,453 |
Plus End of Year Fair Value of Equity Granted During FY Outstanding and Unvested at End of Year |
$5,272,230 |
$890,210 |
Plus (Minus) Change in Fair Value from Beginning of Year to End of Year of Awards Granted in Any Prior Fiscal Year Outstanding and Unvested at End of Year |
$(751,789) |
$(47,596) |
Plus (Minus) Change in Fair Value from Beginning of Year to Vesting Date of Awards Granted in Any Prior Fiscal Year that Vested During the Fiscal Year |
$790,740 |
$24,340 |
Minus Fair Value at Beginning of Year of Awards Granted in Prior Year that were Forfeited During the Fiscal Year |
— |
76,482 |
Compensation Actually Paid |
$8,097,581 |
$1,885,537 |
EOY = End of Year; BOY = Beginning of Year, SCT = Summary Compensation Table, CAP = Compensation Actually Paid
Comparable Store Sales Growth |
GAAP Operating Income |
Adjusted Earnings Per Share (EPS) |
Relative Total Shareholder Return (RTSR) |
Comparable Store Sales Growth and GAAP Operating Income were selected as the Company-selected measures for the Pay versus Performance table that follows because these metrics have the strongest alignment with the key attributes of strategic and operating plans and help drive the creation of long-term shareholder value.