Pay vs Performance Disclosure
Dec. 31, 2025
USD ($)
Pay Versus Performance
The following information has been prepared in accordance with the SEC’s pay versus performance (“PvP”) disclosure requirements under Item 402(v) of Regulation S-K for fiscal year 2025 (a “Covered Year”).
The Committee has implemented an executive compensation program that is intended to link a substantial portion of our NEOs’ total compensation to the achievement of various short- and long-term financial and operational metrics, and to be aligned with shareholder value. The Committee does not consider the Compensation Actually Paid (“CAP”) metric as a basis for making compensation decisions. We invite you to refer to the CD&A for details on how we align pay with performance, and how the Committee approaches designing our executive compensation program.
2025 Pay Versus Performance
Value of Initial Fixed $100 Investment Based On: | ||||||||||||||||||||||||||
Year (1) | Summary Compensation Table Total for PEO(2) | Compensation Actually Paid to PEO(3) | Average Summary Compensation Table Total for Non-PEO NEOs(4) | Average Compensation Actually Paid to Non-PEO NEOs(5) | Total Shareholder Return(6) | Peer Group Total Shareholder Return(7) | Net Income (000s)(8) | Operating EBIT as a % of Net Sales(9) | ||||||||||||||||||
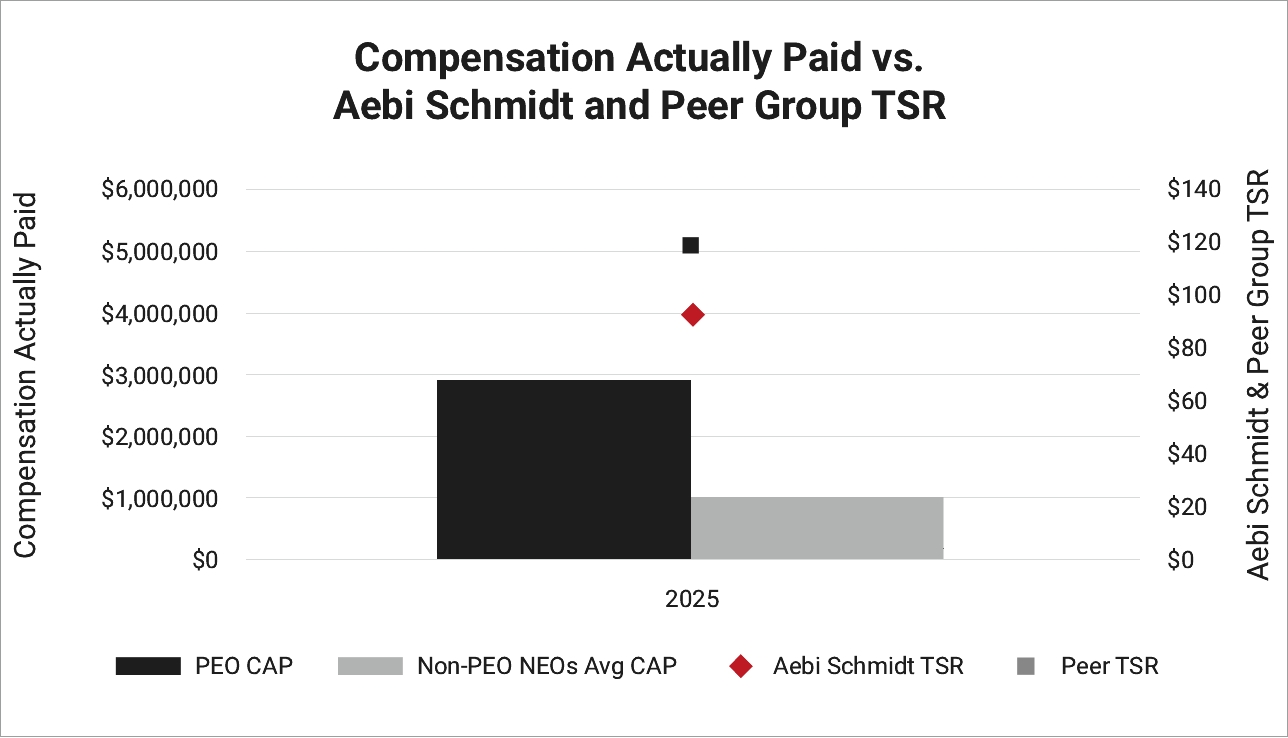
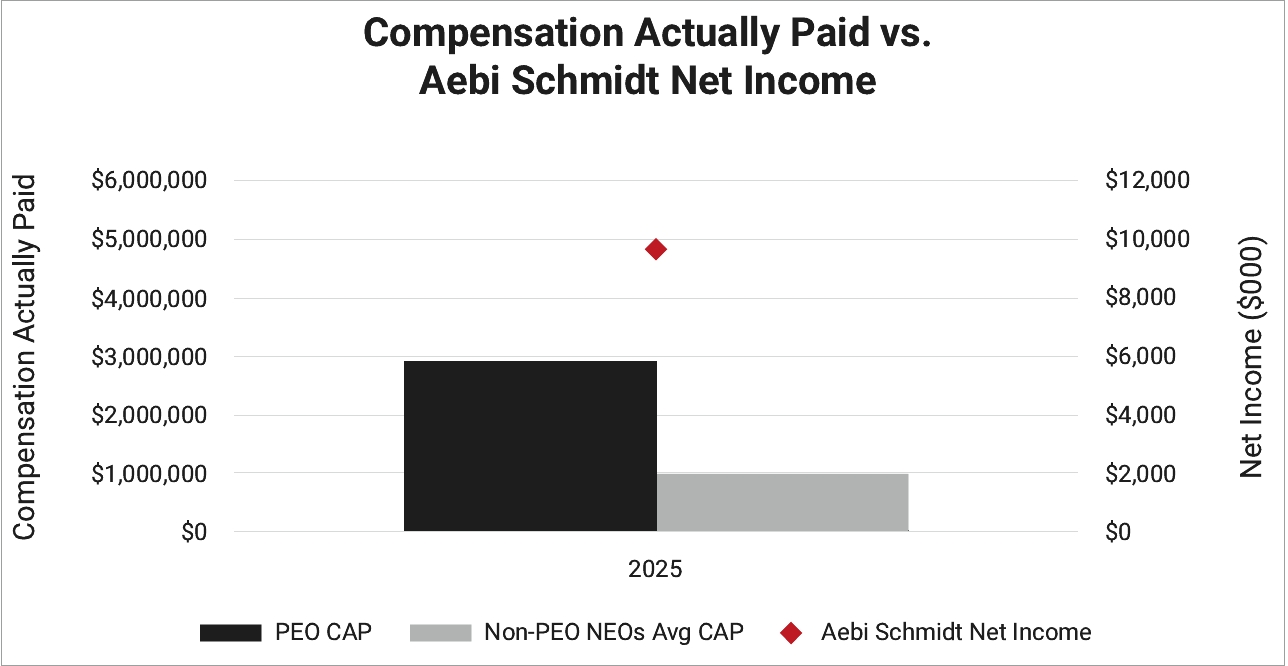
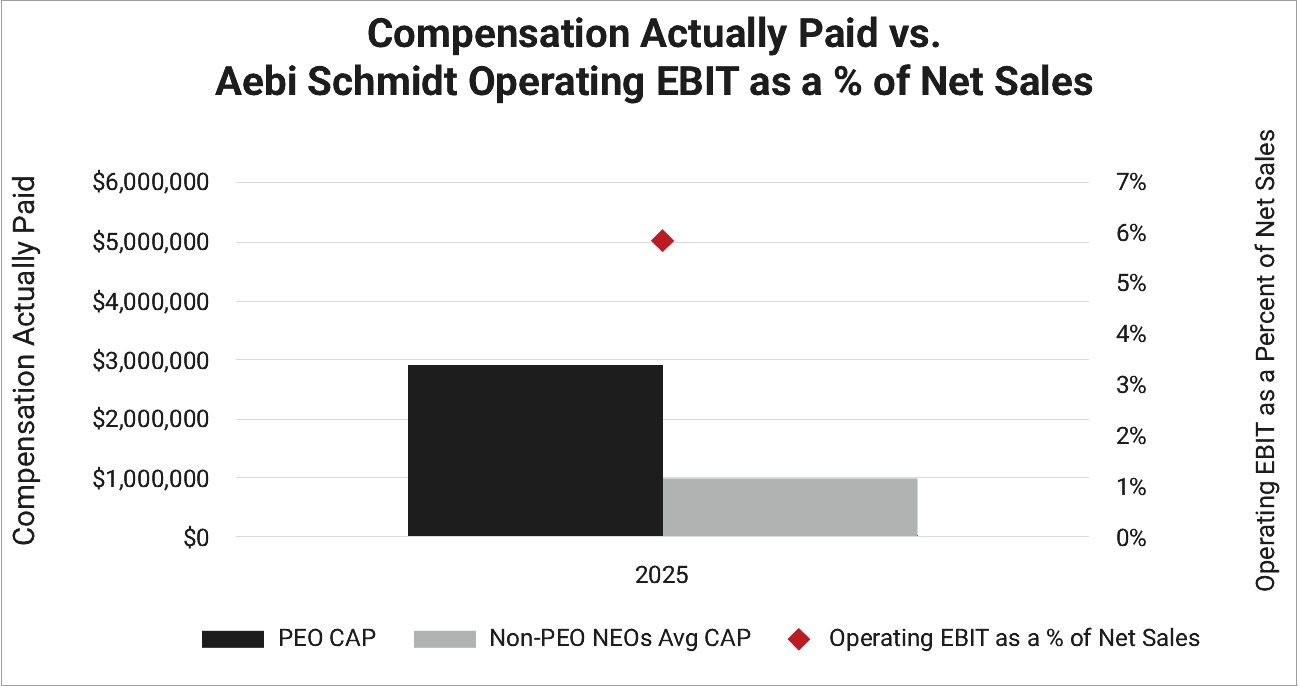
2025 | $2,848,741 | $2,918,585 | $891,139 | $1,007,872 | $93 | $120 | $9,706 | 5.9% | ||||||||||||||||||
(1) | Indicates the Covered Year. |
(2) | Contains the Total Compensation from the 2025 Summary Compensation Table (“SCT”) for Mr. Fruithof, who served as our Principal Executive Officer (“PEO”) in 2025. |
(3) | The “Compensation Actually Paid to PEO” for Mr. Fruithof reflects the Total Compensation from the 2025 Summary Compensation Table, adjusted per the table below in accordance with the SEC rules for calculating CAP. |
Compensation Actually Paid to PEO | 2025 | ||||
SCT Total Compensation ($) | $2,848,741 | ||||
Less: Stock and Option Award Values Reported in SCT for the Covered Year ($) | (309,656) | ||||
Plus: Covered Year-End Fair Value for Stock and Option Awards Granted in and Outstanding at the End of the Covered Year ($) | 379,500 | ||||
Plus/Minus: Change in Fair Value (From Prior Year-End to Covered Year-End) of Outstanding Unvested Stock and Option Awards Granted Prior to the Covered Year ($) | 0 | ||||
Plus/Minus: Change in Fair Value (From Prior Year-End to Vesting Date) of Stock and Option Awards Granted Prior to the Covered Year that Vested in the Covered Year ($) | 0 | ||||
Compensation Actually Paid ($) | $2,918,585 | ||||
(4) | Contains the average Total Compensation of the NEOs other than the PEO from the 2025 Summary Compensation Table in the proxy statement for Covered Year shown in the table. The following Non-PEO NEOs are included in the average figures shown for 2025: |
Marco Portmann, Thomas Schenkirsch, Steffen Schewerda, Henning Schröder, and Tim Tecklenburg.
(5) | The “Average Compensation Actually Paid to Non-PEO NEOs” for the Covered Years reflects the average of the Non-PEO NEOs’ Total Compensation from the 2025 Summary Compensation Table, adjusted per the table below in accordance with the SEC rules for calculating the CAP. |
Average Compensation Actually Paid to Non-PEO NEOs | 2025 | ||||
SCT Total Compensation ($) | $891,139 | ||||
Less: Stock and Option Award Values Reported in SCT for the Covered Year ($) | (246,955) | ||||
Plus: Covered Year-End Fair Value for Stock and Option Awards Granted in and Outstanding at the End of the Covered Year ($) | 363,688 | ||||
Plus/Minus: Change in Fair Value (From Prior Year-End to Covered Year-End) of Outstanding Unvested Stock and Option Awards Granted Prior to the Covered Year ($) | 0 | ||||
Plus/Minus: Change in Fair Value (From Prior Year-End to Vesting Date) of Stock and Option Awards Granted Prior to the Covered Year that Vested in the Covered Year ($) | 0 | ||||
Compensation Actually Paid ($) | $1,007,872 | ||||
(6) | The Total Shareholder Return (“TSR”) assumes an initial investment of $100 in Aebi Schmidt stock on July 1, 2025 and shows the resulting cumulative TSR through December 31, 2025 (assuming reinvestment of any dividends). |
(7) | The Peer Group TSR assumes an initial investment of $100 in the Dow Jones Commercial Trucks and Vehicles Total Stock Market Index on July 1, 2025 and shows the resulting cumulative TSR through December 31, 2025 (assuming reinvestment of any dividends). |
(8) | Reflects the Company’s Net Income for 2025 as disclosed in the Company’s Consolidated Income Statements included in the Company’s Annual Report on Form 10-K for the year ended December 31, 2025. |
(9) | The Company-Selected Measure is Operating EBIT as a Percent of Net Sales, which is a non-GAAP financial measure defined as operating income less interest and taxes, divided by net sales and multiplied by 100. |
(2) | Contains the Total Compensation from the 2025 Summary Compensation Table (“SCT”) for Mr. Fruithof, who served as our Principal Executive Officer (“PEO”) in 2025. |
(4) | Contains the average Total Compensation of the NEOs other than the PEO from the 2025 Summary Compensation Table in the proxy statement for Covered Year shown in the table. The following Non-PEO NEOs are included in the average figures shown for 2025: |
Marco Portmann, Thomas Schenkirsch, Steffen Schewerda, Henning Schröder, and Tim Tecklenburg.
(7) | The Peer Group TSR assumes an initial investment of $100 in the Dow Jones Commercial Trucks and Vehicles Total Stock Market Index on July 1, 2025 and shows the resulting cumulative TSR through December 31, 2025 (assuming reinvestment of any dividends). |
(3) | The “Compensation Actually Paid to PEO” for Mr. Fruithof reflects the Total Compensation from the 2025 Summary Compensation Table, adjusted per the table below in accordance with the SEC rules for calculating CAP. |
Compensation Actually Paid to PEO | 2025 | ||||
SCT Total Compensation ($) | $2,848,741 | ||||
Less: Stock and Option Award Values Reported in SCT for the Covered Year ($) | (309,656) | ||||
Plus: Covered Year-End Fair Value for Stock and Option Awards Granted in and Outstanding at the End of the Covered Year ($) | 379,500 | ||||
Plus/Minus: Change in Fair Value (From Prior Year-End to Covered Year-End) of Outstanding Unvested Stock and Option Awards Granted Prior to the Covered Year ($) | 0 | ||||
Plus/Minus: Change in Fair Value (From Prior Year-End to Vesting Date) of Stock and Option Awards Granted Prior to the Covered Year that Vested in the Covered Year ($) | 0 | ||||
Compensation Actually Paid ($) | $2,918,585 | ||||
(5) | The “Average Compensation Actually Paid to Non-PEO NEOs” for the Covered Years reflects the average of the Non-PEO NEOs’ Total Compensation from the 2025 Summary Compensation Table, adjusted per the table below in accordance with the SEC rules for calculating the CAP. |
Average Compensation Actually Paid to Non-PEO NEOs | 2025 | ||||
SCT Total Compensation ($) | $891,139 | ||||
Less: Stock and Option Award Values Reported in SCT for the Covered Year ($) | (246,955) | ||||
Plus: Covered Year-End Fair Value for Stock and Option Awards Granted in and Outstanding at the End of the Covered Year ($) | 363,688 | ||||
Plus/Minus: Change in Fair Value (From Prior Year-End to Covered Year-End) of Outstanding Unvested Stock and Option Awards Granted Prior to the Covered Year ($) | 0 | ||||
Plus/Minus: Change in Fair Value (From Prior Year-End to Vesting Date) of Stock and Option Awards Granted Prior to the Covered Year that Vested in the Covered Year ($) | 0 | ||||
Compensation Actually Paid ($) | $1,007,872 | ||||
Listed below are the metrics we believe are the most important financial performance measures we used to link Compensation Actually Paid for 2025 (as described above) to Company performance for 2025.
Operating EBIT as a Percent of Net Sales
Net Working Capital Turnover
Order Intake Percent versus Prior Year
Adjusted EBITDA
(9) | The Company-Selected Measure is Operating EBIT as a Percent of Net Sales, which is a non-GAAP financial measure defined as operating income less interest and taxes, divided by net sales and multiplied by 100. |